

【实现自己的可视化引擎01】认识Canvas
【实现自己的可视化框架引擎02】抽象图像元素
【实现自己的可视化引擎03】构建基础图元库
【实现自己的可视化引擎04】图像元素动画
【实现自己的可视化引擎05】交互与事件
【实现自己的可视化引擎06】折线图
【实现自己的可视化引擎07】柱状图
【实现自己的可视化引擎08】条形图
【实现自己的可视化引擎09】饼图
【实现自己的可视化引擎10】散点图
【实现自己的可视化引擎11】雷达图
【实现自己的可视化引擎12】K线图
【实现自己的可视化引擎13】仪表盘
【实现自己的可视化引擎14】地图
【实现自己的可视化引擎15】关系图
前言
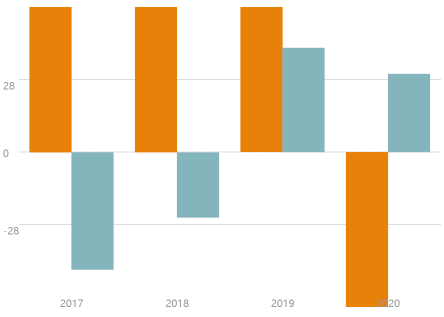
柱形图,又称长条图,是一种以长方形的长度为变量的统计图表。长条图用来比较两个或以上的价值(不同时间或者不同条件),只有一个变量,通常利用于较小的数据集分析。效果图如下:

[{
      label: '2017',
      data: [
        { color: '#D78521', value: 90 },
        { color: '#90B3BB', value: -45 }
        ]
    }, {
      label: '2018',
      data: [
        { color: '#D78521', value: 70 },
        { color: '#90B3BB', value: -25 }
      ]
    }, {
      label: '2019',
      data: [
        { color: '#D78521', value: 100 },
        { color: '#90B3BB', value: 40 }
      ]
    }, {
      label: '2020',
      data: [
        { color: '#D78521', value: -90 },
        { color: '#90B3BB', value: 30 }
      ]
    }]
组件使用代码:
render() {
    return (
      <Histogram
        data={data}
        className="chart"
        style={{
          fontFamily: 'PingFang SC',
          fontSize: 20,
          fontColor:'#999999',
          xFontSize: 20,
          yFontSize: 20,
        }}
      />
    )
  }
柱状图层
由上面效果图可以看出,我们柱状图有两种类型,一种是所有数据数值都大于0,另一种数据中有大于0同时存在小于0的数据。
当所有数据都大于0的情况,我们柱状图的坐标0轴位于底部,算法如下:
- 计算数据最大值,并根据最大Y坐标值计算单位数值占用的高度yStep;
- 计算每组数据柱图占用的宽度xStep;
- 遍历数据,根据公式(value - 0) / yStep 计算柱图的高度;
- 根据宽高绘制柱图矩形,并加入柱形图层。 代码实现如下:
// 计算绘图区域的高度
  const entityHeight = this.height - this.xFontSize;
  // 计算最大Y坐标值, 最大柱形占绘图区域的80%
  const maxValue = max / 0.8;
  // 根据最大Y坐标值计算单位数值占用的高度
  const yStep = maxValue / entityHeight;
  // 计算Y坐标线的高度步长
  const yAxisStep = entityHeight / this.yAxisGraduations;
  // 记录Y坐标值最大宽度
  let yFontMaxWidth = 0;
  // 绘制Y轴坐标值
  for (let i = 0; i < this.yAxisGraduations; i++) {
    const value = (i * yAxisStep * yStep).toFixed(this.enob);
    const yText = new Text(this.canvas, {
      text: value,
      font: this.fontFamily,
      size: this.yFontSize,
      color: this.fontColor,
    });
    // Y轴坐标值偏移
    const yShift = i === 0 ? 0 : i === this.yAxisGraduations - 1 ? yText.height : yText.height / 2;
    yText.setPosition(this.position.x, this.position.y + this.xFontSize + i * yAxisStep - yShift);
    if (yFontMaxWidth < yText.width) {
      yFontMaxWidth = yText.width;
    }
    this.addChild(yText);
  }
  // 绘制Y轴坐标线
  for (let i = 0; i < this.yAxisGraduations; i++) {
    const line = new Line(this.canvas, {
      lineWidth: 0.5,
      lineDash: [5, 2],
      color: '#999999',
      position: new Point(this.position.x + yFontMaxWidth, this.position.y + this.xFontSize + i * yAxisStep),
      to: new Point(this.position.x + this.width, this.position.y + this.xFontSize + i * yAxisStep),
    });
    this.addChild(line);
  }
  // 根据Y轴坐标宽度计算可绘制柱形区域的宽度
  const entityWidth = this.width - yFontMaxWidth;
  // 计算X轴单位宽度
  const xStep = entityWidth / this.data.length;
  // 绘制柱体
  for (let i = 0; i < this.data.length; i++) {
    // 计算组内柱体的宽度, 左右边距0.1 * xStep
    const xStep1 = xStep * 0.8 / this.data[i].data.length;
    // 遍历组内数据,绘制长方形柱体
    for (let j = 0; j < this.data[i].data.length; j++) {
      // 计算柱体的高度
      const height = (this.data[i].data[j].value - 0) / yStep;
      console.log('yFontMaxWidth', yFontMaxWidth, this.position.x + yFontMaxWidth + (i + 0.1) * xStep + j * xStep1);
      // 绘制长方形
      const rect = new Rectangle(this.canvas, {
        width: xStep1,
        height,
        type: Rectangle.TYPE.FILL,
        color: this.data[i].data[j].color,
        position: new Point(
          this.position.x + yFontMaxWidth + (i + 0.1) * xStep + j * xStep1 + xStep1 / 2,
          this.position.y + this.xFontSize + height / 2
        ),
      });
      this.addChild(rect);
    }
    // 绘制X轴坐标
    let xText = new Text(this.canvas, {
      font: this.fontFamily,
      size: this.fontSize,
      color: this.fontColor,
      text: this.data[i].label,
    });
    xText.setPosition(
      this.position.x + yFontMaxWidth + (i + 0.5) * xStep - xText.width / 2,
          this.position.y
    );
    this.addChild(xText);
  }
当所有数据同时存在正值与负值的情况,我们柱状图的坐标0轴位于图层的中央。我们计算柱形的高度,柱图的位置起始计算位置为height/2,当数值小于0时,我们需要下移一个柱图的高度,绘制算法如下:
- 计算数据绝对值的最大值,并根据最大Y坐标值计算单位数值占用的高度yStep;
- 计算每组数据柱图占用的宽度xStep;
- 遍历数据,根据公式(value - 0) / yStep 计算柱图的高度;
- 根据宽高绘制柱图矩形,当数值小于0时,我们将矩形的位置下移矩形高度。 实现代码如下:
// 计算绘图区域的高度
      const entityHeight = this.height - this.xFontSize;
      const yAbsMax = Math.abs(max) > Math.abs(min) ? Math.abs(max) : Math.abs(min);
      // 根据最大Y坐标值计算单位数值占用的高度
      const yStep = yAbsMax / 0.9 / entityHeight;
      const yAxisCount = Math.ceil((this.yAxisGraduations + 1) / 2);
      // y轴高度步进
      const yAxisStep = entityHeight / yAxisCount / 2;
      let yFontMaxWidth = 0;
      for (let i = 1; i < yAxisCount; i++) {
        const value = (i * yAxisStep * yStep).toFixed(this.enob);
        // 正方向坐标值
        const yText = new Text(this.canvas, {
          text: value,
          font: this.fontFamily,
          size: this.yFontSize,
          color: this.fontColor,
        });
        // Y轴坐标值偏移
        const yShift = i === yAxisCount - 1 ? yText.height : yText.height / 2;
        yText.setPosition(
          this.position.x,
          this.position.y + entityHeight / 2 + this.xFontSize + i * yAxisStep - yShift
        );
        if (yFontMaxWidth < yText.width) {
          yFontMaxWidth = yText.width;
        }
        // 负方向坐标值
        const yText2 = new Text(this.canvas, {
          text: `-${value}`,
          font: this.fontFamily,
          size: this.yFontSize,
          color: this.fontColor
        });
        yText2.setPosition(
          this.position.x,
          this.position.y + entityHeight / 2 + this.xFontSize - i * yAxisStep - yShift
        );
        if (yFontMaxWidth < yText2.width) {
          yFontMaxWidth = yText2.width;
        }
        this.addChild(yText, yText2);
      }
      // 绘制Y轴坐标线
      for (let i = 1; i < yAxisCount; i++) {
        // 正方向
        const line = new Line(this.canvas, {
          lineWidth: 0.5,
          lineDash: [5, 2],
          color: '#999999',
          position: new Point(
            this.position.x + yFontMaxWidth,
            this.position.y + this.xFontSize + i * yAxisStep + entityHeight / 2
          ),
          to: new Point(
            this.position.x + this.width,
            this.position.y + this.xFontSize + i * yAxisStep + entityHeight / 2
          ),
        });
        // 负方向
        const line2 = new Line(this.canvas, {
          lineWidth: 0.5,
          lineDash: [5, 2],
          color: '#999999',
          position: new Point(
            this.position.x + yFontMaxWidth,
            this.position.y + this.xFontSize - i * yAxisStep + entityHeight / 2
          ),
          to: new Point(
            this.position.x + this.width,
            this.position.y + this.xFontSize - i * yAxisStep + entityHeight / 2
          ),
        });
        this.addChild(line, line2);
      }
      // 绘制0轴与0线
      let zeroText = new Text(this.canvas, {
        text: '0',
        font: this.fontFamily,
        size: this.yFontSize,
        color: this.fontColor
      });
      zeroText.setPosition(this.position.x, this.position.y + this.xFontSize + entityHeight / 2 - zeroText.height / 2);
      let zeroLine = new Line(this.canvas, {
        lineWidth: 0.5,
        lineDash: [5, 2],
        color: '#999999',
        position: new Point(
          this.position.x + yFontMaxWidth,
          this.position.y + this.xFontSize + entityHeight / 2
        ),
        to: new Point(
          this.position.x + this.width,
          this.position.y + this.xFontSize + entityHeight / 2
        ),
      });
      this.addChild(zeroText, zeroLine);
      // 根据Y轴坐标宽度计算可绘制柱形区域的宽度
      const entityWidth = this.width - yFontMaxWidth;
      // 计算X轴单位宽度
      const xStep = entityWidth / this.data.length;
      // 绘制柱体
      for (let i = 0; i < this.data.length; i++) {
        // 计算组内柱体的宽度, 左右边距0.1 * xStep
        const xStep1 = xStep * 0.8 / this.data[i].data.length;
        // 遍历组内数据,绘制长方形柱体
        for (let j = 0; j < this.data[i].data.length; j++) {
          // 计算柱体的高度
          const height = (Math.abs(this.data[i].data[j].value) - 0) / yStep;
          // 绘制长方形
          const rect = new Rectangle(this.canvas, {
            width: xStep1,
            height,
            type: Rectangle.TYPE.FILL,
            color: this.data[i].data[j].color,
            position: new Point(
              this.position.x + yFontMaxWidth + (i + 0.1) * xStep + j * xStep1 + xStep1 / 2,
              this.position.y + entityHeight / 2 + height / 2 + this.xFontSize - (this.data[i].data[j].value > 0 ? 0 : height)
            ),
          });
          console.log(rect);
          this.addChild(rect);
        }
        // 绘制X轴坐标
        let xText = new Text(this.canvas, {
          font: this.fontFamily,
          size: this.fontSize,
          color: this.fontColor,
          text: this.data[i].label,
        });
        xText.setPosition(
          this.position.x + yFontMaxWidth + (i + 0.5) * xStep - xText.width / 2,
          this.position.y
        );
        this.addChild(xText);
      }
    }
React 封装
React封装需要DOM的挂载完成,所以我们在生命周期componentDidMount函数中构建我们的图层。
export default class extends React.Component {
  constructor(props) {
    super(props);
    this.ref = React.createRef();
  }

  componentDidMount () {
    const { style = {}, data =  [] } = this.props;
    this.canvas = new Canvas({
      ele: this.ref.current,
      canAction: false,
    });
    this.histogram = new Histogram(this.canvas, style, data);
    this.canvas.addChild(this.histogram);
    this.histogram.make();
    this.canvas.paint();
  }

  render() {
    const { className = '' } = this.props;
    return (
      <div className={className} ref={this.ref} />
    )
  }
}
