

【实现自己的可视化引擎01】认识Canvas
【实现自己的可视化框架引擎02】抽象图像元素
【实现自己的可视化引擎03】构建基础图元库
【实现自己的可视化引擎04】图像元素动画
【实现自己的可视化引擎05】交互与事件
【实现自己的可视化引擎06】折线图
【实现自己的可视化引擎07】柱状图
【实现自己的可视化引擎08】条形图
【实现自己的可视化引擎09】饼图
【实现自己的可视化引擎10】散点图
【实现自己的可视化引擎11】雷达图
【实现自己的可视化引擎12】K线图
【实现自己的可视化引擎13】仪表盘
【实现自己的可视化引擎14】地图
【实现自己的可视化引擎15】关系图
前言
仪表盘(Gauge)是一种拟物化的图表,刻度表示度量,指针表示维度,指针角度表示数值。仪表盘图表就像汽车的速度表一样,有一个圆形的表盘及相应的刻度,有一个指针指向当前数值。
本章节我们提供两种类型仪表盘的实现思路
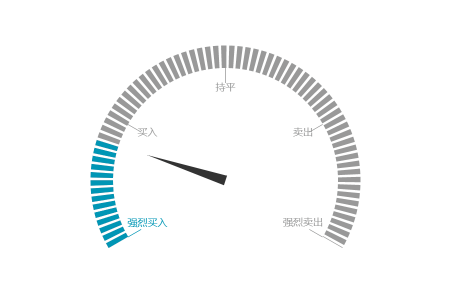
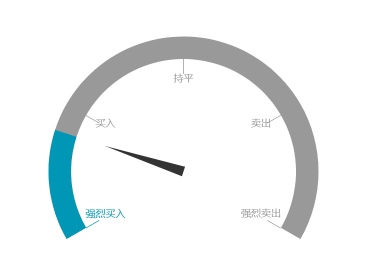
虚线形 type=DashBoard.TYPE.STROKE
render() {
return (
<DashBoard
value={0.2} // 刻度偏转角度,取值范围0-1
className="chart"
style={{
pointColor: '#333333', // 指针颜色
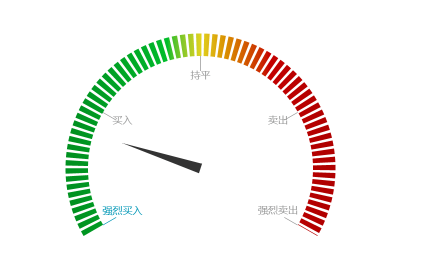
// linearGradient: [
// [0, '#058F05'],
// [0.3, '#15AF05'],
// [0.5, '#DCD313'],
// [0.8, '#AE1315'],
// [1, '#9E0305']
// ], // 渐变
type: DashBoard.TYPE.FILL,
graduation: ['强烈买入','买入', '持平', '卖出', '强烈卖出'], //刻度字符串
color:'#999999'
}}
/>
)
}
仪表盘图层
有效果图可以看出,仪表盘图层可以有几个简单的基本图层圆环(圆弧)Ring、三角形指针(多边形Polygon)、刻度(线Line与文字Text)组合而成。
确定了基本图形之后,我们可以设置基本图形的属性以便组合而成我们需要的图像。
仪表圆环我们确定角度为150°~390°,而指针偏移的角度依据外边闯入的属性值value计算等腰三角形的旋转角度rotation=-120° + value * 240°。
仪表图层源代码如下:
make() {
    this.childs.splice(0, this.childs.length);
    // 计算仪表盘圆环最大可用半径
    const raduis = this.height > this.width ? this.width / 2 : this.height / 2;
    // 仪表盘
    if (this.type === DashBoard.TYPE.FILL) {
      // 圆环
      let ring = new Ring(this.canvas, {
        linearGradient: this.linearGradient, // 渐变
        color: this.color,
        position: new Point(this.width / 2, raduis * 0.45), // 圆环中心
        longRadius: raduis * 0.9, // 圆环大半径
        shortRadius: raduis * 0.75, // 圆环小半径
        type: Ring.TYPE.FILL,
        startAngle: 150,
        endAngle: 390,
      });
      this.addChild(ring);
    } else {
      // 圆弧
      let ring = new Arc(this.canvas, {
        linearGradient: this.linearGradient,
        color: this.color,
        radius: raduis * 0.825,
        position: new Point(this.width / 2, raduis * 0.45),
        lineDash: [10, 5], // 设置为虚线
        lineWidth: raduis * 0.15, // 线框
        startAngle: 150,
        endAngle: 390,
      });
      this.addChild(ring);
    }

    // 三角形指针
    let angle = new Polygon(this.canvas, {
      type: Polygon.TYPE.FILL,
      position: new Point(this.width / 2, raduis * 0.45),
      color: this.pointColor,
    }, [
      new Point(this.width / 2 - 10, raduis * 0.45),
      new Point(this.width / 2 + 10, raduis * 0.45),
      new Point(this.width / 2, raduis)
    ]);
    // 值的偏移角度
    const valueAngle = -120 + this.value * 240;
    // 指针偏移
    angle.rotation = valueAngle;
    const angleStep = 240 / (this.graduation.length - 1);
    // 添加刻度线
    for (let i = 0;i < this.graduation.length; i++) {
      let color = this.color;
      // 刻度值偏移角度
      const angle = (210 - i * angleStep) / 180 * Math.PI;
      // 刻度值是否超过value,超过修改刻度线颜色为选中颜色
      if ((1 - this.value) * 240 - 30 < (210 - i * angleStep) ) {
        color = this.selectColor;
      }
      // 刻度线
      let line = new Line(this.canvas, {
        position: new Point(
          this.width / 2 + raduis * 0.65 * Math.cos(angle),
          raduis * 0.45 + raduis * 0.65 * Math.sin(angle)
        ),
        to: new Point(
          this.width / 2 + raduis * 0.75 * Math.cos(angle),
          raduis * 0.45 + raduis * 0.75 * Math.sin(angle)
        ),
        color,
        lineWidth: 1,
      });
      // 刻度值
      const text = new Text(this.canvas, {
        text: this.graduation[i],
        size: this.fontSize,
        color,
        textAlign: 'center',
        position: new Point(
          this.width / 2 + raduis * 0.6 * Math.cos(angle),
          raduis * 0.45 + raduis * 0.6 * Math.sin(angle)
        )
      });
      this.addChild(line, text);
    }
    this.addChild(angle);
    // 填充选中部分颜色
    if (this.linearGradient.length === 0) {
      if (this.type === DashBoard.TYPE.FILL) {
        let selectRing = new Ring(this.canvas, {
          color: this.selectColor,
          position: new Point(this.width / 2, raduis * 0.45),
          longRadius: raduis * 0.9,
          shortRadius: raduis * 0.75,
          type: Ring.TYPE.FILL,
          startAngle: 150,
          endAngle: 150 + this.value * 240,
        });
        this.addChild(selectRing);
      } else {
        let selectRing = new Arc(this.canvas, {
          color: this.selectColor,
          radius: raduis * 0.825,
          position: new Point(this.width / 2, raduis * 0.45),
          lineDash: [10, 5],
          lineWidth: raduis * 0.15,
          startAngle: 150,
          endAngle: 150 + this.value * 240,
        });
        this.addChild(selectRing);
      }
    }
  }
React 封装
React封装需要DOM的挂载完成,所以我们在生命周期componentDidMount函数中构建我们的图层。
componentDidMount () {
    const { style = {}, value =  0 } = this.props;
    this.canvas = new Canvas({
      ele: this.ref.current,
      canAction: false,
    });
    this.dash = new DashBoard(this.canvas, style, value);
    this.canvas.addChild(this.dash);
    this.dash.make();
    this.canvas.paint();
}
