

前言
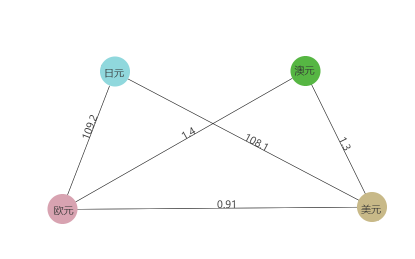
关系图又叫结构拓扑图,由各个网络节点相互连接形成的网络图谱。其效果图如下:
{
  roles: {
    USD: { label: '美元', color: '#C8B988' },
    EUR: { label: '欧元', color: '#D8A3B1'},
    JPY: { label: '日元', color: '#90D8DD' },
    AUD: { label: '澳元', color: '#56B643' },
  },
  relation: [
    ['USD', 'EUR', 0.91],
    ['USD', 'JPY', 108.1],
    ['USD', 'AUD', 1.3],
    ['EUR', 'JPY', 109.2],
    ['EUR', 'AUD', 1.4],
  ]
}
数据由两部分组成,roles定义各个节点的描述,relation为各个节点间的关联关系值。
拓扑图层
从效果图上可以看出,拓扑图层由Text、Circle、Line这些组件依据数据关系组合而成。当我们新建拓扑图层时或设置图层数据时,我们的节点描述就已经确定,即效果图上的Circle已经确定,所以我们可以事先将角色图元保存下来,代码如下:
/**
   * 设置data的时候重置角色单位
   * @param data
   */
  set data(data) {
    this.clearEventListener();
    this.roles = data.roles;
    this.relation = data.relation;
    this.roleUnits = {};
    // 构建各个角色
    for(let key in this.roles) {
      const role = this.roles[key];
      const randX = Math.random() * this.width;
      const randY = Math.random() * this.height;
      const txt = new Text(this.canvas, {
        text: role.label,
        color: this.color,
        font: this.fontFamily,
        size: this.fontSize,
      });
      txt.position = new Point(randX - txt.width / 2, randY - txt.height / 2);
      let circle = new Circle(this.canvas, {
        radius: Math.max(txt.width, txt.height) / 2 + 10,
        color: role.color || '#999999',
        position: new Point(randX, randY),
        type: Circle.TYPE.FILL,
      });

      // 构建角色图层,便于管理
      const layer = new Layer(this.canvas, { position: new Point(randX, randY) });
      layer.addEventListener(Event.EVENT_DRAG, (e) => {
        // 重新计算节点位置
        e.node.position = new Point(e.node.position.x + e.distanceX, e.node.position.y + e.distanceY);
        for (let i = 0; i < e.node.childs.length; i++) {
          if (e.node.childs[i] instanceof Text) {
            e.node.childs[i].position = new Point(
              e.node.position.x + e.distanceX - e.node.childs[i].width / 2,
              e.node.position.y + e.distanceY - e.node.childs[i].height / 2
            );
          } else {
            e.node.childs[i].position = e.node.position;
          }

        }
        // 重新绘制画布
        if (e.node.canvas) {
          this.make();
          e.node.canvas.paint();
        }
      });
      layer.addChild(circle, txt);
      this.roleUnits[key] = layer;
    }
}
上面的代码,我们各节点图层添加了拖动动画监听,当我们拖动节点时,以便整个图表的重新绘制。 有了关系节点,我们便可以遍历关系数组relation,绘制两个节点之间的连线,由于两个节点为圆心,所以我们需要计算连线在两个圆之上的坐标。代码如下:
make() {
    this.childs.splice(0, this.childs.length);
    if (this.relation.length < 0) {
      return;
    }
    // 遍历关系数组,连接各个角色
    for (let i = 0; i < this.relation.length; i++) {
      const relation = this.relation[i];
      const role1 = this.roleUnits[relation[0]];
      const role2 = this.roleUnits[relation[1]];
      // 计算两个角色坐标的斜率
      const slope = (role1.position.y - role2.position.y) / (role1.position.x - role2.position.x);
      // 计算与水平线的夹角
      const angle = Math.atan(slope);
      // 计算角色1连线的节点1
      const point1 = new Point(
        role1.position.x + role1.childs[0].radius * Math.cos(angle),
        role1.position.y + role1.childs[0].radius * Math.sin(angle)
      );
      // 计算角色2连线的节点2
      const point2 = new Point(
        role2.position.x - role2.childs[0].radius * Math.cos(angle),
        role2.position.y - role2.childs[0].radius * Math.sin(angle)
      );
      // 绘制连接线段
      const line = new Line(this.canvas, {
        position: point1,
        to: point2,
        lineWidth: this.lineWidth || 2,
        color: this.color
      });
      // 关联数值
      const txt = new Text(this.canvas, {
        font: this.fontFamily,
        size: this.fontSize,
        color: this.fontColor,
        text: relation[2],
        position: new Point((role1.position.x + role2.position.x) / 2, (role1.position.y + role2.position.y) / 2),
      });
      // 旋转角度,使其与直线平行
      txt.rotation = -angle / Math.PI * 180;
      this.addChild(line, txt);
    }
    // 将角色加入图层
    for (let key in this.roleUnits) {
      this.addChild(this.roleUnits[key]);
    }
  }
React 封装
React封装需要DOM的挂载完成,所以我们在生命周期componentDidMount函数中构建我们的图层。
 componentDidMount () {
    const { style = {}, data } = this.props;
    this.canvas = new Canvas({
      ele: this.ref.current,
      canAction: false,
    });
    this.relationLayer = new RelationLayer(this.canvas, style, data);
    this.canvas.addChild(this.relationLayer);
    this.relationLayer.make();
    this.canvas.paint();
  }
组件使用案例
render() {
    return (
      <Relation
        className="chart"
        data={{
          roles: {
            USD: { label: '美元', color: '#C8B988' },
            EUR: { label: '欧元', color: '#D8A3B1'},
            JPY: { label: '日元', color: '#90D8DD' },
            AUD: { label: '澳元', color: '#56B643' },
          },
          relation: [
            ['USD', 'EUR', 0.91],
            ['USD', 'JPY', 108.1],
            ['USD', 'AUD', 1.3],
            ['EUR', 'JPY', 109.2],
            ['EUR', 'AUD', 1.4],
          ]
        }}
        style={{
          color: '#333333',
          fontColor: '#333333',
          lineWidth: 1,
        }}
      />)
  }
目录
【实现自己的可视化引擎01】认识Canvas
【实现自己的可视化框架引擎02】抽象图像元素
【实现自己的可视化引擎03】构建基础图元库
【实现自己的可视化引擎04】图像元素动画
【实现自己的可视化引擎05】交互与事件
【实现自己的可视化引擎06】折线图
【实现自己的可视化引擎07】柱状图
【实现自己的可视化引擎08】条形图
【实现自己的可视化引擎09】饼图
【实现自己的可视化引擎10】散点图
【实现自己的可视化引擎11】雷达图
【实现自己的可视化引擎12】K线图
【实现自己的可视化引擎13】仪表盘
【实现自己的可视化引擎14】地图
【实现自己的可视化引擎15】关系图
