

前言
烛形图主要用于金融领域里展示股票,期货等交易数据,按照时间维度分为日 K 线、周 K 线、月 K 线。展示的数据需要满足 K 线构成的四要素:即开盘价、收盘价、最高价、最低价。
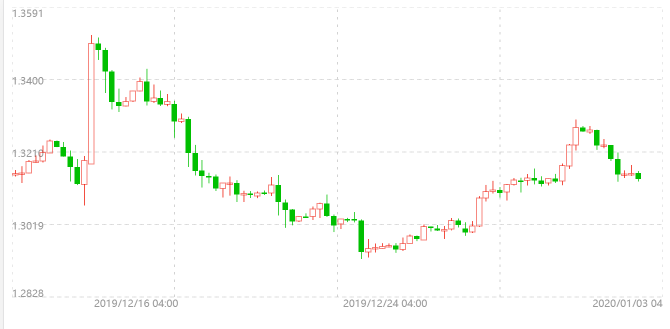
我们首先看一下我们要实现的K线图的效果,如下图所示:
render() {
    return (
      <Candlestick
        className="chart"
        data={data}
        style={{
          color: '#C3C3C3', // 坐标字体颜色
          axisColor: '#999999', // 坐标网格颜色
          xFontSize: 20,    // 坐标X轴字体大小
          yFontSize: 20,    // 坐标Y轴字体大小
          enob: 4,          // Y轴有效位数
          positiveType: Candlestick.BAR_TYPE.STROKE,    // 阳线空心
        }}
      />)
}
从效果图上,我们可以把该组件拆分成坐标图层与K线图层。而K线图层又是由多根烛型图元依次摆列而成,所以在绘制K线层前,我们先来构建我们的烛型图元。
烛型图元
在效果图上,我们可以看出烛型图元有两种:线型空心(阳柱)与填充型(阴柱)。线型空心柱又可分为两条垂直直线加线框矩形,填充型柱可分为一条垂直线加填充矩形。因此,我们可以给出两种烛型的绘制流程如下:
- 线型空心流程
- 绘制从最高价到较大值(收盘价或开盘价两者中的较大值)的直线;
- 依据收盘价与开盘价绘制矩形线框
- 绘制从最低价到较小值的直线(收盘价或开盘价两者中的较小值); 代码如下:
// 当前类型为线框
      // 绘制上部分线条开始
      painter.beginPath();
      // 移到最高点
      painter.moveTo(this.position.x + this.width / 2, this.position.y - (this.high - this.baseLine) * this.delta);
      // 移动到矩形上边界
      painter.lineTo(this.position.x + this.width / 2, this.position.y - (top - this.baseLine) * this.delta);
      painter.closePath();
      painter.stroke();
      // 上部分线条绘制结束
      // 绘制下部分线条开始
      painter.beginPath();
      // 移动到最低价位置
      painter.moveTo(this.position.x + this.width / 2, this.position.y - (this.low - this.baseLine) * this.delta);
      // 移动到矩形下边界
      painter.lineTo(this.position.x + this.width / 2, this.position.y - (bottom - this.baseLine) * this.delta);
      painter.closePath();
      painter.stroke();
      // 下部分线条结束
      // 绘制矩形部分
      painter.strokeRect(
        this.position.x + Math.round(0.1 * this.width),
        this.position.y - Math.round((top - this.baseLine) * this.delta),
        Math.round(this.width * 0.8),
        barHeight
      );
      // 绘制矩形结束
- 填充型流程
- 绘制从最高价到最低价的直线
- 依据收盘价与开盘价绘制填充线框覆盖流程1中的直线 代码如下:
// 绘制最高最低价线型
  painter.beginPath();
  // 最高价
  painter.moveTo(this.position.x + this.width / 2, this.position.y - (this.high - this.baseLine) * this.delta);
  // 最低价
  painter.lineTo(this.position.x + this.width / 2, this.position.y - (this.low - this.baseLine) * this.delta);
  painter.closePath();
  painter.stroke();
  // 线型绘制结束
  // 绘制矩形部分
  painter.fillRect(
    this.position.x + Math.round(0.1 * this.width),
    this.position.y - Math.round((top - this.baseLine) * this.delta),
    Math.round(this.width * 0.8),
    barHeight
  );
完整代码如下:
export default class Bar extends Node {
  static BAR_TYPE = {
    FILL: 1,
    STROKE: 2,
  }

  constructor(canvas, style, data) {
    super(canvas, style);
    this.open = data.open; // 开盘价
    this.high = data.high; // 最高价
    this.low = data.low;   // 最低价
    this.close = data.close; // 收盘价
    this.datetime = data.datetime; // 时间线
    this.width = style.width || 20; // 烛型宽度
    this.delta = style.delta || 10; // 烛型单位数值所占用的像素
    this.baseLine = style.baseLine || 0; // 数值基线
    this.type = style.type || Bar.BAR_TYPE.FILL; // 柱形是否空心
  }

  set data(data) {
    this.open = data.open; // 开盘价
    this.high = data.high; // 最高价
    this.low = data.low;   // 最低价
    this.close = data.close; // 收盘价
    this.datetime = data.datetime; // 时间线
  }

  draw(painter) {
    // 计算矩形部分的高 |开盘-收盘| * 单位数值所占用的像素
    let barHeight = Math.round(Math.abs(this.close - this.open) * this.delta);
    // 防止开盘价与收盘价相等,高度为0,如十字线,默认最小2像素
    barHeight = barHeight > 2 ? barHeight : 3;
    painter.strokeStyle = this.color;
    painter.strokeWidth = '3px';
    painter.fillStyle = this.color;
    let top = Math.max(this.open, this.close);  // 矩形上边界值
    let bottom = Math.min(this.open, this.close);  // 矩形下边界值
    if (this.type === Bar.BAR_TYPE.STROKE) {
      // 当前类型为线框, 绘制线型空心,代码参考上述
      // ...
    } else {
      // 当前类型为填充,绘制填充型,代码参考上述
      // ...
  }
}
K线图层
K线的样式比较简单,只有阳线阴线的类型与颜色以及缩放所需的单屏数量。K线图层的构造方法如下:
constructor(canvas, style, data = []) {
    super(canvas, style);
    this.data = data; // K线数据
    this.width = style.width || this.canvas.width;  // K线图层宽度
    this.height = style.height || this.canvas.height; // K线图层高度
    this.positiveColor = style.positiveColor || '#EE1100';  // 阳线颜色
    this.negativeColor = style.negativeColor || '#00C000';  // 阴线颜色
    this.positiveType = style.positiveType || Bar.BAR_TYPE.FILL; // 阳线类型
    this.negativeType = style.negativeType || Bar.BAR_TYPE.FILL; // 阴线类型
    this.showNum = style.showNum || 30; // 单屏展示数量
    this.locked = false; // 事件处理时,是否锁定标识
}
接下来我们分析一下构建K线的流程,
- 根据图层位置计算数据索引的偏移量kLeft;
- 根据偏移量kLeft计算需要绘制的数据(barStart, barEnd);
- 计算绘制数据的最大值与最小值,从而计算单位数值的单位高度yDelta;
- 遍历所需的绘制的数据,构建Bar图元并加入图层 依据流程编写代码:
make() {
    if (this.data.length === 0) {
      return;
    }
    // 移除所有子元素
    this.childs.splice(0, this.childs.length);
    // K线宽度
    const barWidth = this.width / this.showNum;
    this.barWidth = barWidth;
    // 数据偏移量
    let kLeft = Math.floor(this.position.x / barWidth);
    // 数据的结束索引
    let barEnd = this.data.length;
    let barStart = this.data.length - this.showNum;
    if (kLeft > 0 && this.data.length > kLeft + this.showNum) {
      // 向右移动数量与显示数量小于数据量, 结束索引等于数据量-偏移量
      barEnd = this.data.length - kLeft;
      barStart = barEnd - this.showNum;
    } else if (kLeft > 0) {
      // 向右移动数量超过数据量, 结束索引等于显示数量
      barEnd = this.showNum;
      barStart = 0;
    } else {
      // 向左移动
      barEnd = this.data.length - 1;
      barStart = barEnd - this.showNum - kLeft;
    }
    this.barStart = barStart;
    this.barEnd = barEnd;
    // 计算当前屏数据的最大值最小值
    let max = this.data[barStart].high;
    let min = this.data[barEnd].low;
    for (let i = barStart; i < barEnd; i++) {
      if (this.data[i].high > max) {
        max = this.data[i].high;
      }
      if (this.data[i].low < min) {
        min = this.data[i].low;
      }
    }
    this.max = max;
    this.min = min;
    // 根据最大值最小值计算单位数值的单位高度
    let yDelta = this.height / (max - min);
    /**柱图绘制开始**/
    for (let i = barStart; i < barEnd; i++) {
      // 阴线或阳线
      const isPositive = Number(this.data[i].close) > Number(this.data[i].open);
      // K线颜色
      const color = isPositive ? this.positiveColor : this.negativeColor;
      // 线图或填充图
      const type = isPositive ? this.positiveType : this.negativeType;
      const bar = new Bar(this.canvas, {
        width: barWidth,
        delta: yDelta,
        baseLine: min,
        color,
        type,
        // 柱状图位置
        position: new Point((i - barStart) * barWidth, this.position.y)
      }, this.data[i]);
      this.addChild(bar);
    }
    /**柱图绘制结束*/
    /**
     * 构建结束回调
     * **/
    this.onMaked && this.onMaked(this, {
      max,
      min,
      barWidth,
      yDelta,
      start: barStart,
      end: barEnd
    });
 }
React 封装
React封装需要DOM的挂载完成,所以我们在生命周期componentDidMount函数中构建我们的图层。K线组件我们分为坐标层与K线图层,K线图层构建完成后我们通知坐标层更新坐标。
坐标层配置代码如下:
// 坐标系基础配置
this.axisLayer = new AxisLayer(this.canvas, {
  yAxisType: AxisLayer.AxisType.NUMBER, // y轴为数值型
  xAxisType: AxisLayer.AxisType.LABEL,  // x轴时间为字符型
  xAxisGraduations: style.xAxis || 5,   // 网格5列
  yAxisGraduations: style.yAxis || 5,   // 网格5行
  xAxisPosition: AxisLayer.AxisPosition.BLOCK,  // X轴坐标不计算
  yAxisPosition: AxisLayer.AxisPosition.INNER,  // Y轴坐标计算
  yAxisRender: (value) => {
    const enob = style.enob || 2;
    return {
      text: Number(value).toFixed(enob),
      size: Number(style.yFontSize || 20),
      color: style.axisColor || '#999999',
      font: style.fontFamily || 'PingFang SC',
    };
  },
  xAxisRender: (label) => {
    const { value } = label;
    return {
      text: value,
      size: Number(style.xFontSize || 20),
      color: style.axisColor || '#999999',
      font: style.fontFamily || 'PingFang SC',
    };
  },
  color: style.color,
});
K线图层配置如下:
// K线坐标
this.barLayer = new KBarLayer(this.canvas, {
  height: (this.canvas.height - style.xFontSize * this.canvas.ratio) * 0.8, // 预留20%的空白空间
  positiveColor: style.positiveColor,
  negativeColor: style.negativeColor,
  positiveType: style.positiveType,
  negativeType: style.negativeType,
  position: new Point(0, style.xFontSize * this.canvas.ratio * 0.9 + 0.1 * this.canvas.height), // 预留的10% + 坐标的高度
}, data);
在K线构建完成的回调中,我们通知坐标层更新坐标数值,代码如下:
this.barLayer.onMaked = (layer, option) => {
  const { max, min, barWidth, yDelta, start, end } = option;
  // 计算坐标的最大值与最小值,加减预留部分的数值
  let yAxisMax = max + (this.canvas.height - style.xFontSize * this.canvas.ratio) * 0.1 / yDelta;
  let yAxisMin = min - (this.canvas.height - style.xFontSize * this.canvas.ratio) * 0.1 / yDelta;
  this.axisLayer.yAxisMin = yAxisMin;
  this.axisLayer.yAxisMax = yAxisMax;
  // 设置X轴时间的坐标
  let dataWidth = (end - start) * barWidth;
  // 假设间距为100个画布像素
  let dataNum = Math.round(dataWidth / 500);
  // 计算100画布像素索引距离
  let indexStep = Math.round(500 / barWidth);
  // x轴坐标数组
  let xAxisData = [];
  for (let i = 0; i < dataNum; i++) {
    const date = data[end - 1 - i * indexStep].time;
    xAxisData.unshift({
      value: date,
      position: new Point((end - 1 - i * indexStep - start) * barWidth, 0),
    });
  }
  this.axisLayer.xAxisLabels = xAxisData;
  this.axisLayer.make();
}
为K线拖动与缩放交互功能添加事件,代码如下:
// 监听拖动事件
this.barLayer.addEventListener(Event.EVENT_DRAG, (e) => {
  this.onChartDrag(e);
});
this.barLayer.addEventListener(Event.EVENT_DRAG_END, (e) => {
  this.onChartDragEnd(e);
});
// 监听滚轮K线缩放
this.barLayer.addEventListener(Event.EVENT_WHEEL, (e) => {
  this.onChartScale(e);
});
至此K线图的流程已经结束了,在此基础上,我们可以通过叠加不同的图层丰富我们K线的功能。 目录
【实现自己的可视化引擎01】认识Canvas
【实现自己的可视化框架引擎02】抽象图像元素
【实现自己的可视化引擎03】构建基础图元库
【实现自己的可视化引擎04】图像元素动画
【实现自己的可视化引擎05】交互与事件
【实现自己的可视化引擎06】折线图
【实现自己的可视化引擎07】柱状图
【实现自己的可视化引擎08】条形图
【实现自己的可视化引擎09】饼图
【实现自己的可视化引擎10】散点图
【实现自己的可视化引擎11】雷达图
【实现自己的可视化引擎12】K线图
【实现自己的可视化引擎13】仪表盘
【实现自己的可视化引擎14】地图
【实现自己的可视化引擎15】关系图
