

前言
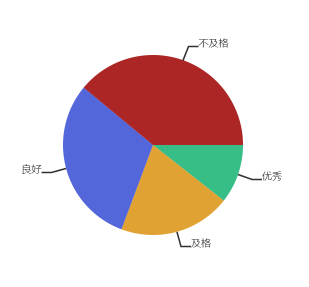
饼图主要用于展现不同类别数值相对于总数的占比情况。图中每个分块(扇区)的弧长表示该类别的占比大小,所有分块数据总和为100%。效果图如下
[{
      key: 'a',
      value: 10.6,
      label: '优秀'
    }, {
      key: 'c',
      value: 20.1,
      label: '及格'
    }, {
      key: 'b',
      value: 30.3,
      label: '良好'
    }, {
      key: 'd',
      value: 39,
      label: '不及格'
}]
React组件使用代码:
render() {
return (
<Pie
className="chart"
style={{
color: '#333333',
lineWidth: 1,
fontColor: '#666666',
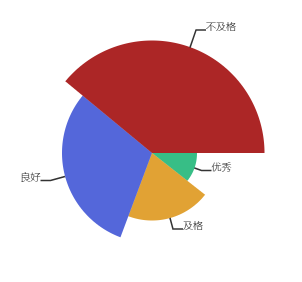
//type: Pie.TYPE.ROSE
}}
data={[{
key: 'a',
value: 10.6,
label: '优秀'
}, {
key: 'c',
value: 20.1,
label: '及格'
}, {
key: 'b',
value: 30.3,
label: '良好'
}, {
key: 'd',
value: 39,
label: '不及格'
}]}
colors={{
a: '#37BE86',
b: '#5467DA',
c: '#E1A234',
d: '#AC2626'
}}
/>
)
}
饼图层
饼图每个分块(扇区)的弧长表示该类别的占比大小,所以我们需要计算单位数值所占用的弧度。所以饼图绘制的流程如下:
- 统计数据总和,计算单位数值所占用的弧度360/sum;
- 遍历数据计算各个数据所占用的弧度,并绘制相应的扇形Sector;
- 计算标签位置,设置标签 代码如下:
make() {
    this.childs.splice(0, this.childs.length);
    this.clearEventListener();
    if (this.data.length <= 0) {
      return;
    }
    let sum = 0; // 数据累和
    for (let i = 0; i < this.data.length; i++) {
      sum += this.data[i].value;
    }
    // 计算单位数值所占用的角度
    let angleStep = 360 / sum;
    // 记录偏移角度
    let sumAngle = 0;
    // 扇形的半径
    const radius = this.width > this.height ? this.height / 2 : this.width / 2;
    const radiusStep = 1 / this.data.length;
    // 遍历数据绘制相应的扇形
    for (let i = 0; i < this.data.length; i++) {
      // 计算扇形的夹角
      let angle = this.data[i].value * angleStep;
      let isRose = this.type === PieLayer.TYPE.ROSE ? (0.5 + radiusStep * i) : 1;
      // 扇形
      let sector = new Sector(this.canvas, {
        start: sumAngle / 180 * Math.PI,
        stop: (angle + sumAngle) / 180 * Math.PI,
        radius: radius * 0.6 * isRose, // 预留40%用于其他类型数据展示
        type: Sector.TYPE.FILL,
        color: this.colors[this.data[i].key],
        position: new Point(this.position.x + this.width / 2, this.position.y + this.height / 2),
      });
      // 标签字符
      let lineAngle = 360 - (sumAngle + angle / 2);
      const point1 = new Point(
        this.position.x + this.width / 2 + Math.cos(lineAngle / 180 * Math.PI) * radius * 0.6 * isRose,
        this.position.y + this.height/ 2 + Math.sin(lineAngle / 180 * Math.PI) * radius * 0.6 * isRose
      );
      const point2 = new Point(
        this.position.x + this.width / 2 + Math.cos(lineAngle / 180 * Math.PI) * radius * 0.7 * isRose,
        this.position.y + this.height / 2 + Math.sin(lineAngle / 180 * Math.PI) * radius * 0.7 * isRose
      );
      const point3 = new Point(
        this.position.x + this.width / 2 + Math.cos(lineAngle / 180 * Math.PI) * radius * 0.7 * isRose + (lineAngle < 90 || lineAngle > 270 ? 20 : -20),
        this.position.y + this.height / 2 + Math.sin(lineAngle / 180 * Math.PI) * radius * 0.7 * isRose
      );
      const text = new Text(this.canvas, {
        text: this.data[i].label,
        size: this.fontSize,
        font: this.fontFamily,
        color: this.color
      });
      text.setPosition(
        this.position.x + this.width / 2 + Math.cos(lineAngle / 180 * Math.PI) * radius * 0.7 * isRose + (lineAngle < 90 || lineAngle > 270 ? 20 : -(20 + text.width)),
        this.position.y + this.height / 2 + Math.sin(lineAngle / 180 * Math.PI) * radius * 0.7 * isRose
      );
      let line = new MultiLine(this.canvas, {
        position: point1,
        color: this.color,
      }, [point2, point3]);
      this.addChild(sector, line, text);
      sumAngle += angle;
    }
  }
React封装
React封装需要DOM的挂载完成,所以我们在生命周期componentDidMount函数中构建我们的图层。代码如下:
componentDidMount () {
    const { style = {}, colors = {}, data = [] } = this.props;
    this.canvas = new Canvas({
      ele: this.ref.current,
      canAction: false
    });
    this.pie = new PieLayer(this.canvas, {
      ...style,
      colors,
    }, data);
    this.canvas.addChild(this.pie);
    this.pie.make();
    this.canvas.paint();
 }
目录
【实现自己的可视化引擎01】认识Canvas
【实现自己的可视化框架引擎02】抽象图像元素
【实现自己的可视化引擎03】构建基础图元库
【实现自己的可视化引擎04】图像元素动画
【实现自己的可视化引擎05】交互与事件
【实现自己的可视化引擎06】折线图
【实现自己的可视化引擎07】柱状图
【实现自己的可视化引擎08】条形图
【实现自己的可视化引擎09】饼图
【实现自己的可视化引擎10】散点图
【实现自己的可视化引擎11】雷达图
【实现自己的可视化引擎12】K线图
【实现自己的可视化引擎13】仪表盘
【实现自己的可视化引擎14】地图
【实现自己的可视化引擎15】关系图
