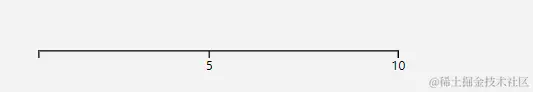
示例一
<script lang="ts" setup>
import { onMounted, ref } from 'vue'
import { BaseType, select, selectAll, Selection } from 'd3-selection'
import { min, max } from 'd3-array'
import { scaleLinear, scaleOrdinal, scalePow, scaleTime } from 'd3-scale'
import { axisBottom, AxisDomain, axisTop } from 'd3-axis'
const myContainerRef = ref<HTMLDivElement>()
onMounted(() => {
const height = 500,
width = 500,
margin = 25,
offset = 50
const dataArr = [1, 4, 3, 0.5, 10]
const minVal = min(dataArr) as number
const maxVal = max(dataArr) as number
const scale = scaleLinear().domain([minVal, maxVal]).range([0, 300])
const axis = axisBottom().scale(scale).ticks(3)
const myContainerDom = myContainerRef.value as HTMLDivElement
select(myContainerDom)
.append('svg')
.classed('axis', true)
.attr('width', width)
.attr('height', height)
.append('g')
.attr('transform', function () {
return `translate(${margin},${offset * 2})`
})
.call(axis)
})
</script>
<template>
<div class="myDiv">
<h3>表格</h3>
<button @click="doSort('compareByExpense')">compareByExpense</button>
<button @click="doSort('compareByCategory')">compareByCategory</button>
<button @click="doSort()">Reset</button>
<div ref="myContainerRef"></div>
</div>
</template>
<style lang="scss" scoped>
.myDiv {
margin-left: 30px;
::v-deep(.h-bar) {
background-color: #42b8dd;
margin-bottom: 10px;
}
::v-deep(.selected) {
background-color: pink;
}
}
</style>
参考文章
D3.js 几种常用的坐标轴
d3.js 入门学习记录(五) 开始绘制坐标轴
D3js基础课10:坐标轴
绘制坐标轴与网格线
【d3js(四)】刻度尺、format、坐标轴


