

坐标轴基础
api文档链接:github.com/d3/d3-axis/…
先上代码:
<!doctype html>
<html lang="en">
<head>
<meta charset="UTF-8">
<meta name="viewport"
content="width=device-width, user-scalable=no, initial-scale=1.0, maximum-scale=1.0, minimum-scale=1.0">
<meta http-equiv="X-UA-Compatible" content="ie=edge">
<title>Document</title>
</head>
<body>
<div class="control-group">
<button onclick="renderAll(d3.axisBottom)">horizontal bottom</button>
<button onclick="renderAll(d3.axisTop)">horizontal top</button>
<button onclick="renderAll(d3.axisLeft)">vertical left</button>
<button onclick="renderAll(d3.axisRight)">vertical right</button>
</div>
<script src="../d3.js"></script>
<script>
const height = 500,
width = 500,
margin = 25,
offset = 50,
axisWidth = width - 2 * margin
let svg
function createSvg() {
svg = d3.select('body').append('svg')
.classed('axis', true)
.attr('width', width)
.attr('height', height)
}
function renderAxis(fn, scale, i) {
const axis = fn()
.scale(scale)
.ticks(5)
svg.append('g')
.attr('transform', function () {
if ([d3.axisTop, d3.axisBottom].includes(fn)) {
return `translate(${margin},${offset * i})`
} else {
return `translate(${offset * i},${margin})`
}
})
.call(axis)
}
function renderAll(fn) {
if (svg) {
svg.remove()
}
createSvg()
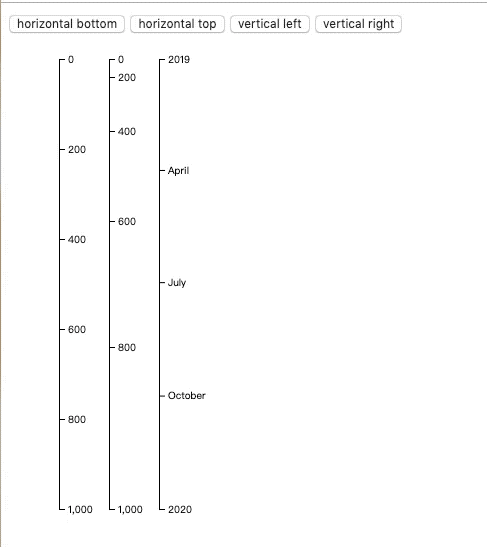
renderAxis(fn, d3.scaleLinear().domain([0, 1000]).range([0, axisWidth]), 1)
renderAxis(fn, d3.scalePow().exponent(2).domain([0, 1000]).range([0, axisWidth]), 2)
renderAxis(fn, d3.scaleTime().domain([new Date(2019, 0, 1), new Date(2020, 0, 1)]).range([0, axisWidth]), 3)
}
效果如下:
接着我们来解释坐标轴的渲染:
-
坐标轴是借于svg来渲染的,所以我们首先在body下添加了个svg元素,然后我们就要在svg上开始绘制坐标轴。
-
我们通过offset来使坐标轴位置错开。
-
d3 提供了4个坐标轴生成函数,对应四个不同的朝向:
d3.axisTop(scale) 水平坐标轴,刻度位于坐标轴之上。
d3.axisBottom(scale) 水平坐标轴,刻度位于坐标轴之上。
d3.axisRight(scale) 垂直坐标轴,刻度位于坐标轴之右。
d3.axisLeft(scale) 垂直坐标轴,刻度位于坐标轴之左。
坐标轴的刻度是依赖于我们之前提到的尺度 scale 的。可以传参初始化,也可以使用
scale()设置尺度。 上面的四个函数可以帮我们生成形如fn(selection) {}的坐标轴生成函数。我们通过调用fn(selection)即可把坐标轴渲染在其中,但是习惯上我们更习惯采用selection.call(fn)的方式, 它的效果等效于将 selection 传入参数并调用函数。 -
tick()是用来设置刻度相关的,我们会在后面详细的解释。
自定义刻度
关于刻度的api如下:
axis.ticks([count[, fromat]])相当于
axis.tickArguments()的简化版, 如axis.ticks(20, 's')相当于axis.tickArguments([20, 's'])
axis.tickArguments([argument])参数数组内可以接收两个参数,第一个参数作为刻度的参考个数,第二个参数传递给
scale.tickFormat()
axis.tickValues([values])如果指定了 values 数组,则使用指定的数组作为刻度而不是自动计算刻度。如果 values 为 null 则清除之前设置的显示刻度参数,也就是如果之前设置过values 则可以使用 null 将其取消。如果没有指定 values 则返回当前的刻度值参数,默认为 null。例如使用指定的数组作为刻度:
const xAxis = d3.axisBottom(xScale)
    .tickValues([1, 2, 3, 5, 8, 13, 21]);
axis.tickFormat([format])如果指定了 format 则设置刻度文字标签格式化方法。如果没有指定 format 则返回当前的刻度文本格式化方法,默认为 null。在没有设置格式化方法的情况下,会使用默认的 scale.tickFormat 去生成刻度文本。 在这种情况下通过 axis.tickArguments 设置的格式化方法会直接被 scale.tickFormat 使用。
axis.tickFormat(d3.format(",.0f"));
axis.tickSize([size])
如果指定了 size 则同时设置 tickSizeInner 和 tickSizeOuter 刻度的大小,并返回坐标轴生成器。如果没有指定 size 则返回当前的刻度大小,默认为 6。
axis.tickSizeInner([size])如果指定了 size 则设置内侧刻度大小,如果没有指定 size 则返回当前的刻度大小,默认为 6。内侧刻度大小控制着刻度线的长度。
axis.tickSizeOuter([size])如果指定了 size 则设置外侧刻度大小,如果没有指定 size 则返回当前的刻度大小,默认为 6。外侧刻度大小控制着刻度线的长度。外侧刻度表示的是坐标轴最外侧两端的刻度线。内侧刻度和外侧刻度不同,内侧刻度是一个个单独的 line 元素,而外侧刻度则实际上是坐标轴线 path 的一部分。此外外侧刻度可能和第一个或最后一个内侧刻度重合。
axis.tickPadding([padding])如果设置了 padding 则设置刻度和刻度文本之间的间距,如果没有指定 padding 则返回当前的间距,默认为 3 像素。
<!doctype html>
<html lang="en">
<head>
<meta charset="UTF-8">
<meta name="viewport"
content="width=device-width, user-scalable=no, initial-scale=1.0, maximum-scale=1.0, minimum-scale=1.0">
<meta http-equiv="X-UA-Compatible" content="ie=edge">
<title>Document</title>
</head>
<body>
<script src="../d3.js"></script>
<script>
const width = 500,
height = 500,
margin = 25,
axisWidth = width - 2 * margin
const svg = d3.select('body').append('svg')
.classed('axis', true)
.attr('width', width)
.attr('height', height)
const scale = d3.scaleLinear()
.domain([0, 1])
.range([0, axisWidth])
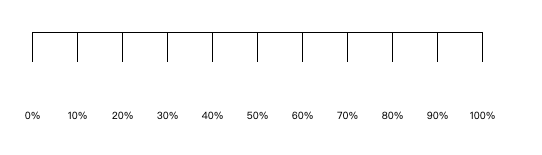
const axis = d3.axisBottom()
.scale(scale)
.ticks(10)
.tickSize(30)
.tickPadding(50)
.tickFormat(d3.format('.0%'))
svg.append('g')
.attr('transform', function () {
return `translate(${margin}, ${margin})`
})
.call(axis)
</script>
</body>
</html>
效果如下:
绘制完整坐标轴和网格线
代码如下:
<!doctype html>
<html lang="en">
<head>
    <meta charset="UTF-8">
    <meta name="viewport"
          content="width=device-width, user-scalable=no, initial-scale=1.0, maximum-scale=1.0, minimum-scale=1.0">
    <meta http-equiv="X-UA-Compatible" content="ie=edge">
    <title>Document</title>
    <style>
        .grid-line{
            stroke: black;
            shape-rendering: crispEdges;
            stroke-opacity: .2;
        }
    </style>
</head>
<body>
<script src="../d3.js"></script>
<script>
    const width = 800,
          height = 500,
          margin = 25

    const svg = d3.select('body')
        .append('svg')
            .classed('axis', true)
            .attr('width', width)
            .attr('height', height)

    function renderXAxis() {
        const axisLength = width - 2 * margin

        const scale = d3.scaleLinear()
            .domain([100, 0])
            .range([axisLength, 0])

        const xAxis = d3.axisBottom()
            .scale(scale)

        svg.append('g')
            .classed('x-axis', true)
            .attr('transform', function () {
                return `translate(${margin},${height - margin})`
            })
            .call(xAxis)

        d3.selectAll('g.x-axis g.tick')
            .append('line')
                .classed('grid-line', true)
                .attr('x1', 0)
                .attr('y1', 0)
                .attr('x2', 0)
                .attr('y2', -(height - 2 * margin))
    }

    function renderYAxis() {
        const axisLength = height - 2 * margin

        const scale = d3.scaleLinear()
            .domain([100, 0])
            .range([0, axisLength])

        const yAxis = d3.axisLeft()
            .scale(scale)

        svg.append('g')
            .classed('y-axis', true)
            .attr('transform', function () {
                return `translate(${margin},${margin})`
            })
            .call(yAxis)

        d3.selectAll('g.y-axis g.tick')
            .append('line')
                .classed('grid-line', true)
                .attr('x1', 0)
                .attr('y1', 0)
                .attr('x2', width - 2 * margin)
                .attr('y2', 0)
    }

    renderXAxis()
    renderYAxis()
</script>
</body>
</html>
效果如下:

- svg 的坐标起点位于左上角,往下 y 为正,往右 x 为正。
- 我们在创建 x 轴和 y轴时分别对他们设置transform 使他们移动到对应的位置。
- 因为 y 轴的零点位于最下面,所以传递给 yAxis的尺度的值域是颠倒的。
- 绘制网格线时,我们找到每个刻度的 g.tick 元素,像其中添加 line 元素并设置起点终点,以坐标刻度为原点,下右为正, 所以 x 轴的网格线的终点 y2 为 -(height - 2 * margin), y 轴的网格线的终点 x2 为 width - 2 * margin。
