

引力和相互作用力
先上代码:
<!doctype html>
<html lang="en">
<head>
    <meta charset="UTF-8">
    <meta name="viewport"
          content="width=device-width, user-scalable=no, initial-scale=1.0, maximum-scale=1.0, minimum-scale=1.0">
    <meta http-equiv="X-UA-Compatible" content="ie=edge">
    <title>Document</title>
</head>
<body>
<div class="control-group">
    <button onclick="noForce()">no force</button>
    <button onclick="repulsion()">repulsion</button>
    <button onclick="gravity()">gravity</button>
    <button onclick="positioningWithGravity()">positioning with gravity</button>
    <button onclick="positioningWithRepulsion()">positioning with repulsion</button>
</div>
<script src="../d3.js"></script>
<script>
    const width = 1280,
          height = 800,
          r = 4.5,
          nodes = [],
          colors = d3.scaleOrdinal(d3.schemeCategory10),
          force = d3.forceSimulation()
            .velocityDecay(0.8)
            .alphaDecay(0)
            .force('collision', d3.forceCollide(r + 0.5).strength(1))

    const svg = d3.select('body')
        .append('svg')
            .attr('width', width)
            .attr('height', height)

    force.on('tick', function () {
        svg.selectAll('circle')
          .attr('cx', d => d.x)
          .attr('cy', d => d.y)
    })

    svg.on('mousemove', function () {
        const point = d3.mouse(this),
              node = {x: point[0], y: point[1]}

        svg.append('circle')
          .data([node])
          .attr('class', 'node')
          .attr('cx', d => d.x)
          .attr('cy', d => d.y)
          .attr('r', 1e-6)
          .style('fill', d => colors(Math.round(Math.random() * 10)))
          .transition()
          .attr('r', r)
          .transition().delay(10000)
          .attr('r', 1e-6)
          .on('end', function () {
                nodes.shift()
                force.nodes(nodes)
          })
          .remove()

        nodes.push(node)
        force.nodes(nodes)
    })

    function noForce() {
        force.force('charge', null)
        force.force('x', null)
        force.force('y', null)
        force.restart()
    }

    function repulsion() {
        force.force('charge', d3.forceManyBody().strength(-10))
        force.force('x', null)
        force.force('y', null)
        force.restart()
    }

    function gravity() {
      force.force('charge', d3.forceManyBody().strength(1))
      force.force('x', null)
      force.force('y', null)
      force.restart()
    }

    function positioningWithGravity() {
        force.force('charge', d3.forceManyBody().strength(1))
        force.force('x', d3.forceX().x(width / 2))
        force.force('y', d3.forceY().y(height / 2))
        force.restart()
    }

    function positioningWithRepulsion() {
      force.force('charge', d3.forceManyBody().strength(-10))
      force.force('x', d3.forceX().x(width / 2))
      force.force('y', d3.forceY().y(height / 2))
      force.restart()
    }
</script>
</body>
</html>
效果如下:
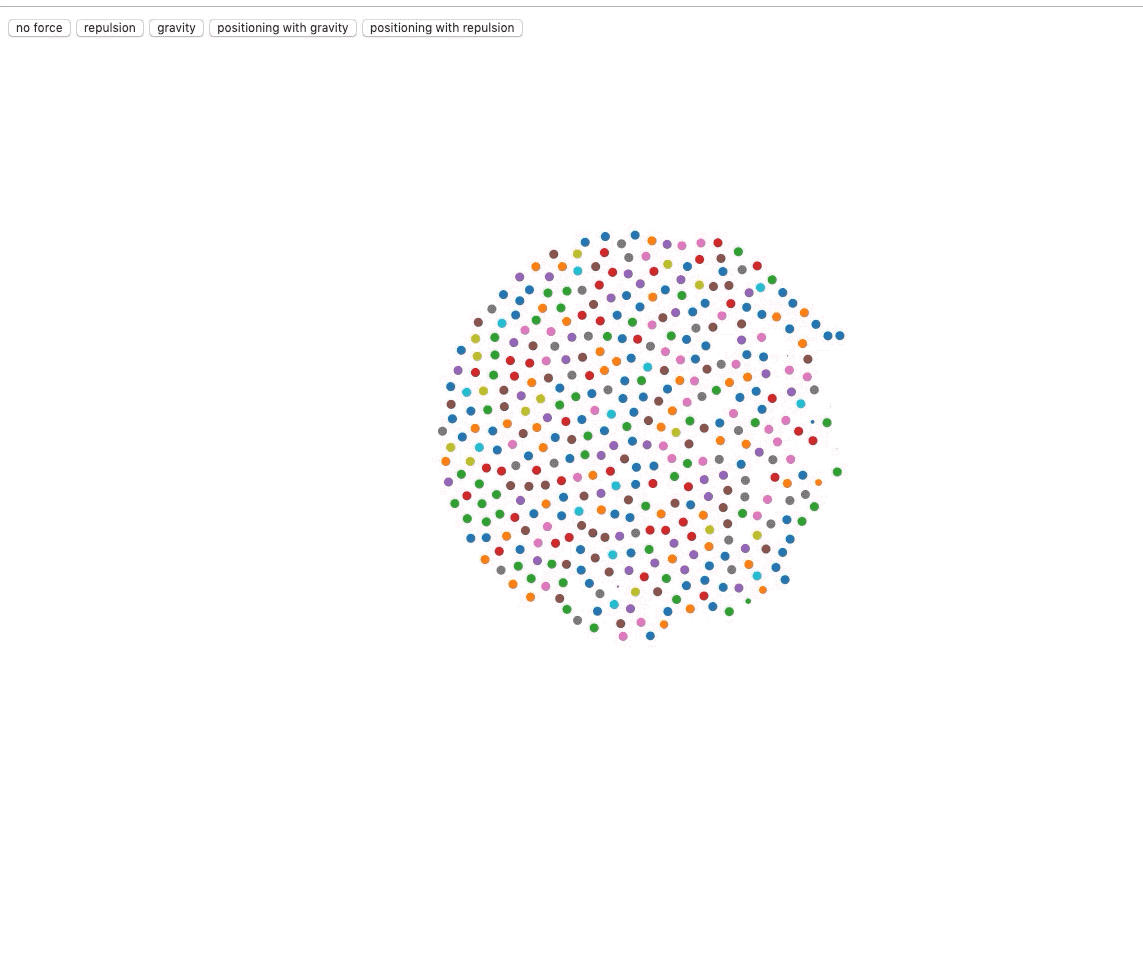
可以看见我们生成的小圆点互相之间有了引力和斥力,d3 内置的 force 模块帮助我们在 web 页面中通过算法模拟实现了物理的力学效果。
d3 提供了许多单力给我们使用,但是在实际使用中,我们通常是使用多种效果复合的仿真力的(就像实例中的粒子有碰撞,有引力,还有向中心力),我们就要借助于 forceSimulation 来帮助我们实现仿真力,其api如下:
- d3.forceSimulation - 创建一个新的力学仿真.
- simulation.restart - 重新启动仿真的定时器.
- simulation.stop - 停止仿真的定时器.
- simulation.tick - 进行一步仿真模拟.
- simulation.nodes - 设置仿真的节点.
- simulation.alpha - 设置当前的 alpha 值.
- simulation.alphaMin - 设置最小 alpha 阈值.
- simulation.alphaDecay - 设置 alpha 衰减率.
- simulation.alphaTarget - 设置目标 alpha 值.
- simulation.velocityDecay - 设置速度衰减率. 1 对应于无摩擦环境, 0 对应冻结所有粒子.
- simulation.force - 添加或移除一个力模型.
- simulation.find - 根据指定的位置找出最近的节点.
- simulation.on - 添加或移除事件监听器.
在示例中,我们就创建了一个仿真力:
force = d3.forceSimulation()
    .velocityDecay(0.8)
    .alphaDecay(0)
    .force('collision', d3.forceCollide(r + 0.5).strength(1))
我们将速度衰减定为 0.8,alpha 衰减定为 0 (力一直持续下去,便于 demo 观察),然后我们使用 force 方法给仿真力集合添加各种力,这里初始化时添加了一个碰撞力,让粒子具有实际的体积。
随后我们要指定力的每一个 tick 中对粒子的处理:
force.on('tick', function () {
    svg.selectAll('circle')
      .attr('cx', d => d.x)
      .attr('cy', d => d.y)
})
然后通过 force.nodes(nodes) 给所有的节点数据应用力。
在变换力的函数中,我们也是通过 force 方法添加原力,然后再 restart,forceManyBody返回一个作用力,strength 的正负值决定了是引力还是斥力。
简单的力如下:
d3.forceCollide - 创建一个圆形区域的碰撞检测力模型.
collide.radius - 设置碰撞半径.
collide.strength - 设置碰撞检测力模型的强度. [0, 1], 默认 0.7
collide.iterations - 设置迭代次数, 数值越大,效果越优,但是会加大消耗, 默认为 1
d3.forceX - 创建一个 x -方向的一维作用力.
x.strength - 设置力强度. [0, 1], 默认 0.1
x.x - 设置目标 x -坐标.
d3.forceY - 创建一个 y -方向的一维作用力.
y.strength - 设置力强度. [0, 1], 默认 0.1
y.y - 设置目标 y -坐标.
d3.forceCenter - 创建一个中心作用力.
center.x - 设置中心作用力的 x -坐标.
center.y - 设置中心作用力的 y -坐标.
d3.forceManyBody - 创建一个电荷作用力模型.
manyBody.strength - 设置电荷力模型的强度,正值则表示节点之间相互吸引,负值表示节点之间相互排斥,默认-30
manyBody.theta - 设置 Barnes–Hut 算法的精度.
manyBody.distanceMin - 限制节点之间的最小距离.
manyBody.distanceMax - 限制节点之间的最大距离.
d3.forceRadial - 创建一个环形布局的作用力.
radial.strength - 设置力强度. [0, 1] 默认 0.1
radial.radius - 设置目标半径.
radial.x - 设置环形作用力的目标中心 x -坐标.
radial.y - 设置环形作用力的目标中心 y -坐标.
d3.forceLink - 创建一个 link 作用力.
link.links - 设置弹簧作用力的边.
link.id - 设置边元素中节点的查找方式是索引还是 id 字符串.
link.distance - 设置 link 的距离.
link.strength - 设置 link 的强度.
link.iterations - 设置迭代次数.
另外,力布局节点对象的属性如下:
index:节点数组中的索引值
x:当前节点位置的 x 坐标
y:当前节点位置的 y 坐标
vx:节点当前在 x 轴上的速度
vy:节点当前在 y 轴上的速度
fx:节点固定的 x 位置
fy:节点固定的 y 位置
使用连接约束
<!doctype html>
<html lang="en">
<head>
    <meta charset="UTF-8">
    <meta name="viewport"
          content="width=device-width, user-scalable=no, initial-scale=1.0, maximum-scale=1.0, minimum-scale=1.0">
    <meta http-equiv="X-UA-Compatible" content="ie=edge">
    <title>Document</title>
    <style>
        .line {
            fill: none;
            stroke: steelblue;
            stroke-width: 2;
        }

    </style>
</head>
<body>
<script src="../d3.js"></script>
<script>
    const width = 1280,
          height = 800,
          r = 4.5,
          nodes = [],
          links = [],
          force = d3.forceSimulation()
            .velocityDecay(0.5)
            .alphaDecay(0)
            .force('collision', d3.forceCollide(r + 0.5).strength(1))
            .force('charge', d3.forceManyBody().strength(-50).distanceMax(height / 10))

    const svg = d3.select('body').append('svg')
      .attr('width', width)
      .attr('height', height)

    force.on('tick', function () {
        svg.selectAll('circle')
          .attr('cx', d => boundX(d.x))
          .attr('cy', d => boundY(d.y))

        svg.selectAll('line')
          .attr('x1', d => boundX(d.source.x))
          .attr('y1', d => boundY(d.source.y))
          .attr('x2', d => boundX(d.target.x))
          .attr('y2', d => boundY(d.target.y))
    })

    function boundX(x) {
        return x > r ? (x < width - r ? x : width - r) : r
    }

    function boundY(y) {
        return y > r ? (y < height - r ? y : height - r) : r
    }

    function offset() {
        return Math.random() * 10
    }

    function createNodes(point) {
        const numberOfNodes = Math.round(Math.random() * 10),
              newNodes = []

        for (let i  = 0; i < numberOfNodes; i++) {
            newNodes.push({
                x: point[0] + offset(),
                y: point[1] + offset()
            })
        }

        newNodes.forEach(p => nodes.push(p))

        return newNodes
    }

    function createLinks(nodes) {
        const newLinks = []

        for (let i = 0; i < nodes.length; i++) {
            if (i === nodes.length - 1) {
                newLinks.push({
                    source: nodes[i],
                    target: nodes[0]
                })
            } else {
                newLinks.push({
                    source: nodes[i],
                    target: nodes[i + 1]
                })
            }
        }

        newLinks.forEach(l => links.push(l))

        return newLinks
    }

    svg.on('click', function () {
        const point = d3.mouse(this),
              newNodes = createNodes(point),
              newLinks = createLinks(newNodes)

        newNodes.forEach(node => {
            svg.append('circle')
                .data([node])
                    .classed('node', true)
                    .attr('cx', d => d.x)
                    .attr('cy', d => d.y)
                    .attr('r', 1e-6)
                    .call(d3.drag()
                        .on('start', d => {
                            d.fx = d.x
                            d.fy = d.y
                        })
                        .on('drag', d => {
                            d.fx = d3.event.x
                            d.fy = d3.event.y
                        })
                        .on('end', d => {
                            d.fx = null
                            d.fy = null
                        }))
                .transition()
                    .attr('r', 7)
                .transition()
                    .delay(10000)
                    .attr('r', 1e-6)
                    .on('end', d => nodes.shift())
                    .remove()
        })

        newLinks.forEach(link => {
            svg.append('line')
                .data([link])
                    .classed('line', true)
                    .attr('x1', d => d.source.x)
                    .attr('y1', d => d.source.y)
                    .attr('x2', d => d.target.x)
                    .attr('y2', d => d.target.y)
                .transition().delay(10000)
                    .style('stroke-opacity', 1e-6)
                    .on('end', d => links.shift())
                    .remove()
        })

        force.nodes(nodes)
        force.force('link', d3.forceLink(links).strength(1).distance(20))

        force.restart()
    })

</script>
</body>
</html>
效果如下:
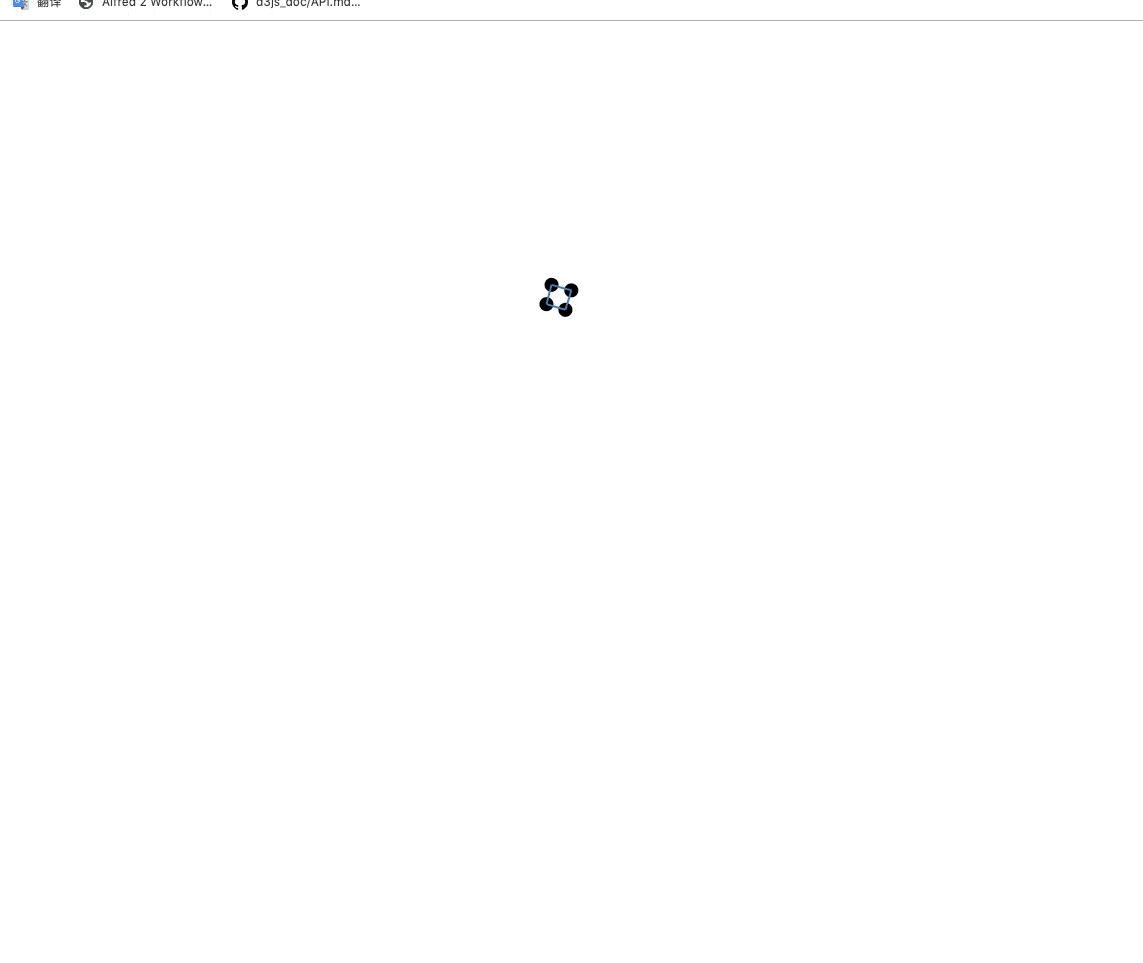
我们在每次点击时都根据点击的位置生成个数随机的圆点和线条,根据圆点数据生成的线条数据是首尾相连的(线条数据中的数据和节点数据是相同引用地址的), 随后我们给仿真力添加 link 力,然后应用到节点上。在 tick 中我们需要添加额外的对线条的渲染处理(限制了不超出svg区域):
svg.selectAll('line')
  .attr('x1', d => boundX(d.source.x))
  .attr('y1', d => boundY(d.source.y))
  .attr('x2', d => boundX(d.target.x))
  .attr('y2', d => boundY(d.target.y))
并且我们还给圆点添加了拖拽:
.call(d3.drag()
    .on('start', d => {
        d.fx = d.x
        d.fy = d.y
    })
    .on('drag', d => {
        d.fx = d3.event.x
        d.fy = d3.event.y
    })
    .on('end', d => {
        d.fx = null
        d.fy = null
    }))
在效果中可以看见,当我们拖动圆点时, 与之相连的圆点也会随着一起被拖动,这就是 link 力在作用。
力气泡图
在上面的例子中,我们只需要把渲染dom的部分变为根据节点渲染封闭的 path 曲线,其实就是力气泡图了。
<!doctype html>
<html lang="en">
<head>
    <meta charset="UTF-8">
    <meta name="viewport"
          content="width=device-width, user-scalable=no, initial-scale=1.0, maximum-scale=1.0, minimum-scale=1.0">
    <meta http-equiv="X-UA-Compatible" content="ie=edge">
    <title>Document</title>
    <style type="text/css">
        html, body {
            height: 100%;
        }
        body {
            margin: 0;
        }
        svg {
            width: 100%;
            height: 100%;
        }
        .bubble {
            stroke: grey;
            stroke-width: 1;
        }
    </style>
</head>
<body>
<svg>
    <defs>
        <radialGradient id="gradient" cx="50%" cy="50%" r="100%" fx="50%" fy="50%">
            <stop offset="0%" style="stop-color:blue;stop-opacity:0"/>
            <stop offset="100%" style="stop-color:rgb(255,255,255);stop-opacity:1"/>
        </radialGradient>
    </defs>
</svg>
<script src="../d3.js"></script>
<script>
  const width = 1280,
    height = 800,
    r = 4.5,
    nodes = [],
    links = [],
    force = d3.forceSimulation()
      .velocityDecay(0.5)
      .alphaDecay(0)
      .force('collision', d3.forceCollide(r + 0.5).strength(1))
      .force('charge', d3.forceManyBody().strength(-50).distanceMax(height / 10))

  const svg = d3.select('svg')
    .attr('width', width)
    .attr('height', height)

  const line = d3.line()
    .x(d => d.x)
    .y(d => d.y)
    .curve(d3.curveBasisClosed)

  force.on('tick', function () {
    svg.selectAll('path.bubble')
      .attr('d', d => line(d))
  })

  function boundX(x) {
    return x > r ? (x < width - r ? x : width - r) : r
  }

  function boundY(y) {
    return y > r ? (y < height - r ? y : height - r) : r
  }

  function offset() {
    return Math.random() * 10
  }

  function createNodes(point) {
    const numberOfNodes = Math.round(Math.random() * 10),
      newNodes = []

    for (let i  = 0; i < numberOfNodes; i++) {
      newNodes.push({
        x: point[0] + offset(),
        y: point[1] + offset()
      })
    }

    newNodes.forEach(p => nodes.push(p))

    return newNodes
  }

  function createLinks(nodes) {
    const newLinks = []

    for (let i = 0; i < nodes.length; i++) {
      if (i === nodes.length - 1) {
        newLinks.push({
          source: nodes[i],
          target: nodes[0]
        })
      } else {
        newLinks.push({
          source: nodes[i],
          target: nodes[i + 1]
        })
      }
    }

    newLinks.forEach(l => links.push(l))

    return newLinks
  }

  svg.on('click', function () {
    const point = d3.mouse(this),
      newNodes = createNodes(point),
      newLinks = createLinks(newNodes)

      svg.append('path')
        .data([newNodes])
        .classed('bubble', true)
        .attr('fill', 'url(#gradient)')
        .attr('d', d => {
          console.log(d)
          return line(d)
        })
        .transition().delay(10000)
        .attr('fill-opacity', 0)
        .attr('stroke-opacity', 0)
        .on('end', function () {
          d3.select(this).remove()
        })


    force.nodes(nodes)
    force.force('link', d3.forceLink(links).strength(1).distance(20))

    force.restart()
  })
</script>
</body>
</html>
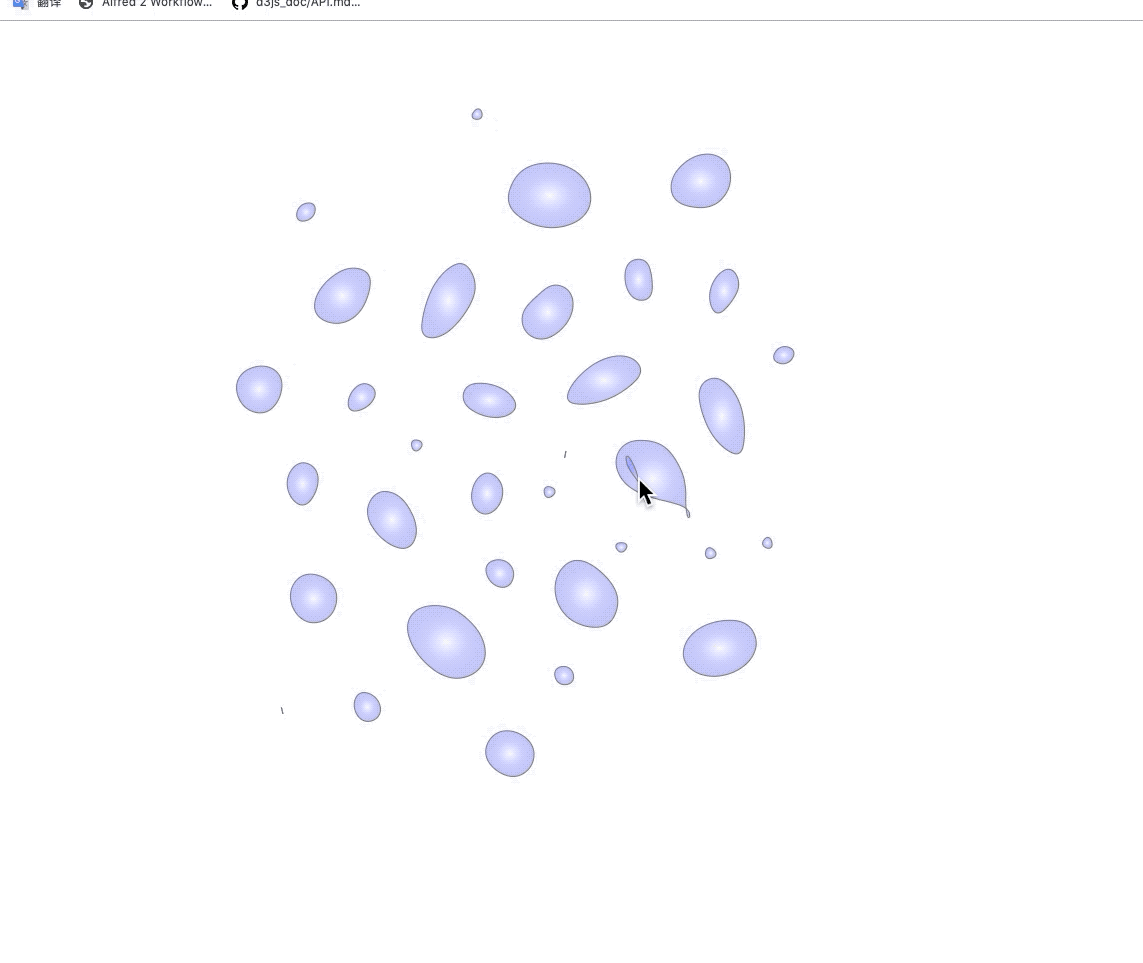
效果如下:
改变的代码如下:
const line = d3.line()
    .x(d => d.x)
    .y(d => d.y)
    .curve(d3.curveBasisClosed)

force.on('tick', function () {
svg.selectAll('path.bubble')
  .attr('d', d => line(d))
})

svg.append('path')
    .data([newNodes])
    .classed('bubble', true)
    .attr('fill', 'url(#gradient)')
    .attr('d', d => {
      console.log(d)
      return line(d)
    })
    .transition().delay(10000)
    .attr('fill-opacity', 0)
    .attr('stroke-opacity', 0)
    .on('end', function () {
      d3.select(this).remove()
    })
力导向图
数据使用之前的treeData,见 juejin.cn/post/684490…
<!doctype html>
<html lang="en">
<head>
    <meta charset="UTF-8">
    <meta name="viewport"
          content="width=device-width, user-scalable=no, initial-scale=1.0, maximum-scale=1.0, minimum-scale=1.0">
    <meta http-equiv="X-UA-Compatible" content="ie=edge">
    <title>Document</title>
</head>
<body>
<script src="../d3.js"></script>
<script>
    function render(data) {
        const width = 1280,
              height = 800,
              r = 4.5,
              colors = d3.scaleOrdinal(d3.schemeCategory10),
              force = d3.forceSimulation()
                .velocityDecay(0.8)
                .alphaDecay(0)
                .force('charge', d3.forceManyBody().strength(-50))
                .force('x', d3.forceX())
                .force('y', d3.forceY()),
              svg = d3.select('body').append('svg')
                .attr('width', width)
                .attr('height', height)
                .attr("viewBox", [-width / 2, -height / 2, width, height]),
              root = d3.hierarchy(data),
              nodes = root.descendants(),
              links =  root.links()

        force.nodes(nodes)
        force.force('link', d3.forceLink(links).strength(1).distance(20))

        force.on('tick', function () {
            svg.selectAll('line')
                .attr('x1', d => d.source.x)
                .attr('y1', d => d.source.y)
                .attr('x2', d => d.target.x)
                .attr('y2', d => d.target.y)

            svg.selectAll('circle')
                .attr('cx', d => d.x)
                .attr('cy', d => d.y)
        })

        svg.selectAll('line')
            .data(links)
            .enter()
            .append('line')
            .style('stroke', '#999')
            .style('stroke-width', '1px')

        svg.selectAll('circle')
            .data(nodes)
            .enter()
            .append('circle')
                .attr('r', r)
            .attr('fill', d => colors(d.parent && d.parent.data.name))
                .call(d3.drag()
                    .on('start', d => {
                        d.fx = d.x
                        d.fy = d.y
                    })
                    .on('drag', d => {
                        d.fx = d3.event.x
                        d.fy = d3.event.y
                    })
                    .on('end', d => {
                        d.fx = null
                        d.fy = null
                    })
                )
    }

    d3.json('./treeData.json').then(data => {
        render(data)
    })
</script>
</body>
</html>
效果如下:
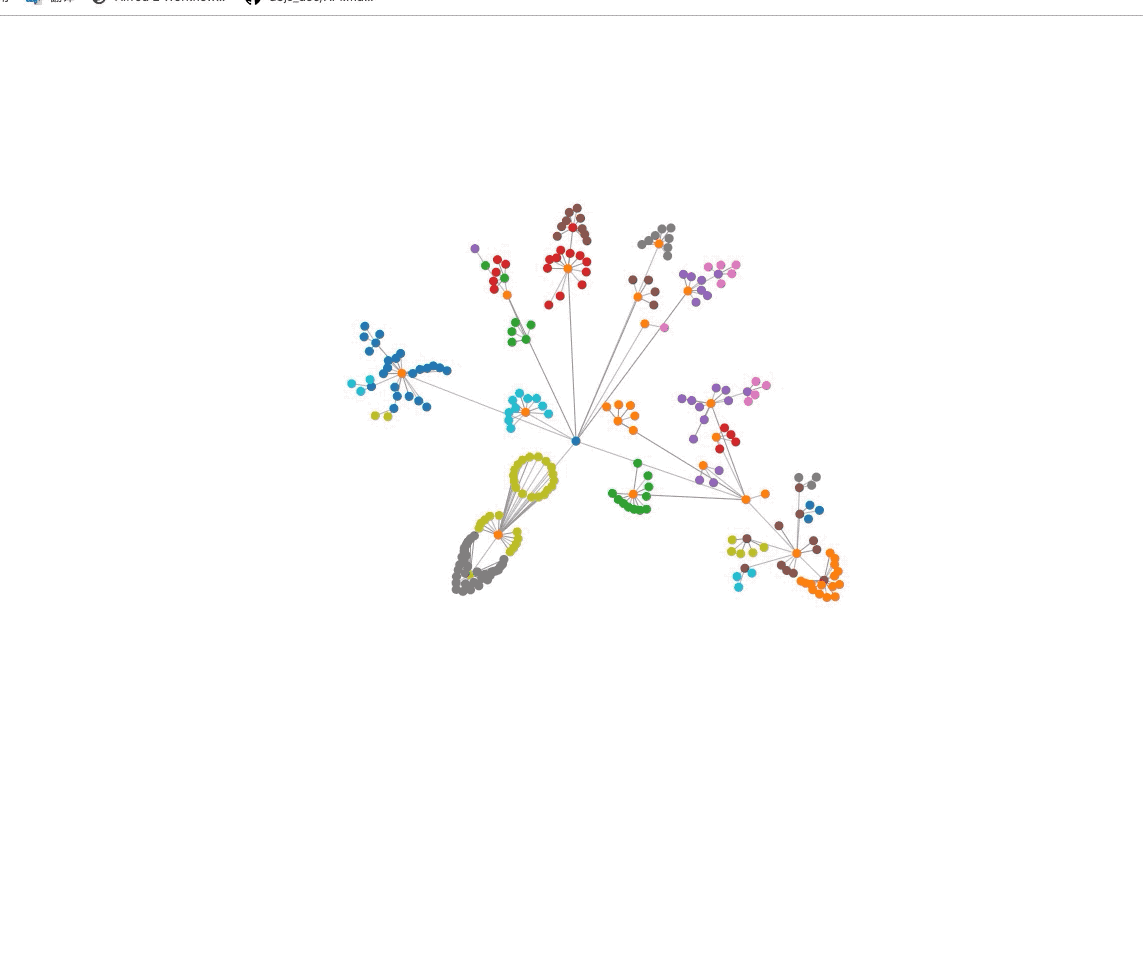
我们使用 hierarchy.descendants() hierarchy.links() 来获取我们要渲染的节点数据和链接数据,然后就是正常的按照数据进行渲染。对于节点,我们将同父节点下的节点设置为同颜色。
