饼图
在创建弧度区域时,我们调用 d3.arc() 常常需要数据项内有固定在 [0, 2 * Math.PI] 的值来指定弧度片段的起始角度,但是实际上我们的数据内只有数据数值,d3.pie() 就可以帮我们实现对数据的结构的转化。这种性质的方法被称为布局。
pie的相关配置方法如下
pie.value()- 设置值访问器,用来指定拿来计算角度的属性值。pie.sort()- 设置排序比较器,实现数据的排序。pie.sortValues() - 设置排序比较器,函数的参数 a,b 是通过值访问器取值后的。pie.startAngle()- 设置所有环形的起始角度。pie.endAngle()- 设置所有环形的终止角度。pie.padAngle()- 设置相邻两个环之间的间隙角度。
<!doctype html>
<html lang="en">
<head>
    <meta charset="UTF-8">
    <meta name="viewport"
          content="width=device-width, user-scalable=no, initial-scale=1.0, maximum-scale=1.0, minimum-scale=1.0">
    <meta http-equiv="X-UA-Compatible" content="ie=edge">
    <title>Document</title>
    <style>
        .pie text{
            fill: white;
            font-weight: bold;
        }
    </style>
</head>
<body>
<script src="../d3.js"></script>
<script>
    function pieChart() {
        const _chart = {}

        let _width = 500,
            _height = 500,
            _colors = d3.scaleOrdinal(d3.schemeCategory10),
            _data = [],
            _svg,
            _body,
            _pie,
            _radius = 200  ,
            _innerRadius = 100,
            _duration = 1000


        _chart.data = function (d) {
            if (!arguments.length) return _data;
            _data = d;
            return _chart;
        }

        _chart.render = function () {
            if (!_svg) {
                _svg = d3.select('body')
                  .append('svg')
                  .attr('width', _width)
                  .attr('height', _height)
            }

            renderBody()
        }

        function renderBody() {
            if (!_body) {
                _body = _svg.append('g')
                  .classed('body', true)
            }
            renderPie()
        }

        function renderPie() {
            const pie = d3.pie()
              .sort((a, b) => b.id - a.id)
              .value(d => d.value)

            const arc = d3.arc()
              .outerRadius(_radius)
              .innerRadius(_innerRadius)

            if (!_pie) {
                _pie = _body.append('g')
                  .classed('pie', true)
                  .attr('transform', `translate(${_radius}, ${_radius})`)
            }

            renderSlices(pie, arc)
            renderLabels(pie, arc)
        }

        function renderSlices(pie, arc) {
            const slices = _pie.selectAll('path.arc')
                .data(pie(_data))

            slices.enter()
                .append('path')
                .merge(slices)
                    .classed('arc', true)
                    .attr('fill', (d, i) => _colors(i))
                    .transition().duration(_duration)
                        .attrTween('d', function (d) {
                            const currentArc = this.__current__ || {startAngle: 0, endAngle: 0}
                            const interpolate = d3.interpolate(currentArc, d)
                            this.__current__ = d
                            return t => arc(interpolate(t))
                        })

        }

        function renderLabels(pie, arc) {
            const labels = _pie.selectAll('text.label').data(pie(_data))

            labels.enter()
                .append('text')
                .merge(labels)
                    .attr('class', 'label')
                    .transition().duration(_duration)
                        .attr('transform', d => `translate(${arc.centroid(d)})`)
                        .attr('dy', '.35rem')
                        .attr('text-anchor', 'middle')
                        .text(d => d.data.id)
        }

        return _chart
    }

    function randomData() {
         return Math.random() * 9 + 1;
    }

    function update() {
        for (let j = 0; j < data.length; ++j) {
            data[j].value = randomData();
        }
        chart.render();
    }

    const numberOfDataPoint = 6

    const data = d3.range(numberOfDataPoint).map(function (i) {
        return {id: i, value: randomData()};
    });

    const chart = pieChart()
        .data(data);

    chart.render();
</script>
<div class="control-group">
    <button onclick="update()">Update</button>
</div>
</body>
</html>
效果如下:
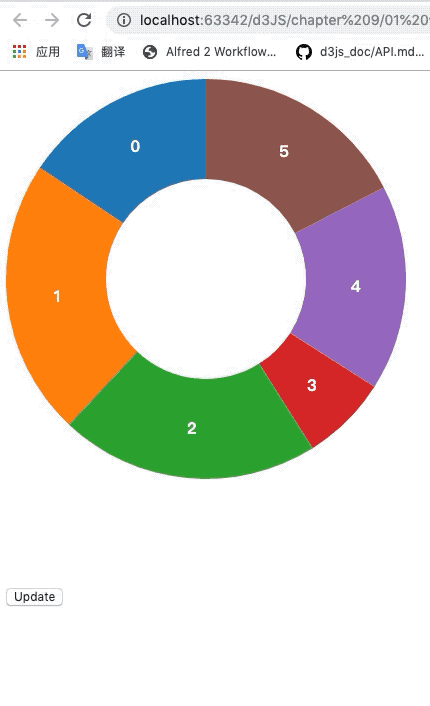
我们定义了一个 pie 布局器,指定 id 值大的排在前,数据中的 value 属性值作为计算弧角度的值。
 const pie = d3.pie()
    .sort((a, b) => b.id - a.id)
    .value(d => d.value)
然后我们在绑定数据中绑定的都是 pie(_data) 处理后的数据,他会帮我们生成形如 [{startAngle: , endAngle: }, ...] 的数据便于给 arc 处理。
另外我们在设置扇形的过渡时,把当前的数据项存于 dom 上,然后每次更新都检查是否有之前的数据,如果有,就从之前的角度开始过渡变化,这让饼图的过渡效果更好。
.attrTween('d', function (d) {
    const currentArc = this.__current__ || {startAngle: 0, endAngle: 0}
    const interpolate = d3.interpolate(currentArc, d)
    this.__current__ = d
    return t => arc(interpolate(t))
})
堆叠面积图
[
  {month: new Date(2015, 0, 1), apples: 3840, bananas: 1920, cherries: 960, dates: 400},
  {month: new Date(2015, 1, 1), apples: 1600, bananas: 1440, cherries: 960, dates: 400},
  {month: new Date(2015, 2, 1), apples:  640, bananas:  960, cherries: 640, dates: 400},
  {month: new Date(2015, 3, 1), apples:  320, bananas:  480, cherries: 640, dates: 400}
]
d3.stack() 可以帮我们把上面的数据类型转为下面的数据类型来便于绘制堆叠面积图。
[
  [[   0, 3840], [   0, 1600], [   0,  640], [   0,  320]], // apples
  [[3840, 5760], [1600, 3040], [ 640, 1600], [ 320,  800]], // bananas
  [[5760, 6720], [3040, 4000], [1600, 2240], [ 800, 1440]], // cherries
  [[6720, 7120], [4000, 4400], [2240, 2640], [1440, 1840]], // dates
]
相关配置方法如下:
-
stack.keys()- 设置 keys 访问器, 指定需要处理的属性。 -
stack.order()- 设置排序访问器,内置以下:d3.stackOrderAscending - 将和最小的值的序列放在底部.
d3.stackOrderDescending - 将和最大的值的序列放在底部.
d3.stackOrderInsideOut - 和越大越靠近中间.
d3.stackOrderNone - 使用原始数据的顺序不进行顺序调整.
d3.stackOrderReverse - 将原始数据顺序逆转.
-
stack.offset()- 设置偏移访问器,内置以下:d3.stackOffsetExpand - 将基线设置为 0 并且顶线为 1.
d3.stackOffsetDiverging - 正值在 0 之上,负值在 0 之下.
d3.stackOffsetNone - 使用 0 基线.
d3.stackOffsetSilhouette - 将流图以 0 为中心居中.
d3.stackOffsetWiggle - 最小化流图的摆动.
<!doctype html>
<html lang="en">
<head>
    <meta charset="UTF-8">
    <meta name="viewport"
          content="width=device-width, user-scalable=no, initial-scale=1.0, maximum-scale=1.0, minimum-scale=1.0">
    <meta http-equiv="X-UA-Compatible" content="ie=edge">
    <title>Document</title>
    <style>
        .grid-line{
            stroke: black;
            shape-rendering: crispEdges;
            stroke-opacity: .2;
        }
        .line {
            fill: none;
            stroke: steelblue;
            stroke-width: 2;
        }
        .area {
            stroke: none;
            fill: steelblue;
            fill-opacity: .2;
        }
    </style>
</head>
<body>
<script src="../d3.js"></script>
<script>
    function stackedAreaChart() {
        const _chart = {}

        let _width = 900,
            _height = 900,
            _margins = {top: 30, right: 30, bottom: 30, left: 30},
            _x,
            _y,
            _colors = d3.scaleOrdinal(d3.schemeCategory10),
            _data = [],
            _svg,
            _body

        _chart.render = function () {
            if (!_svg) {
                _svg = d3.select('body').append('svg')
                    .attr('width', _width)
                    .attr('height', _height)

                renderAxes()
            }
            renderBody()
        }

        function renderAxes() {
            const axes = _svg.append('g')
                .classed('axes', true)

            axes.append('g')
                .classed('x-axis', true)
                .attr('transform', `translate(${_margins.left}, ${_height - _margins.bottom})`)
                .call(d3.axisBottom().scale(_x.range([0, _width - _margins.left - _margins.right])))

            axes.selectAll('g.x-axis g.tick')
                .append('line')
                    .classed('grid-line', true)
                        .attr('x1', 0)
                        .attr('y1', 0)
                        .attr('x2', 0)
                        .attr('y2', -(_height - -_margins.top - _margins.bottom))

            axes.append('g')
                .classed('y-axis', true)
                .attr('transform', `translate(${_margins.left}, ${_margins.top})`)
                .call(d3.axisLeft().scale(_y.range([_height - _margins.top - _margins.bottom, 0])))

            axes.selectAll('g.y-axis g.tick')
                .append('line')
                    .classed('grid-line', true)
                    .attr('x1', 0)
                    .attr('y1', 0)
                    .attr('x2', _width - _margins.left - _margins.right)
                    .attr('y2', 0)
        }

        function renderBody() {
            if (!_body) {
                _body = _svg.append('g')
                  .classed('body', true)
                  .attr('transform', `translate(${_margins.left}, ${_margins.top})`)
            }

            const stack = d3.stack()
                .keys(['value1', 'value2', 'value3'])
                .offset(d3.stackOffsetNone)

            const series = stack(_data)

            renderLines(series)
            renderAreas(series)
        }

        function renderLines(series) {
            const line = d3.line()
                .x((d, i) => _x(i))
                .y(d => _y(d[1]))

            const linePaths = _body.selectAll('path.line')
                .data(series)

            linePaths.enter()
                .append('path')
                .merge(linePaths)
                    .classed('line', true)
                    .style('stroke', (d, i) => _colors(i))
                    .transition()
                        .attr('d', d => line(d))

        }

        function renderAreas(series) {
            const area = d3.area()
              .x((d, i) => _x(i))
              .y0(d => _y(d[0]))
              .y1(d => _y(d[1]))

            const areaPaths = _body.selectAll('path.area')
                .data(series)

            areaPaths.enter()
                .append('path')
                .merge(areaPaths)
                    .classed('area', true)
                    .style('fill', (d, i) => _colors(i))
                .transition()
              .attr('d', d => area(d))
        }

        _chart.x = function (x) {
            if (!arguments.length) return _x
            _x = x
            return _chart
        }

        _chart.y = function (y) {
            if (!arguments.length) return _y
            _y = y
            return _chart
        }

        _chart.data = function (data) {
            if (!arguments.length) return _data
            _data = data
            return _chart
        }

        return _chart
    }

    const numberOfDataPoint = 51

    let data = d3.range(numberOfDataPoint).map(i => {
        return {
            value1: Math.random() * 10,
            value2: Math.random() * 10,
            value3: Math.random() * 10
        }
    })

    const chart = stackedAreaChart()
      .x(d3.scaleLinear().domain([0, 50]))
      .y(d3.scaleLinear().domain([0, 30]))

    function update() {
      data = d3.range(numberOfDataPoint).map(i => {
        return {
          value1: Math.random() * 10,
          value2: Math.random() * 10,
          value3: Math.random() * 10
        }
      })

      chart.data(data).render()
    }

    update()
</script>
<div class="control-group">
    <button onclick="update()">Update</button>
</div>
</body>
</html>
效果如下:
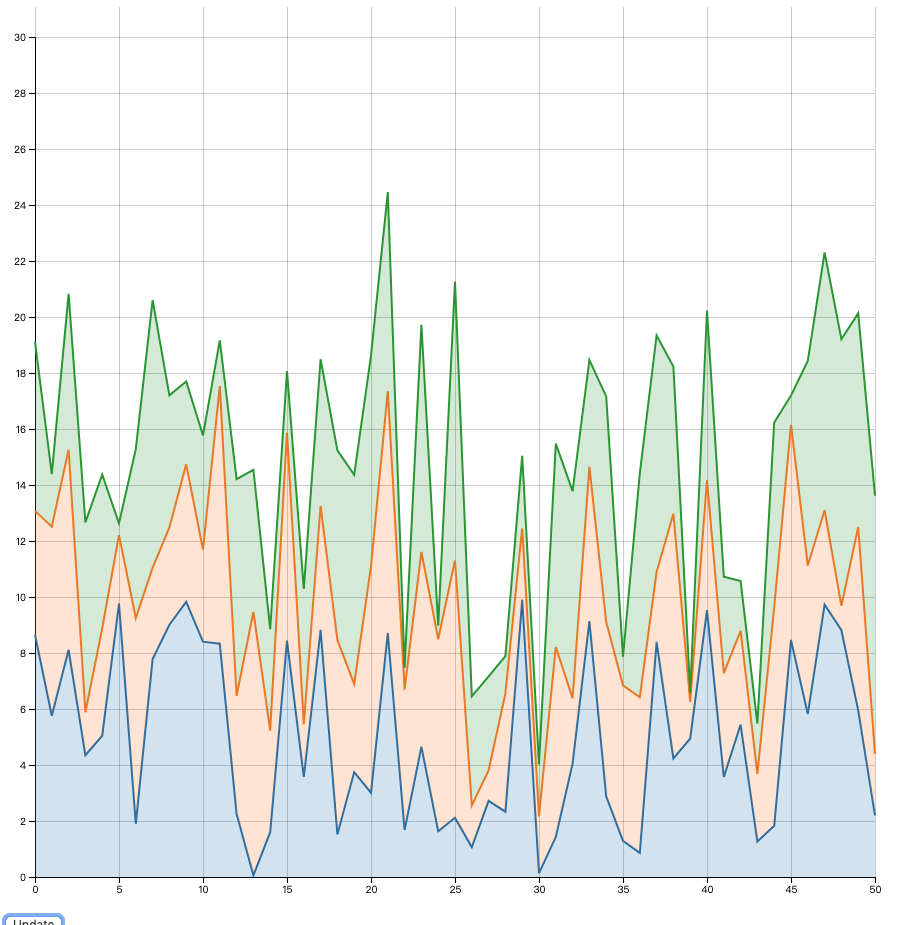
需要注意的是我们在设置 line 和 area 要指定正确的 x,y 取值。
 const line = d3.line()
    .x((d, i) => _x(i))
    .y(d => _y(d[1]))

 const area = d3.area()
    .x((d, i) => _x(i))
    .y0(d => _y(d[0]))
    .y1(d => _y(d[1]))
矩阵树图
d3.treemap() 可以帮我们构造矩阵树图布局。
它为数据项附加以下属性:
- node.x0 - 矩形的左边缘
- node.y0 - 矩形的上边缘
- node.x1 - 矩形的右边缘
- node.y1 - 矩形的下边缘
相关配置项如下:
treemap.tile()- 设置矩阵树图布局的填铺方法,默认为黄金分割填充,一般不改动就好。treemap.size()- 设置布局尺寸宽高,参数为数组形式。treemap.round()- 设置输出坐标是否取整。treemap.padding()- 设置块之间的间隔。
另外 treemap 处理的数据必须为 hierarchy 处理过的。
d3.hierarchy() 会为树状数据的节点添加以下属性项:
- node.data - 原数据
- node.depth - 当前节点的深度, 根节点为 0
- node.height - 当前节点的高度, 叶节点为 0.
- node.parent - 当前节点的父节点, 根节点为 null
- node.children - 当前节点的孩子节点(如果有的话); 叶节点为 undefined
- node.value - 当前节点以及 descendants(后代节点) 的总计值; 可以通过 node.sum 和 node.count 调用计算得来
相关的配置项如下:
node.sum()- 调用指定的函数规则为节点附加 value 值。node.sort()- 调用指定的排序函数规则排序所有的后代兄弟节点。node.count()- 以叶节点的个数附加为 value 值。node.each()- 以指定函数广度优先遍历当前子树.node.eachAfter()- 以指定函数后续遍历当前子树.node.eachBefore()- 以指定函数前序遍历当前子树.
相关的获取项如下:
node.ancestors()- 从当前节点开始返回其祖先节点数组.node.descendants()- 从当前节点开始返回其后代节点数组.node.leaves()- 返回当前节点为根节点的子树的叶节点.node.path()- 返回从当前节点到指定目标节点的最短路径.node.links()- 返回当前节点所在子树的所有边.
<!doctype html>
<html lang="en">
<head>
    <meta charset="UTF-8">
    <meta name="viewport"
          content="width=device-width, user-scalable=no, initial-scale=1.0, maximum-scale=1.0, minimum-scale=1.0">
    <meta http-equiv="X-UA-Compatible" content="ie=edge">
    <title>Document</title>
</head>
<body>
<script src="../d3.js"></script>
<script>
    function treeMapChart() {
        const _chart = {}

        let _width = 1600,
            _height = 800,
            _colors = d3.scaleOrdinal(d3.schemeCategory10),
            _nodes,
            _treemap,
            _valueAccessor,
            _svg,
            _body

        _chart.render = function () {
            if (!_svg) {
                _svg = d3.select('body').append('svg')
                  .attr('width', _width)
                  .attr('height', _height)
            }
            renderBody()
        }

        function renderBody() {
            if (!_body) {
                _body = _svg.append('g')
                    .classed('body', true)

                _treemap = d3.treemap()
                    .size([_width, _height])
                    .round(true)
                    .padding(1)
            }


            const root = d3.hierarchy(_nodes)
              .sum(_valueAccessor)
              .sort((a, b) => (b.value - a.value))

            _treemap(root)

            const cells = _body.selectAll('g.cell')
                .data(root.leaves(), d => d.data.name)

            renderCells(cells)
        }

        function renderCells(cells) {
            const cellsEnter = cells.enter()
            .append('g')
            .merge(cells)
                .classed('cell', true)
                .attr('transform', d => {
                  return `translate(${d.x0}, ${d.y0})`
                })

            cellsEnter.append('rect')

            cellsEnter
                .merge(cells)
                .select('rect')
                .transition()
                .attr('width', d => d.x1 - d.x0)
                .attr('height', d => d.y1 - d.y0)
                .style('fill', d => _colors(d.parent.data.name))


            cellsEnter.append('text')

            cellsEnter.merge(cells)
              .select('text')
              .style('font-size', 11)
              .attr('x', d =>  (d.x1 - d.x0) / 2)
              .attr('y', d =>  (d.y1 - d.y0) / 2)
              .attr('text-anchor', 'middle')
              .text(d => d.data.name)
              .style('opacity', function (d) {
                return this.getComputedTextLength() < (d.x1 - d.x0) ? 1 : 0
                })

            cells.exit().remove()
        }


        _chart.nodes = function (n) {
            if (!arguments.length) return _nodes;
            _nodes = n;
            return _chart;
        };
        _chart.valueAccessor = function (fn) {
            if (!arguments.length) return _valueAccessor;
            _valueAccessor = fn;
            return _chart;
        };


        return _chart
    }

    const chart = treeMapChart();

    function flare() {
        d3.json("treeData.json").then(nodes => {
            chart.nodes(nodes).valueAccessor(size).render();
        })
    }

    function size(d) {
      return d.size;
    }

    function count() {
      return 1;
    }

    function flip(chart) {
      chart.valueAccessor(chart.valueAccessor() === size ? count : size).render();
    }
</script>
<div class="control-group">
    <button onclick="flare()">Render Flare</button>
    <button onclick="flip(chart)">Flip Value vs. Count</button>
</div>
</body>
</html>
treeData.json:
{
  "name": "flare",
  "children": [
    {
      "name": "analytics",
      "children": [
        {
          "name": "cluster",
          "children": [
            {"name": "AgglomerativeCluster", "size": 3938},
            {"name": "CommunityStructure", "size": 3812},
            {"name": "HierarchicalCluster", "size": 6714},
            {"name": "MergeEdge", "size": 743}
          ]
        },
        {
          "name": "graph",
          "children": [
            {"name": "BetweennessCentrality", "size": 3534},
            {"name": "LinkDistance", "size": 5731},
            {"name": "MaxFlowMinCut", "size": 7840},
            {"name": "ShortestPaths", "size": 5914},
            {"name": "SpanningTree", "size": 3416}
          ]
        },
        {
          "name": "optimization",
          "children": [
            {"name": "AspectRatioBanker", "size": 7074}
          ]
        }
      ]
    },
    {
      "name": "animate",
      "children": [
        {"name": "Easing", "size": 17010},
        {"name": "FunctionSequence", "size": 5842},
        {
          "name": "interpolate",
          "children": [
            {"name": "ArrayInterpolator", "size": 1983},
            {"name": "ColorInterpolator", "size": 2047},
            {"name": "DateInterpolator", "size": 1375},
            {"name": "Interpolator", "size": 8746},
            {"name": "MatrixInterpolator", "size": 2202},
            {"name": "NumberInterpolator", "size": 1382},
            {"name": "ObjectInterpolator", "size": 1629},
            {"name": "PointInterpolator", "size": 1675},
            {"name": "RectangleInterpolator", "size": 2042}
          ]
        },
        {"name": "ISchedulable", "size": 1041},
        {"name": "Parallel", "size": 5176},
        {"name": "Pause", "size": 449},
        {"name": "Scheduler", "size": 5593},
        {"name": "Sequence", "size": 5534},
        {"name": "Transition", "size": 9201},
        {"name": "Transitioner", "size": 19975},
        {"name": "TransitionEvent", "size": 1116},
        {"name": "Tween", "size": 6006}
      ]
    },
    {
      "name": "data",
      "children": [
        {
          "name": "converters",
          "children": [
            {"name": "Converters", "size": 721},
            {"name": "DelimitedTextConverter", "size": 4294},
            {"name": "GraphMLConverter", "size": 9800},
            {"name": "IDataConverter", "size": 1314},
            {"name": "JSONConverter", "size": 2220}
          ]
        },
        {"name": "DataField", "size": 1759},
        {"name": "DataSchema", "size": 2165},
        {"name": "DataSet", "size": 586},
        {"name": "DataSource", "size": 3331},
        {"name": "DataTable", "size": 772},
        {"name": "DataUtil", "size": 3322}
      ]
    },
    {
      "name": "display",
      "children": [
        {"name": "DirtySprite", "size": 8833},
        {"name": "LineSprite", "size": 1732},
        {"name": "RectSprite", "size": 3623},
        {"name": "TextSprite", "size": 10066}
      ]
    },
    {
      "name": "flex",
      "children": [
        {"name": "FlareVis", "size": 4116}
      ]
    },
    {
      "name": "physics",
      "children": [
        {"name": "DragForce", "size": 1082},
        {"name": "GravityForce", "size": 1336},
        {"name": "IForce", "size": 319},
        {"name": "NBodyForce", "size": 10498},
        {"name": "Particle", "size": 2822},
        {"name": "Simulation", "size": 9983},
        {"name": "Spring", "size": 2213},
        {"name": "SpringForce", "size": 1681}
      ]
    },
    {
      "name": "query",
      "children": [
        {"name": "AggregateExpression", "size": 1616},
        {"name": "And", "size": 1027},
        {"name": "Arithmetic", "size": 3891},
        {"name": "Average", "size": 891},
        {"name": "BinaryExpression", "size": 2893},
        {"name": "Comparison", "size": 5103},
        {"name": "CompositeExpression", "size": 3677},
        {"name": "Count", "size": 781},
        {"name": "DateUtil", "size": 4141},
        {"name": "Distinct", "size": 933},
        {"name": "Expression", "size": 5130},
        {"name": "ExpressionIterator", "size": 3617},
        {"name": "Fn", "size": 3240},
        {"name": "If", "size": 2732},
        {"name": "IsA", "size": 2039},
        {"name": "Literal", "size": 1214},
        {"name": "Match", "size": 3748},
        {"name": "Maximum", "size": 843},
        {
          "name": "methods",
          "children": [
            {"name": "add", "size": 593},
            {"name": "and", "size": 330},
            {"name": "average", "size": 287},
            {"name": "count", "size": 277},
            {"name": "distinct", "size": 292},
            {"name": "div", "size": 595},
            {"name": "eq", "size": 594},
            {"name": "fn", "size": 460},
            {"name": "gt", "size": 603},
            {"name": "gte", "size": 625},
            {"name": "iff", "size": 748},
            {"name": "isa", "size": 461},
            {"name": "lt", "size": 597},
            {"name": "lte", "size": 619},
            {"name": "max", "size": 283},
            {"name": "min", "size": 283},
            {"name": "mod", "size": 591},
            {"name": "mul", "size": 603},
            {"name": "neq", "size": 599},
            {"name": "not", "size": 386},
            {"name": "or", "size": 323},
            {"name": "orderby", "size": 307},
            {"name": "range", "size": 772},
            {"name": "select", "size": 296},
            {"name": "stddev", "size": 363},
            {"name": "sub", "size": 600},
            {"name": "sum", "size": 280},
            {"name": "update", "size": 307},
            {"name": "variance", "size": 335},
            {"name": "where", "size": 299},
            {"name": "xor", "size": 354},
            {"name": "_", "size": 264}
          ]
        },
        {"name": "Minimum", "size": 843},
        {"name": "Not", "size": 1554},
        {"name": "Or", "size": 970},
        {"name": "Query", "size": 13896},
        {"name": "Range", "size": 1594},
        {"name": "StringUtil", "size": 4130},
        {"name": "Sum", "size": 791},
        {"name": "Variable", "size": 1124},
        {"name": "Variance", "size": 1876},
        {"name": "Xor", "size": 1101}
      ]
    },
    {
      "name": "scale",
      "children": [
        {"name": "IScaleMap", "size": 2105},
        {"name": "LinearScale", "size": 1316},
        {"name": "LogScale", "size": 3151},
        {"name": "OrdinalScale", "size": 3770},
        {"name": "QuantileScale", "size": 2435},
        {"name": "QuantitativeScale", "size": 4839},
        {"name": "RootScale", "size": 1756},
        {"name": "Scale", "size": 4268},
        {"name": "ScaleType", "size": 1821},
        {"name": "TimeScale", "size": 5833}
      ]
    },
    {
      "name": "util",
      "children": [
        {"name": "Arrays", "size": 8258},
        {"name": "Colors", "size": 10001},
        {"name": "Dates", "size": 8217},
        {"name": "Displays", "size": 12555},
        {"name": "Filter", "size": 2324},
        {"name": "Geometry", "size": 10993},
        {
          "name": "heap",
          "children": [
            {"name": "FibonacciHeap", "size": 9354},
            {"name": "HeapNode", "size": 1233}
          ]
        },
        {"name": "IEvaluable", "size": 335},
        {"name": "IPredicate", "size": 383},
        {"name": "IValueProxy", "size": 874},
        {
          "name": "math",
          "children": [
            {"name": "DenseMatrix", "size": 3165},
            {"name": "IMatrix", "size": 2815},
            {"name": "SparseMatrix", "size": 3366}
          ]
        },
        {"name": "Maths", "size": 17705},
        {"name": "Orientation", "size": 1486},
        {
          "name": "palette",
          "children": [
            {"name": "ColorPalette", "size": 6367},
            {"name": "Palette", "size": 1229},
            {"name": "ShapePalette", "size": 2059},
            {"name": "SizePalette", "size": 2291}
          ]
        },
        {"name": "Property", "size": 5559},
        {"name": "Shapes", "size": 19118},
        {"name": "Sort", "size": 6887},
        {"name": "Stats", "size": 6557},
        {"name": "Strings", "size": 22026}
      ]
    },
    {
      "name": "vis",
      "children": [
        {
          "name": "axis",
          "children": [
            {"name": "Axes", "size": 1302},
            {"name": "Axis", "size": 24593},
            {"name": "AxisGridLine", "size": 652},
            {"name": "AxisLabel", "size": 636},
            {"name": "CartesianAxes", "size": 6703}
          ]
        },
        {
          "name": "controls",
          "children": [
            {"name": "AnchorControl", "size": 2138},
            {"name": "ClickControl", "size": 3824},
            {"name": "Control", "size": 1353},
            {"name": "ControlList", "size": 4665},
            {"name": "DragControl", "size": 2649},
            {"name": "ExpandControl", "size": 2832},
            {"name": "HoverControl", "size": 4896},
            {"name": "IControl", "size": 763},
            {"name": "PanZoomControl", "size": 5222},
            {"name": "SelectionControl", "size": 7862},
            {"name": "TooltipControl", "size": 8435}
          ]
        },
        {
          "name": "data",
          "children": [
            {"name": "Data", "size": 20544},
            {"name": "DataList", "size": 19788},
            {"name": "DataSprite", "size": 10349},
            {"name": "EdgeSprite", "size": 3301},
            {"name": "NodeSprite", "size": 19382},
            {
              "name": "render",
              "children": [
                {"name": "ArrowType", "size": 698},
                {"name": "EdgeRenderer", "size": 5569},
                {"name": "IRenderer", "size": 353},
                {"name": "ShapeRenderer", "size": 2247}
              ]
            },
            {"name": "ScaleBinding", "size": 11275},
            {"name": "Tree", "size": 7147},
            {"name": "TreeBuilder", "size": 9930}
          ]
        },
        {
          "name": "events",
          "children": [
            {"name": "DataEvent", "size": 2313},
            {"name": "SelectionEvent", "size": 1880},
            {"name": "TooltipEvent", "size": 1701},
            {"name": "VisualizationEvent", "size": 1117}
          ]
        },
        {
          "name": "legend",
          "children": [
            {"name": "Legend", "size": 20859},
            {"name": "LegendItem", "size": 4614},
            {"name": "LegendRange", "size": 10530}
          ]
        },
        {
          "name": "operator",
          "children": [
            {
              "name": "distortion",
              "children": [
                {"name": "BifocalDistortion", "size": 4461},
                {"name": "Distortion", "size": 6314},
                {"name": "FisheyeDistortion", "size": 3444}
              ]
            },
            {
              "name": "encoder",
              "children": [
                {"name": "ColorEncoder", "size": 3179},
                {"name": "Encoder", "size": 4060},
                {"name": "PropertyEncoder", "size": 4138},
                {"name": "ShapeEncoder", "size": 1690},
                {"name": "SizeEncoder", "size": 1830}
              ]
            },
            {
              "name": "filter",
              "children": [
                {"name": "FisheyeTreeFilter", "size": 5219},
                {"name": "GraphDistanceFilter", "size": 3165},
                {"name": "VisibilityFilter", "size": 3509}
              ]
            },
            {"name": "IOperator", "size": 1286},
            {
              "name": "label",
              "children": [
                {"name": "Labeler", "size": 9956},
                {"name": "RadialLabeler", "size": 3899},
                {"name": "StackedAreaLabeler", "size": 3202}
              ]
            },
            {
              "name": "layout",
              "children": [
                {"name": "AxisLayout", "size": 6725},
                {"name": "BundledEdgeRouter", "size": 3727},
                {"name": "CircleLayout", "size": 9317},
                {"name": "CirclePackingLayout", "size": 12003},
                {"name": "DendrogramLayout", "size": 4853},
                {"name": "ForceDirectedLayout", "size": 8411},
                {"name": "IcicleTreeLayout", "size": 4864},
                {"name": "IndentedTreeLayout", "size": 3174},
                {"name": "Layout", "size": 7881},
                {"name": "NodeLinkTreeLayout", "size": 12870},
                {"name": "PieLayout", "size": 2728},
                {"name": "RadialTreeLayout", "size": 12348},
                {"name": "RandomLayout", "size": 870},
                {"name": "StackedAreaLayout", "size": 9121},
                {"name": "TreeMapLayout", "size": 9191}
              ]
            },
            {"name": "Operator", "size": 2490},
            {"name": "OperatorList", "size": 5248},
            {"name": "OperatorSequence", "size": 4190},
            {"name": "OperatorSwitch", "size": 2581},
            {"name": "SortOperator", "size": 2023}
          ]
        },
        {"name": "Visualization", "size": 16540}
      ]
    }
  ]
}
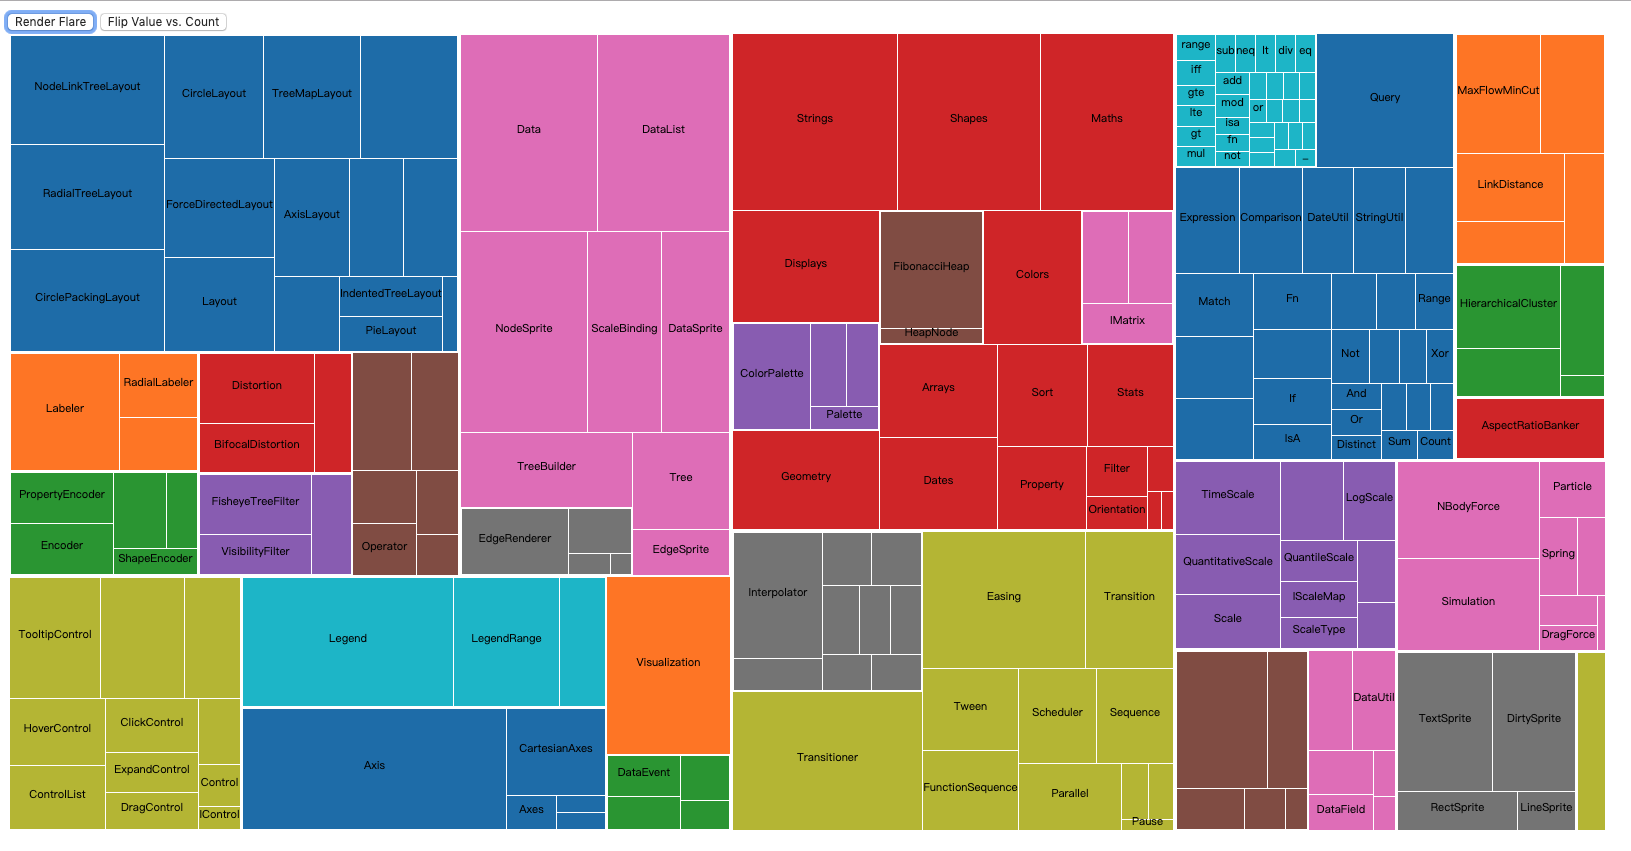
效果如下:
以size排序:
以子节点数目排序:
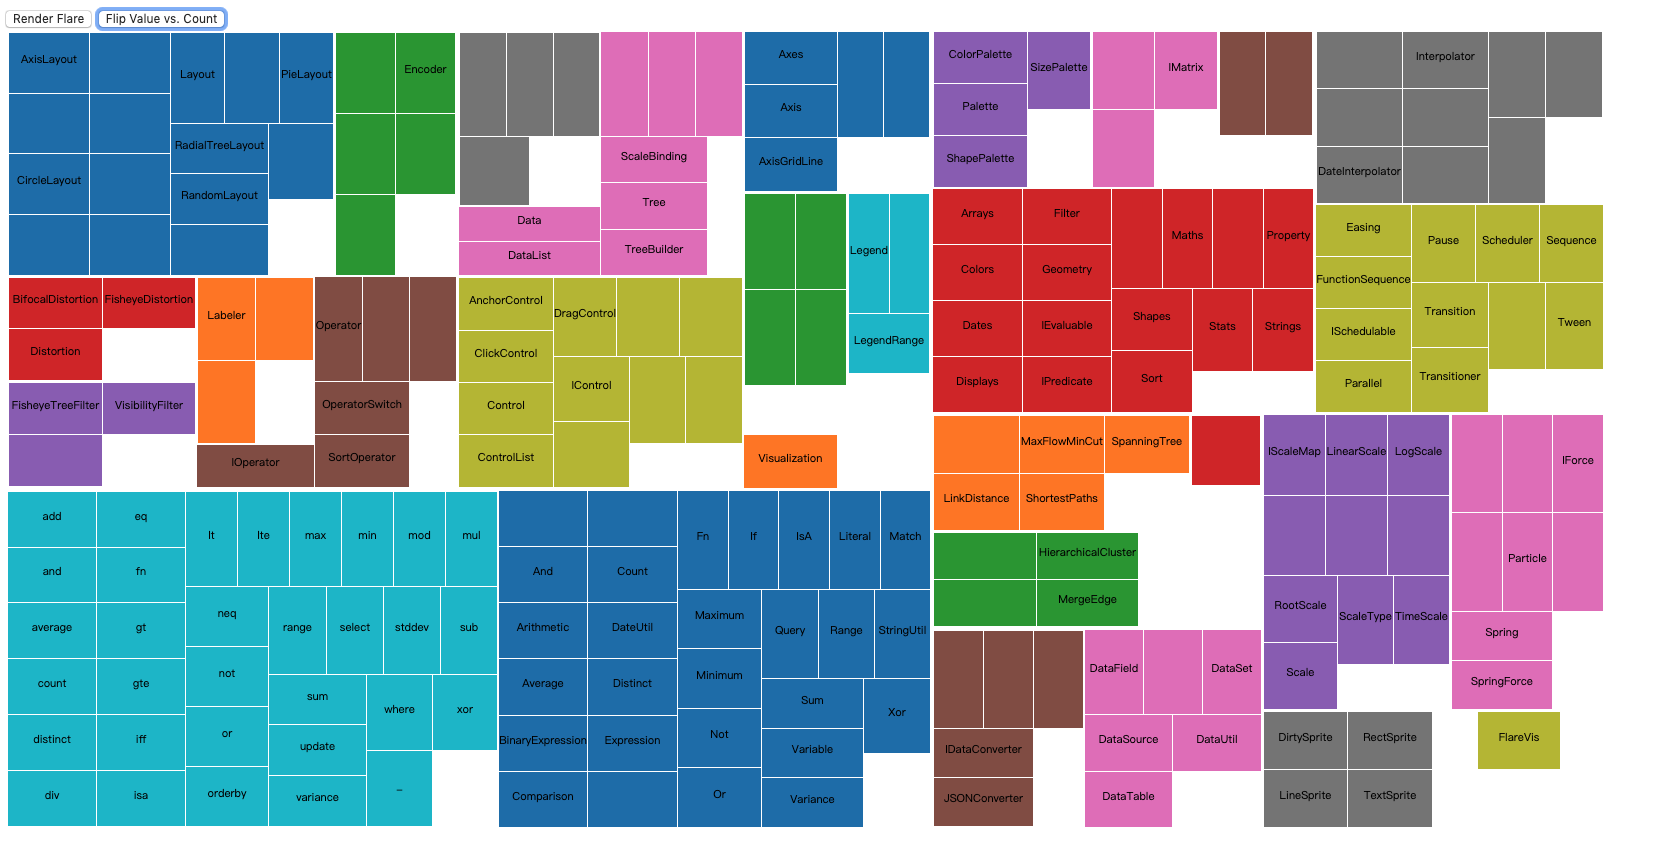
我们使用下面的代码完成了对 json 数据的处理
_treemap = d3.treemap()
    .size([_width, _height])
    .round(true)
    .padding(1)

const root = d3.hierarchy(_nodes)
    .sum(_valueAccessor)
    .sort((a, b) => (b.value - a.value))

_treemap(root)
应为树图只渲染叶节点,所以我们在传递数据时传递的是 root.leaves()。
然后就是常见的对数据进行渲染,我们对 text 多加了个超出就块宽度就隐藏的功能。
思维树图
d3.tree() 帮我们对 hierarchy 数据完成树的布局初始化。
它为节点添加以下属性:
- node.x - 节点的 x 坐标
- node.y - 节点的 y 坐标
配置项:
tree.size()- 以数组的形式设置树图宽高。
<!doctype html>
<html lang="en">
<head>
    <meta charset="UTF-8">
    <meta name="viewport"
          content="width=device-width, user-scalable=no, initial-scale=1.0, maximum-scale=1.0, minimum-scale=1.0">
    <meta http-equiv="X-UA-Compatible" content="ie=edge">
    <title>Document</title>
    <style>
        .node circle {
            cursor: pointer;
            fill: #fff;
            stroke: steelblue;
            stroke-width: 1.5px;
        }
        path.link {
            fill: none;
            stroke: #ccc;
            stroke-width: 1.5px;
        }
    </style>
</head>
<body>
<script src="../d3.js"></script>
<script>
    function treeChart() {
        const _chart = {}

        let _width = 1700,
            _height = 1700,
            _margins = {top: 30, right: 200, bottom: 30, left: 60},
            _duration = 300,
            _i = 0,
            _nodes,
            _root,
            _svg,
            _body

        _chart.render = function () {
            if (!_svg) {
                _svg = d3.select('body')
                    .append('svg')
                        .attr('width', _width)
                        .attr('height', _height)
            }
            renderBody()
        }

        function renderBody() {
            if (!_body) {
                _body = _svg.append('g')
                    .classed('body', true)
                    .attr('transform', `translate(${_margins.left}, ${_margins.top})`)
            }

            _root = d3.hierarchy(_nodes)

            render(_root)
        }

        function render(root, source) {
            const tree = d3.tree()
                .size([_width - _margins.left - _margins.right, _height - _margins.top - _margins.bottom])

            tree(root)

            renderNodes(root, source)

            renderLinks(root)
        }

        function toggle(d) {
            if (d.children) {
                d._children = d.children
                d.children = null
            } else {
                d.children = d._children
                d._children = null
            }
        }

        function renderNodes(root, source) {

            const nodeG = _body.selectAll('g.node')
              .data(root.descendants(), d => {
                    return d.id || (d.id = _i++)
              })

            const nodeEnter = nodeG.enter()
                .append('g')
                    .classed('node', true)
                    .attr('transform', d => `translate(${source ? source.y : d.y}, ${source ? source.x : d.x})`)
                .on('click', d => {
                    toggle(d)
                    render(_root, d)
                })

            nodeEnter.append('circle')
                .attr('r', 4.5)
                .style('stroke', '#000')
                .style('fill', '#fff')


            nodeEnter.append('text')
                .attr('x', d => {
                    return d.children || d._children ? -10 : 10
                })
                .attr('dy', '.35em')
                .attr('text-anchor', d => {
                    return d.children || d._children ? 'end' : 'start'
                })
                .text(d => d.data.name)
            .transition().duration(_duration)
                .attr('font-size', '11')


            const nodeUpdate = nodeEnter.merge(nodeG)
                .transition().duration(_duration)
                .attr('transform', d => `translate(${d.y}, ${d.x})`)

            nodeUpdate.select('circle')
                .style('fill', d => {
                    return d._children ? 'lightsteelblue' : '#fff'
                })

            nodeUpdate.select('text')
                .style('fill-opacity', 1)

            const nodeExit = nodeG.exit()
                .transition().duration(_duration)
                    .attr('transform', d => `translate(${source ? source.y : d.y}, ${source ? source.x : d.x})`)
                    .remove()

            nodeExit.select('circle')
                .attr('r', 1e-6)
                .remove()

            nodeExit.select('text')
                .style('fill-opacity', 1e-6)
        }

        function renderLinks(root) {
            const link = _body.selectAll('path.link')
              .data(root.descendants().slice(1), d => {
                return d.id || (d.id = _i++)
              })

            link.enter()
                .insert('path', 'g')
                    .classed('link', true)
                .attr('stroke-opacity', 0)
                .merge(link)
                .transition().duration(_duration)
                    .attr('d', d => generateLinkPath(d, d.parent))
                .attr('stroke-opacity', 1)

            link.exit()
              .transition().duration(_duration)
                .attr('stroke-opacity', 0)
              .remove()
        }

        function generateLinkPath(target, source) {
            const path = d3.path()
            path.moveTo(source.y, source.x)
            path.bezierCurveTo((source.y + target.y) / 2, source.x, (source.y + target.y) / 2, target.x, target.y, target.x)
            return path.toString()
        }

        _chart.nodes = function (nodes) {
            if (!arguments.length) return _nodes
            _nodes = nodes
            return _chart
        }

        return _chart
    }

    const chart = treeChart()

    d3.json('./treeData.json').then(nodes => {
        chart.nodes(nodes).render()
    })
</script>
</body>
</html>
效果如下:
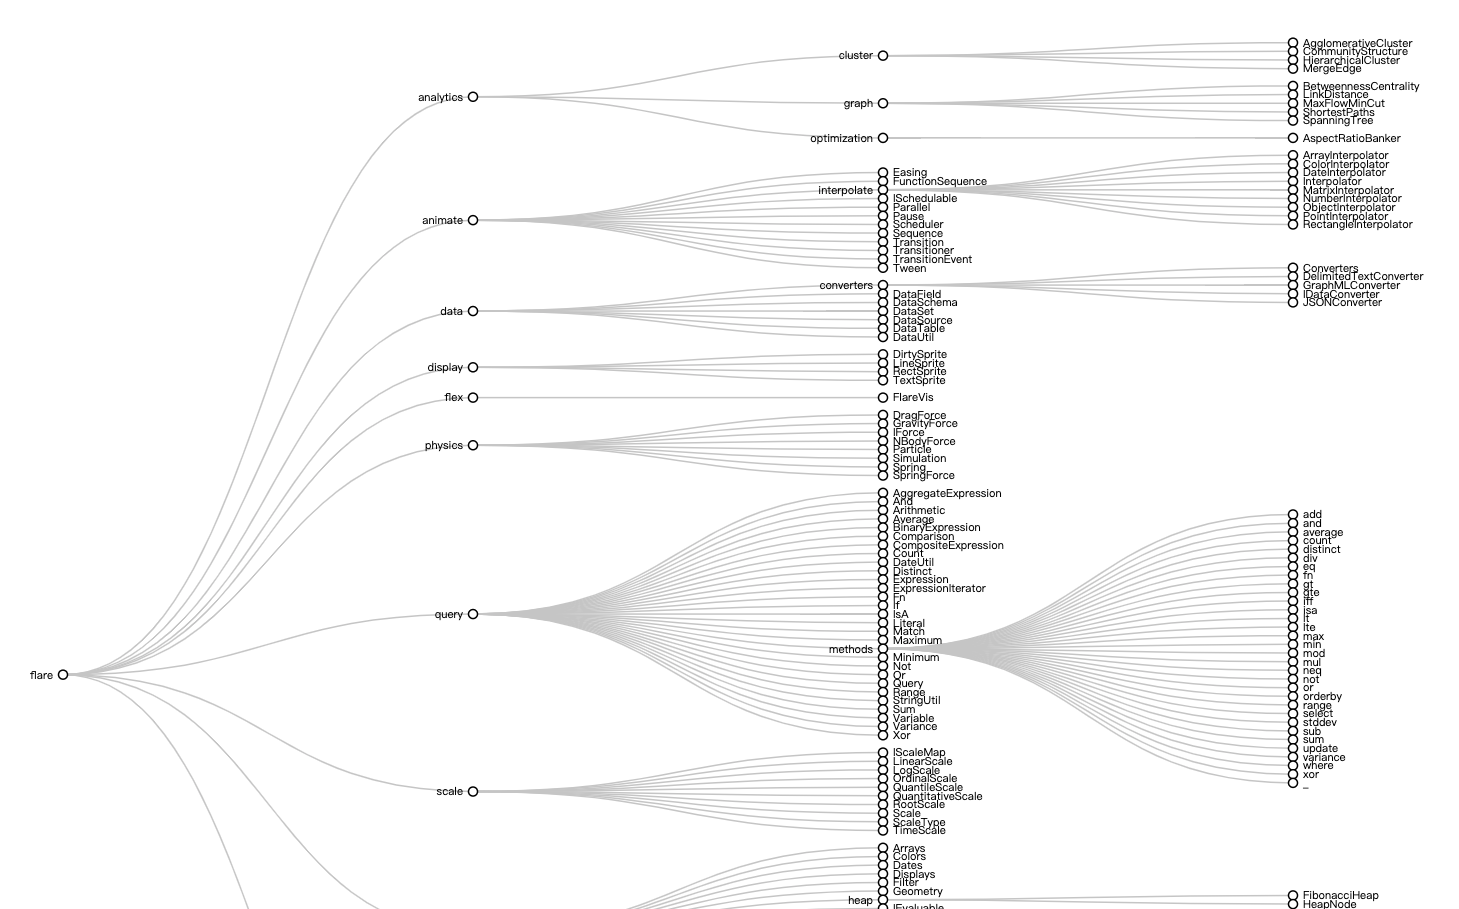
注意里面我们将 x y 对调以将树图变为横向,另外我们通过 toggle 函数将数据保存在dom上实现了子节点的收缩。
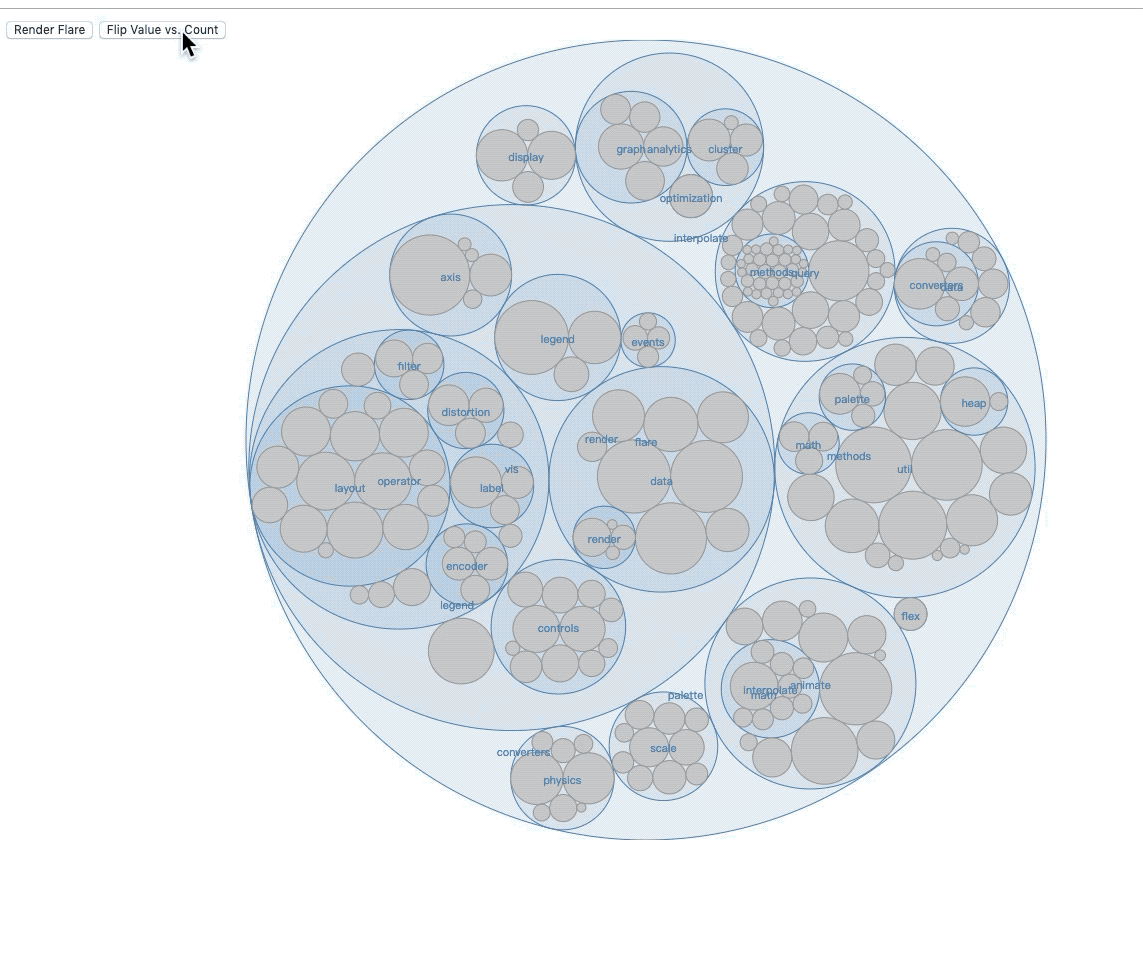
封闭图
封闭图要使用 d3.pack()。
它为节点附加以下属性:
- node.x - 节点中心的 x- 坐标
- node.y - 节点中心的 y- 坐标
- node.r - 圆的半径
有以下配置方法:
pack.radius()- 设置半径访问器.pack.size()- 设置布局尺寸.pack.padding()- 设置间隙.
<!doctype html>
<html lang="en">
<head>
    <meta charset="UTF-8">
    <meta name="viewport"
          content="width=device-width, user-scalable=no, initial-scale=1.0, maximum-scale=1.0, minimum-scale=1.0">
    <meta http-equiv="X-UA-Compatible" content="ie=edge">
    <title>Document</title>
    <style>
        circle {
            fill: #ccc;
            stroke: #999;
            pointer-events: all;
        }
        circle.parent {
            fill: steelblue;
            fill-opacity: .1;
            stroke: steelblue;
        }
        circle.parent:hover {
            stroke-width: .5px;
        }
        circle.child {
            pointer-events: none;
        }
        text {
            font-size: 11px;
            pointer-events: none;
            fill: steelblue;
        }

    </style>
</head>
<body>
<script src="../d3.js"></script>
<script>
    function packChart() {
        const _chart = {}

        let _width = 1280,
            _height = 800,
            _nodes,
            _root,
            _valueAccessor,
            _svg,
            _body

        _chart.render = function () {
            if (!_svg) {
                _svg = d3.select('body')
                    .append('svg')
                        .attr('width', _width)
                        .attr('height', _height)
            }
            renderBody()
        }

        function renderBody() {
            if (!_body) {
                _body = _svg.append('g')
                    .classed('body', true)
            }

            const pack = d3.pack()
                .size([_width, _height])

            _root = d3.hierarchy(_nodes)
                .sum(_valueAccessor)
                .sort((a, b) => b.value - a.value)

            pack(_root)

            console.log(_root)

            renderCircles(_root.descendants())

            renderLabels(_root.descendants())
        }

        function renderCircles(nodes) {
            const circles = _body.selectAll('circle')
                .data(nodes)

            circles.enter()
                .append('circle')
                .merge(circles)
                .transition()
                    .attr('class', d => d.children ? 'parent' : 'child')
                    .attr('cx', d => d.x)
                    .attr('cy', d => d.y)
                    .attr('r', d => d.r)

            circles.exit()
                .transition()
                    .attr('r', 0)
                .remove()
        }

        function renderLabels(nodes) {
            const labels = _body.selectAll('text')
              .data(nodes)

            labels.enter()
              .append('text')
              .attr('dy', '.35rem')
              .attr('text-anchor', 'middle')
              .merge(labels)
              .filter(d => d.children)
              .attr('x', d => d.x)
              .attr('y', d => d.y)
              .text(d => d.data.name)

            labels.exit().remove()
        }

        _chart.nodes = function (nodes) {
            if (!arguments.length) return _nodes
            _nodes = nodes
            return _chart
        }

        _chart.valueAccessor = function (fn) {
            if (!arguments.length) return _valueAccessor
            _valueAccessor = fn
            return _chart
        }

        return _chart
    }

    const chart = packChart()

    function flare() {
      d3.json('./treeData.json').then(nodes => {
        chart.nodes(nodes).valueAccessor(size).render()
      })
    }

    function size(d) {
        return d.size
    }

    function count() {
        return 1
    }

    function flip() {
        chart.valueAccessor(chart.valueAccessor() === size ? count : size).render()
    }
</script>
<div class="control-group">
    <button onclick="flare()">Render Flare</button>
    <button onclick="flip()">Flip Value vs. Count</button>
</div>
</body>
</html>
效果如下: