import requests
import pandas as pd
import matplotlib.pyplot as plt
from matplotlib import rcParams
rcParams['font.sans-serif'] = ['SimHei']
rcParams['axes.unicode_minus'] = False
url = "https://api.bilibili.com/x/web-interface/ranking?rid=0&day=3"
headers = {"User-Agent": "Mozilla/5.0"}
res = requests.get(url, headers=headers)
data = res.json()
videos = []
for video in data['data']['list'][:10]:
videos.append({
"title": video.get('title', '无标题'),
"author": video.get('author', '无UP主'),
"views": video.get('play', 0)
})
df = pd.DataFrame(videos)
excel_file = "bilibili_ranking.xlsx"
df.to_excel(excel_file, index=False)
print(f"✅ 数据已保存到 {excel_file}")
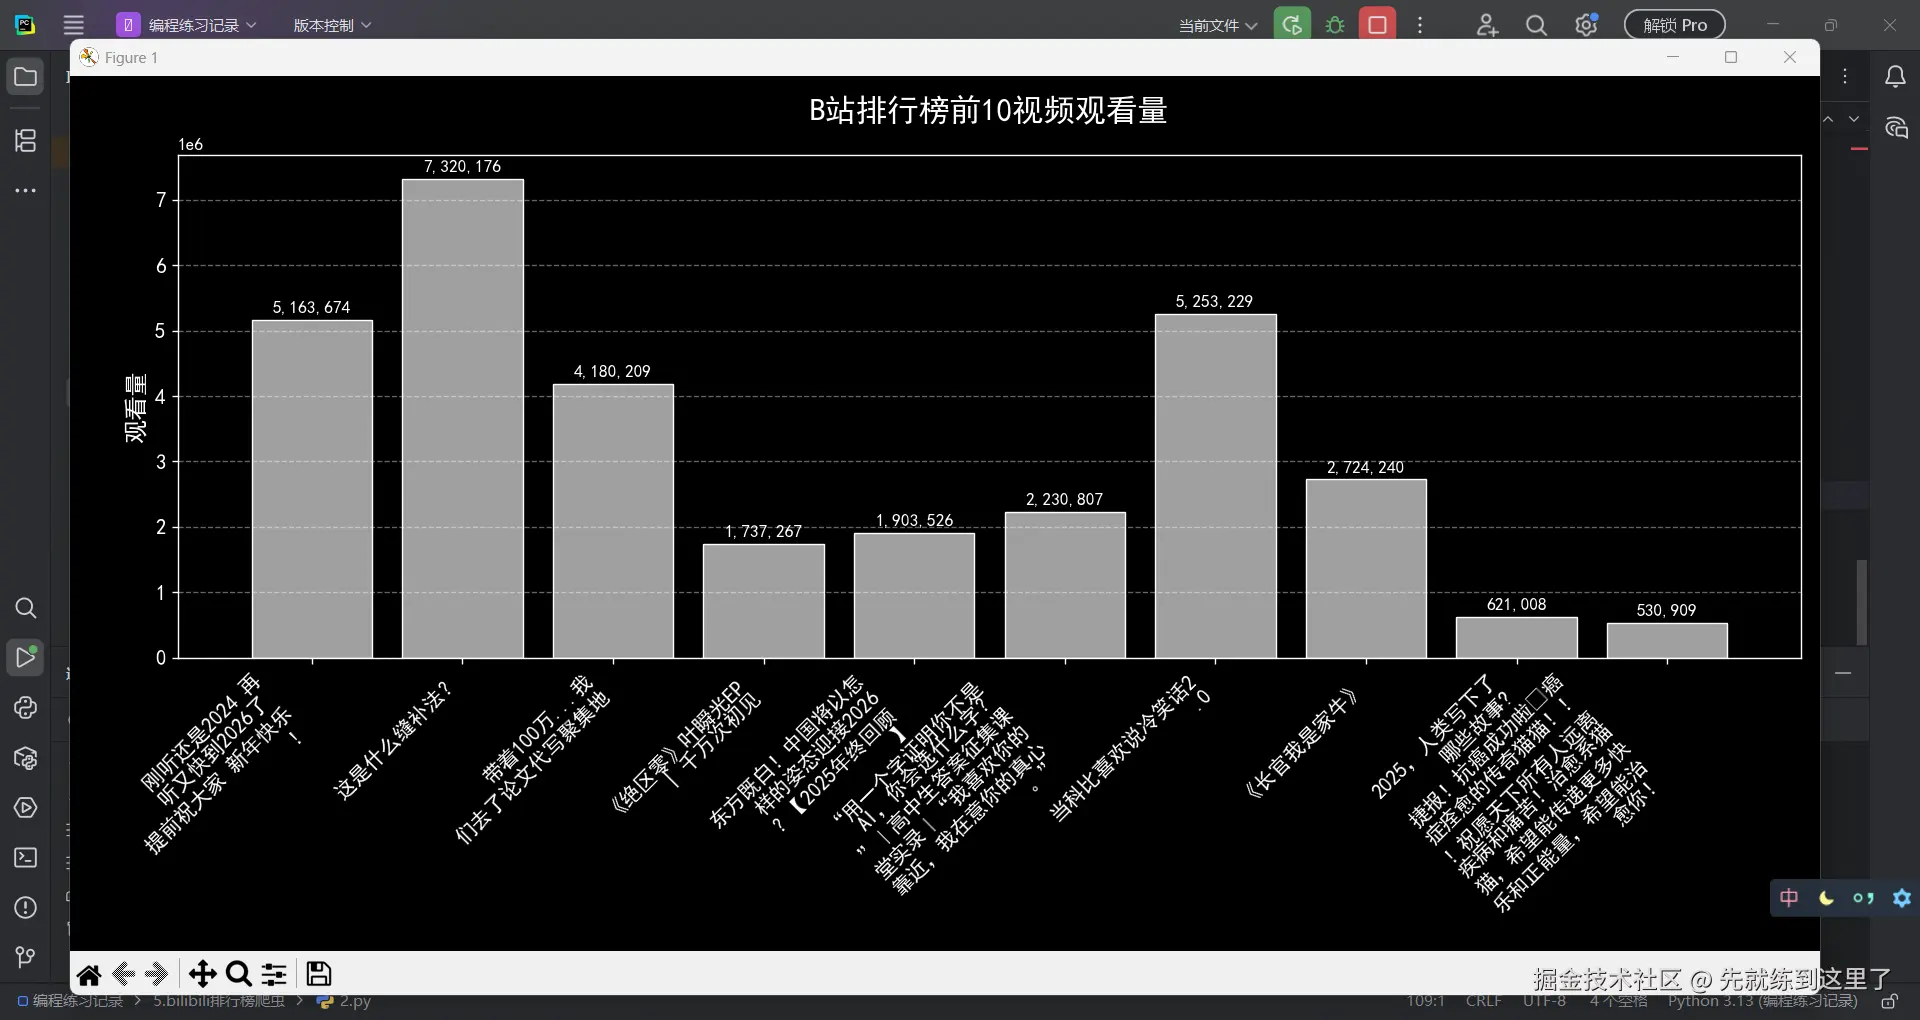
plt.style.use('dark_background')
plt.figure(figsize=(14, 7))
x = range(len(df['title']))
bars = plt.bar(x, df['views'], color='gray')
titles = ['\n'.join([t[i:i+10] for i in range(0, len(t), 10)]) for t in df['title']]
plt.xticks(x, titles, rotation=45, ha='right', color='white')
plt.title("B站排行榜前10视频观看量", fontsize=16, color='white')
plt.ylabel("观看量", fontsize=14, color='white')
for bar in bars:
height = bar.get_height()
plt.text(bar.get_x() + bar.get_width()/2, height, str(height), ha='center', va='bottom', fontsize=10, color='white')
plt.tight_layout()
plt.show()
import requests
import pandas as pd
import matplotlib.pyplot as plt
from matplotlib import rcParams
import time
from datetime import datetime
rcParams['font.sans-serif'] = ['SimHei']
rcParams['axes.unicode_minus'] = False
plt.style.use('dark_background')
plt.rcParams.update({'figure.autolayout': True})
TOP_N = 10
SAVE_EXCEL = True
REFRESH_INTERVAL = 0
def fetch_bilibili_ranking():
url = "https://api.bilibili.com/x/web-interface/ranking?rid=0&day=3"
headers = {"User-Agent": "Mozilla/5.0"}
res = requests.get(url, headers=headers)
data = res.json()
videos = []
for video in data['data']['list'][:TOP_N]:
videos.append({
"title": video.get('title', '无标题'),
"author": video.get('author', '无UP主'),
"views": video.get('play', 0),
"danmu": video.get('stat', {}).get('danmaku', 0)
})
return pd.DataFrame(videos)
def save_to_excel(df):
filename = f"bilibili_ranking_{datetime.now().strftime('%Y%m%d_%H%M%S')}.xlsx"
df.to_excel(filename, index=False)
print(f"✅ 数据已保存到 {filename}")
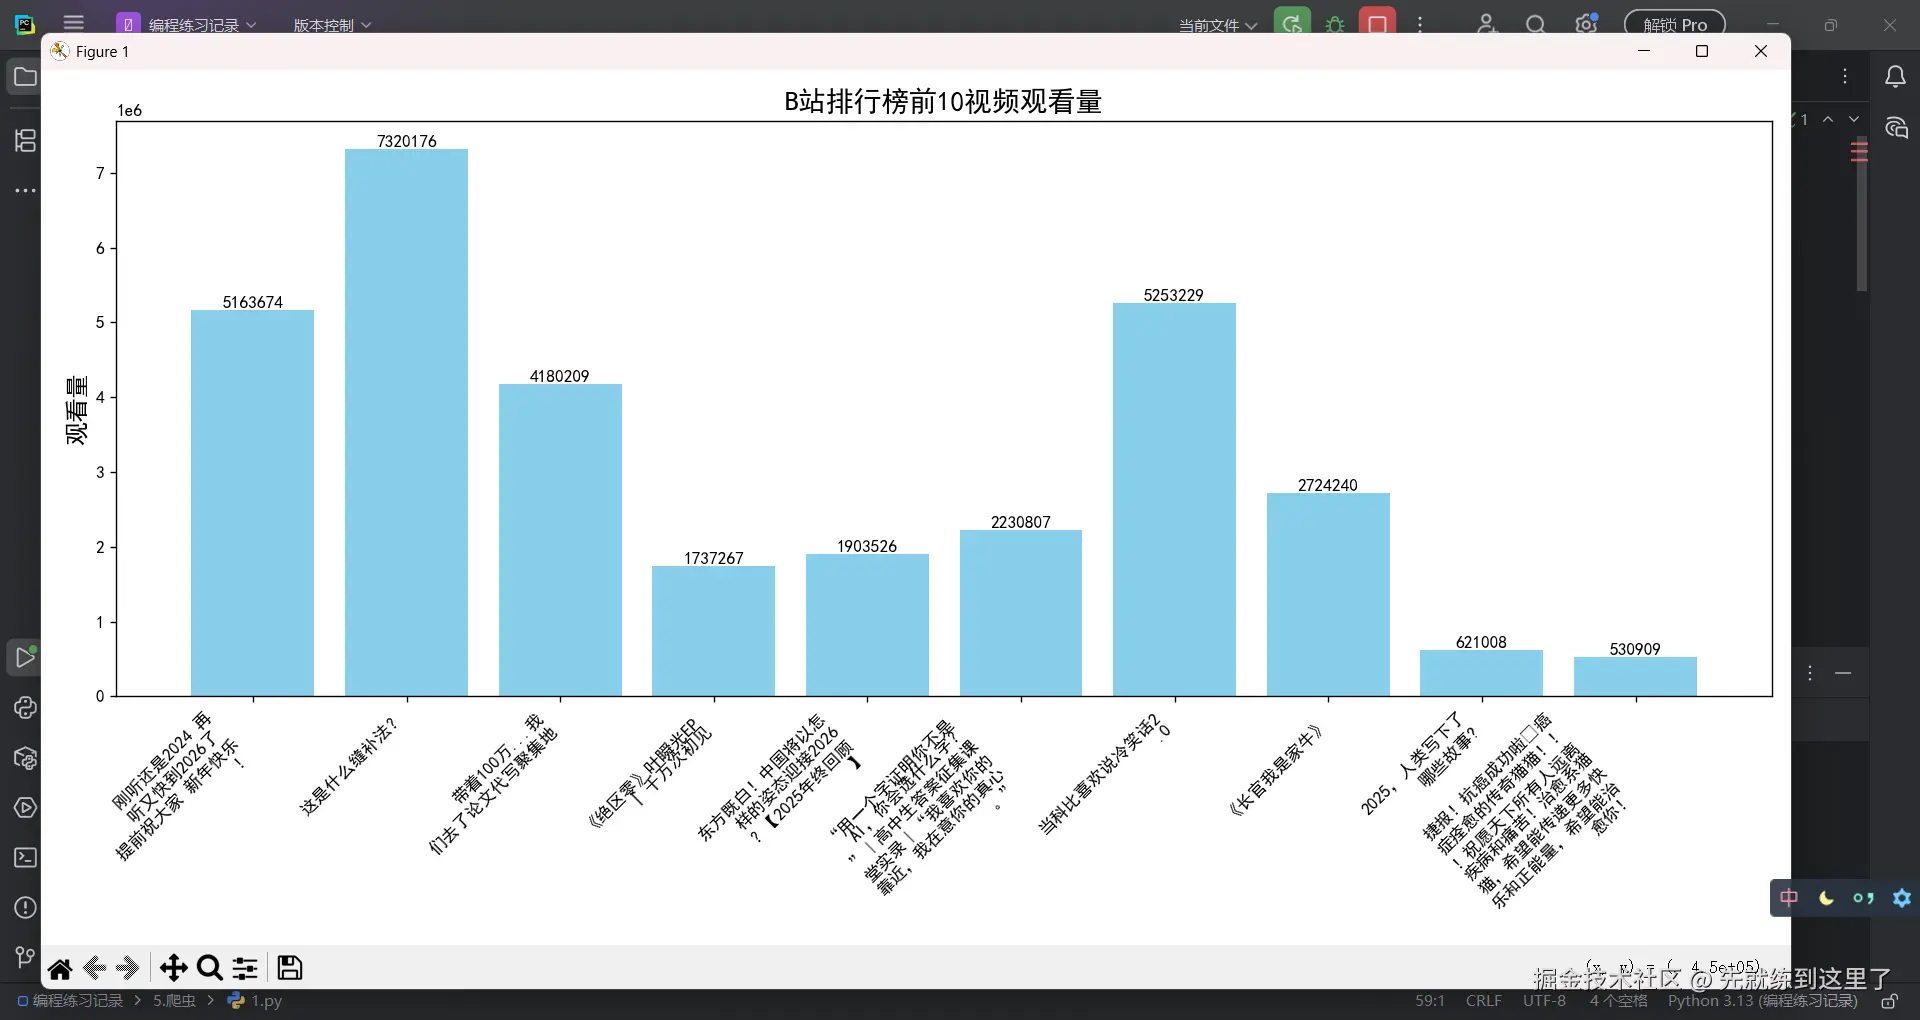
def plot_ranking(df):
plt.figure(figsize=(14, 7))
x = range(len(df['title']))
bars = plt.bar(x, df['views'], color='#A0A0A0', edgecolor='white', linewidth=0.8)
titles = ['\n'.join([t[i:i+10] for i in range(0, len(t), 10)]) for t in df['title']]
plt.xticks(x, titles, rotation=45, ha='right', fontsize=12, color='white')
plt.title("B站排行榜前10视频观看量", fontsize=18, color='white', pad=20)
plt.ylabel("观看量", fontsize=14, color='white')
plt.yticks(color='white', fontsize=12)
plt.grid(axis='y', linestyle='--', alpha=0.4)
for bar in bars:
height = bar.get_height()
plt.text(bar.get_x() + bar.get_width()/2, height + max(df['views'])*0.01,
f"{height:,}", ha='center', va='bottom', fontsize=10, color='white')
plt.tight_layout()
plt.show()
def data_analysis(df):
print("💡 数据分析功能占位,可拓展实现各种分析。")
def main():
while True:
df = fetch_bilibili_ranking()
if SAVE_EXCEL:
save_to_excel(df)
plot_ranking(df)
data_analysis(df)
if REFRESH_INTERVAL <= 0:
break
else:
print(f"⏰ 等待 {REFRESH_INTERVAL} 秒后刷新数据...")
time.sleep(REFRESH_INTERVAL)
if __name__ == "__main__":
main()