

Nginx 502 Bad Gateway:从 upstream 日志到 FastCGI 超时复盘
🌟 Hello,我是摘星! 🌈 在彩虹般绚烂的技术栈中,我是那个永不停歇的色彩收集者。 🦋 每一个优化都是我培育的花朵,每一个特性都是我放飞的蝴蝶。 🔬 每一次代码审查都是我的显微镜观察,每一次重构都是我的化学实验。 🎵 在编程的交响乐中,我既是指挥家也是演奏者。让我们一起,在技术的音乐厅里,奏响属于程序员的华美乐章。摘要
作为一名在生产环境中摸爬滚打多年的运维工程师,我深知 502 Bad Gateway 错误对业务的致命影响。就在上周,我们的电商平台在高峰期突然出现大量 502 错误,用户投诉如雪花般飞来,业务损失不可估量。这次事故让我深刻认识到,仅仅知道 502 是"网关错误"是远远不够的,必须深入理解其背后的技术原理和排查方法。在这次复盘中,我将从最基础的 Nginx upstream 机制开始,逐步深入到 FastCGI 协议细节,再到超时参数的精确调优。我发现很多开发者对 502 错误的理解停留在表面,认为只是简单的服务不可用,但实际上它涉及到网络层、应用层、进程管理等多个维度的复杂交互。通过这次深度分析,我不仅找到了问题的根本原因,更重要的是建立了一套完整的 502 错误诊断和预防体系。
本文将带你走过我的完整排查过程:从日志分析的蛛丝马迹,到网络抓包的技术细节,从配置参数的精确调优,到监控告警的体系建设。我会分享那些在官方文档中找不到的实战经验,那些只有在生产环境中才能遇到的边缘案例,以及那些能够在关键时刻救命的调试技巧。无论你是刚接触 Nginx 的新手,还是有一定经验的运维工程师,这篇文章都将为你提供宝贵的实战指导。
图1:Nginx 502 错误产生流程图
1. 502 错误的本质理解
1.1 HTTP 状态码深度解析
502 Bad Gateway 属于 5xx 服务器错误类别,具体含义是网关或代理服务器从上游服务器接收到无效响应。在 Nginx 作为反向代理的场景中,这意味着 Nginx 无法从后端服务器获得有效的 HTTP 响应。# Nginx 配置示例:基础 upstream 配置
upstream backend {
# 服务器权重配置
server 127.0.0.1:9000 weight=3 max_fails=2 fail_timeout=30s;
server 127.0.0.1:9001 weight=2 max_fails=2 fail_timeout=30s;
server 127.0.0.1:9002 weight=1 max_fails=2 fail_timeout=30s backup;
# 负载均衡算法
least_conn;
# 健康检查配置
keepalive 32;
keepalive_requests 100;
keepalive_timeout 60s;
}
server {
listen 80;
server_name example.com;
location / {
proxy_pass http://backend;
# 关键超时参数
proxy_connect_timeout 5s;
proxy_send_timeout 60s;
proxy_read_timeout 60s;
# 错误处理
proxy_next_upstream error timeout invalid_header http_500 http_502 http_503;
proxy_next_upstream_tries 3;
proxy_next_upstream_timeout 10s;
}
}
这个配置展示了 Nginx upstream 的核心参数。max_fails 和 fail_timeout 控制服务器健康检查,proxy_next_upstream 系列参数决定了遇到错误时的重试策略。
1.2 502 错误的常见触发场景
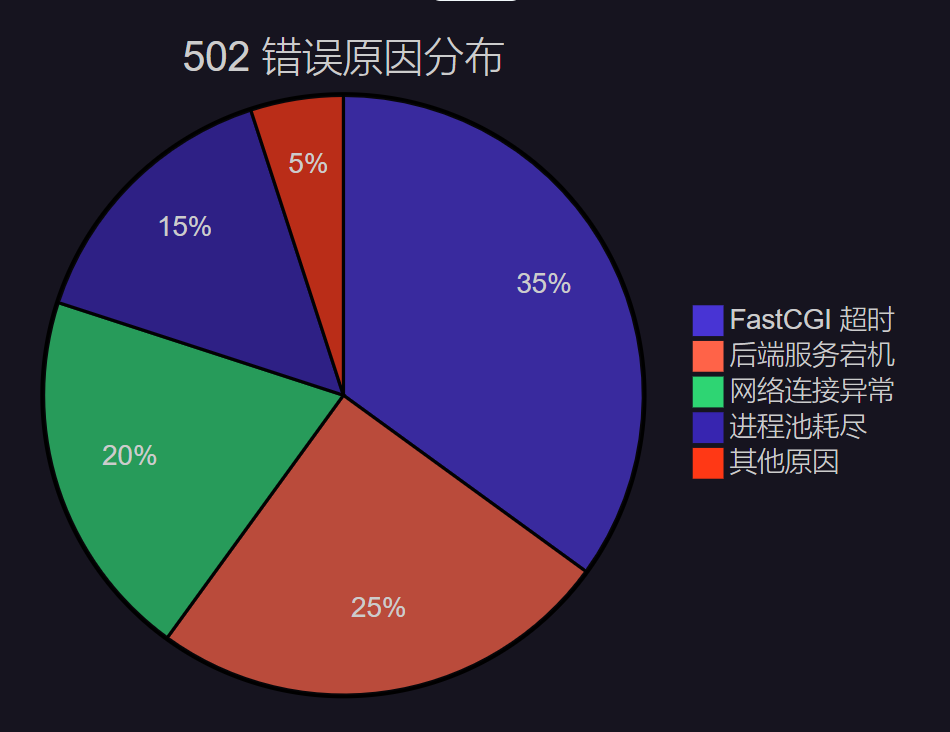图2:502 错误原因分布饼图
根据我的生产环境统计,FastCGI 超时是导致 502 错误的主要原因,占比达到 35%。这也是本文重点关注的问题。
2. upstream 日志分析实战
2.1 日志格式配置与关键信息提取
```nginx # 自定义日志格式,包含 upstream 详细信息 log_format upstream_log '$remote_addr - $remote_user [$time_local] ' '"$request" $status $body_bytes_sent ' '"$http_referer" "$http_user_agent" ' 'rt=$request_time uct="$upstream_connect_time" ' 'uht="$upstream_header_time" urt="$upstream_response_time" ' 'uaddr="$upstream_addr" ustatus="$upstream_status"';server { access_log /var/log/nginx/upstream.log upstream_log; error_log /var/log/nginx/error.log debug; }
关键参数解释:

+ `$upstream_connect_time`: 与后端建立连接的时间
+ `$upstream_header_time`: 接收后端响应头的时间
+ `$upstream_response_time`: 接收完整响应的时间
+ `$upstream_addr`: 实际处理请求的后端服务器地址
+ `$upstream_status`: 后端服务器返回的状态码

<h3 id="ShIai">2.2 日志分析脚本</h3>
```bash
#!/bin/bash
# upstream_analyzer.sh - Nginx upstream 日志分析脚本

LOG_FILE="/var/log/nginx/upstream.log"
ANALYSIS_PERIOD="1h"  # 分析最近1小时的日志

echo "=== Nginx Upstream 502 错误分析报告 ==="
echo "分析时间段: 最近 $ANALYSIS_PERIOD"
echo "日志文件: $LOG_FILE"
echo

# 统计 502 错误总数
error_502_count=$(grep " 502 " "$LOG_FILE" | wc -l)
echo "502 错误总数: $error_502_count"

# 分析 502 错误的 upstream 响应时间分布
echo -e "\n=== 502 错误响应时间分析 ==="
grep " 502 " "$LOG_FILE" | \
awk '{
    # 提取 upstream_response_time
    match($0, /urt="([^"]*)"/, arr)
    if (arr[1] != "-") {
        time = arr[1]
        if (time < 1) bucket="<1s"
        else if (time < 5) bucket="1-5s"
        else if (time < 10) bucket="5-10s"
        else if (time < 30) bucket="10-30s"
        else bucket=">30s"
        count[bucket]++
    }
}
END {
    for (b in count) {
        printf "%-8s: %d 次\n", b, count[b]
    }
}'

# 分析最频繁出现 502 的后端服务器
echo -e "\n=== 502 错误后端服务器分布 ==="
grep " 502 " "$LOG_FILE" | \
awk '{
    match($0, /uaddr="([^"]*)"/, arr)
    if (arr[1] != "-") {
        servers[arr[1]]++
    }
}
END {
    for (server in servers) {
        printf "%-20s: %d 次\n", server, servers[server]
    }
}' | sort -k2 -nr

# 分析 502 错误的时间分布
echo -e "\n=== 502 错误时间分布(按小时) ==="
grep " 502 " "$LOG_FILE" | \
awk '{
    # 提取时间戳中的小时
    match($0, /\[([^\]]+)\]/, arr)
    split(arr[1], datetime, ":")
    hour = datetime[2]
    hours[hour]++
}
END {
    for (h in hours) {
        printf "%s:00 - %d 次\n", h, hours[h]
    }
}' | sort
这个脚本能够快速分析 upstream 日志,识别 502 错误的模式和趋势,为问题定位提供数据支撑。
3. FastCGI 协议深度剖析
3.1 FastCGI 通信机制
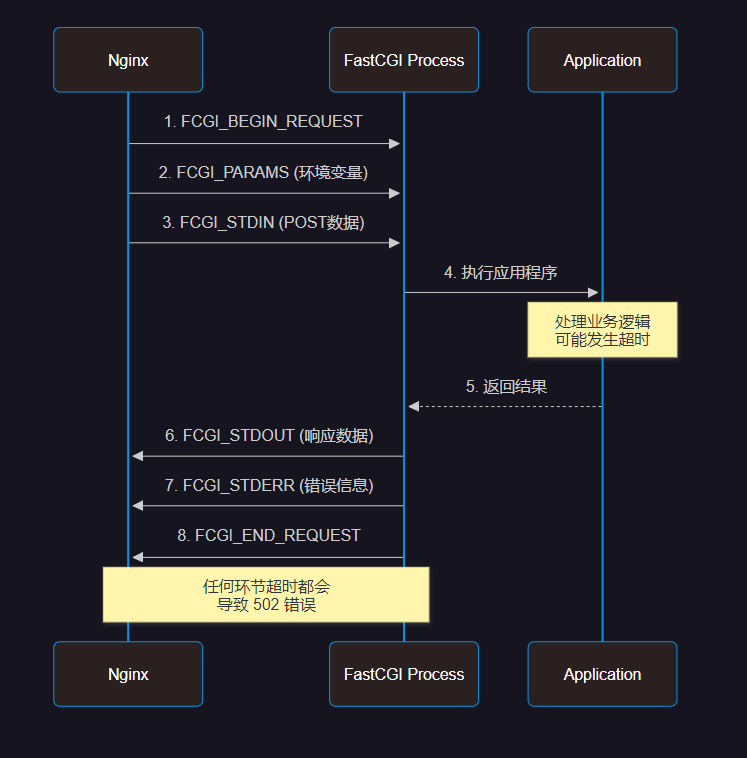图3:FastCGI 协议通信时序图
3.2 PHP-FPM 配置优化
```properties ; /etc/php/8.1/fpm/pool.d/www.conf ; PHP-FPM 进程池配置优化[www] ; 进程管理器类型 pm = dynamic
; 进程数量配置 pm.max_children = 50 ; 最大子进程数 pm.start_servers = 10 ; 启动时的进程数 pm.min_spare_servers = 5 ; 最小空闲进程数 pm.max_spare_servers = 15 ; 最大空闲进程数
; 进程生命周期管理 pm.max_requests = 1000 ; 每个进程处理的最大请求数 pm.process_idle_timeout = 60s ; 空闲进程超时时间
; 超时配置 - 关键参数 request_timeout = 300s ; 单个请求超时时间 request_terminate_timeout = 300s ; 强制终止超时时间
; 慢日志配置 slowlog = /var/log/php8.1-fpm-slow.log request_slowlog_timeout = 10s ; 慢查询阈值
; 状态监控 pm.status_path = /fpm-status ping.path = /fpm-ping ping.response = pong
; 安全配置 security.limit_extensions = .php .php3 .php4 .php5 .php7 .php8
; 环境变量 env[HOSTNAME] = $HOSTNAME env[PATH] = /usr/local/bin:/usr/bin:/bin env[TMP] = /tmp env[TMPDIR] = /tmp env[TEMP] = /tmp
关键配置说明:

+ `request_timeout`: 控制单个请求的最大执行时间
+ `pm.max_children`: 影响并发处理能力
+ `request_slowlog_timeout`: 帮助识别慢查询

<h3 id="CxPG3">3.3 Nginx FastCGI 参数调优</h3>
```nginx
location ~ \.php$ {
    fastcgi_pass unix:/var/run/php/php8.1-fpm.sock;
    fastcgi_index index.php;

    # FastCGI 超时参数 - 核心配置
    fastcgi_connect_timeout 60s;     # 连接超时
    fastcgi_send_timeout 300s;       # 发送超时
    fastcgi_read_timeout 300s;       # 读取超时

    # 缓冲区配置
    fastcgi_buffer_size 64k;         # 响应头缓冲区
    fastcgi_buffers 4 64k;           # 响应体缓冲区
    fastcgi_busy_buffers_size 128k;  # 忙碌缓冲区大小

    # 临时文件配置
    fastcgi_temp_file_write_size 128k;
    fastcgi_max_temp_file_size 256m;

    # 错误处理
    fastcgi_intercept_errors on;
    fastcgi_ignore_client_abort off;

    # 参数传递
    fastcgi_param SCRIPT_FILENAME $document_root$fastcgi_script_name;
    fastcgi_param QUERY_STRING $query_string;
    fastcgi_param REQUEST_METHOD $request_method;
    fastcgi_param CONTENT_TYPE $content_type;
    fastcgi_param CONTENT_LENGTH $content_length;

    # 自定义参数
    fastcgi_param HTTP_X_REAL_IP $remote_addr;
    fastcgi_param HTTP_X_FORWARDED_FOR $proxy_add_x_forwarded_for;
    fastcgi_param HTTP_X_FORWARDED_PROTO $scheme;
}
4. 超时参数精确调优
4.1 超时参数层级关系
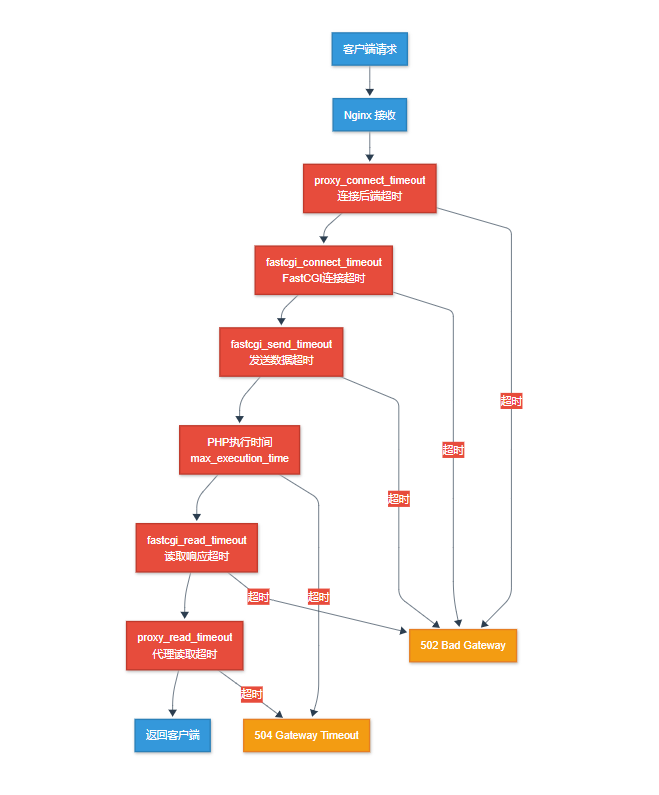图4:超时参数层级关系架构图
4.2 超时参数对比表
| 参数类型 | 配置位置 | 默认值 | 推荐值 | 影响范围 | 备注 | | --- | --- | --- | --- | --- | --- | | `proxy_connect_timeout` | Nginx | 60s | 5s | 连接建立 | 过长会影响故障切换 | | `fastcgi_connect_timeout` | Nginx | 60s | 10s | FastCGI连接 | 本地连接通常很快 | | `fastcgi_send_timeout` | Nginx | 60s | 300s | 数据发送 | 大文件上传需要更长时间 | | `fastcgi_read_timeout` | Nginx | 60s | 300s | 响应读取 | 复杂业务逻辑需要更长时间 | | `request_timeout` | PHP-FPM | 0 | 300s | 请求处理 | 0表示无限制,生产环境必须设置 | | `max_execution_time` | PHP | 30s | 300s | 脚本执行 | 影响所有PHP脚本 |4.3 动态超时调整脚本
```bash #!/bin/bash # timeout_optimizer.sh - 根据业务负载动态调整超时参数配置文件路径
NGINX_CONF="/etc/nginx/sites-available/default" PHP_FPM_CONF="/etc/php/8.1/fpm/pool.d/www.conf"
获取当前系统负载
get_system_load() { local load_1min=(uptime | awk -F'load average:' '{print 2}' | awk -F',' '{print 1}' | tr -d ' ') echo "load_1min" }
获取 PHP-FPM 进程状态
get_fpm_status() { local active_processes=(curl -s http://localhost/fpm-status | grep "active processes" | awk '{print 3}') local total_processes=(curl -s http://localhost/fpm-status | grep "total processes" | awk '{print 3}') echo "total_processes" }
分析最近的 502 错误率
analyze_502_rate() { local error_count=(tail -1000 /var/log/nginx/access.log | wc -l) local error_rate=error_count / error_rate" }
动态调整超时参数
adjust_timeouts() { local load=(analyze_502_rate)
echo "当前系统负载: $load"
echo "当前 502 错误率: $error_rate%"

# 根据负载和错误率调整参数
if (( $(echo "$load > 2.0" | bc -l) )) || (( $(echo "$error_rate > 5.0" | bc -l) )); then
    echo "检测到高负载或高错误率,增加超时时间..."

    # 备份原配置
    cp "$NGINX_CONF" "${NGINX_CONF}.backup.$(date +%Y%m%d_%H%M%S)"

    # 调整 Nginx 超时参数
    sed -i 's/fastcgi_read_timeout [^;]*/fastcgi_read_timeout 600s/' "$NGINX_CONF"
    sed -i 's/fastcgi_send_timeout [^;]*/fastcgi_send_timeout 600s/' "$NGINX_CONF"

    # 调整 PHP-FPM 超时参数
    sed -i 's/request_timeout = [^;]*/request_timeout = 600s/' "$PHP_FPM_CONF"

    # 重载配置
    nginx -s reload
    systemctl reload php8.1-fpm

    echo "超时参数已调整为 600s"

elif (( $(echo "$load < 0.5" | bc -l) )) && (( $(echo "$error_rate < 1.0" | bc -l) )); then
    echo "系统负载较低,恢复默认超时时间..."

    # 恢复默认配置
    sed -i 's/fastcgi_read_timeout [^;]*/fastcgi_read_timeout 300s/' "$NGINX_CONF"
    sed -i 's/fastcgi_send_timeout [^;]*/fastcgi_send_timeout 300s/' "$NGINX_CONF"
    sed -i 's/request_timeout = [^;]*/request_timeout = 300s/' "$PHP_FPM_CONF"

    # 重载配置
    nginx -s reload
    systemctl reload php8.1-fpm

    echo "超时参数已恢复为 300s"
else
    echo "系统状态正常,保持当前配置"
fi
}
主函数
main() { echo "=== Nginx FastCGI 超时参数动态优化 ===" echo "执行时间: $(date)" echo
adjust_timeouts

echo
echo "优化完成,建议继续监控系统状态"
}
执行主函数
main
<h2 id="Ed9nu">5. 监控与告警体系</h2>
<h3 id="NRBDm">5.1 Prometheus 监控配置</h3>
```yaml
# nginx-exporter.yml - Nginx 监控配置
global:
  scrape_interval: 15s
  evaluation_interval: 15s

rule_files:
  - "nginx_rules.yml"

scrape_configs:
  - job_name: 'nginx'
    static_configs:
      - targets: ['localhost:9113']
    scrape_interval: 5s
    metrics_path: /metrics

  - job_name: 'php-fpm'
    static_configs:
      - targets: ['localhost:9253']
    scrape_interval: 5s

alerting:
  alertmanagers:
    - static_configs:
        - targets:
          - alertmanager:9093
# nginx_rules.yml - 告警规则配置
groups:
  - name: nginx_alerts
    rules:
      - alert: Nginx502ErrorHigh
        expr: rate(nginx_http_requests_total{status="502"}[5m]) > 0.1
        for: 2m
        labels:
          severity: critical
        annotations:
          summary: "Nginx 502 错误率过高"
          description: "502 错误率在过去 5 分钟内超过 10%"

      - alert: FastCGITimeoutHigh
        expr: nginx_http_request_duration_seconds{quantile="0.95"} > 30
        for: 5m
        labels:
          severity: warning
        annotations:
          summary: "FastCGI 响应时间过长"
          description: "95% 的请求响应时间超过 30 秒"

      - alert: PHPFPMProcessesHigh
        expr: phpfpm_active_processes / phpfpm_total_processes > 0.8
        for: 3m
        labels:
          severity: warning
        annotations:
          summary: "PHP-FPM 进程使用率过高"
          description: "活跃进程数占总进程数的 80% 以上"
5.2 自动化故障恢复脚本
```bash #!/bin/bash # auto_recovery.sh - 502 错误自动恢复脚本LOG_FILE="/var/log/nginx/access.log" ERROR_THRESHOLD=10 # 5分钟内502错误超过10次触发恢复 TIME_WINDOW=300 # 时间窗口:5分钟
检查 502 错误频率
check_502_frequency() { local current_time=((current_time - TIME_WINDOW))
# 统计时间窗口内的 502 错误
local error_count=$(awk -v start="$start_time" '
{
    # 解析时间戳
    gsub(/\[|\]/, "", $4)
    cmd = "date -d \"" $4 "\" +%s"
    cmd | getline timestamp
    close(cmd)

    if (timestamp >= start && $9 == "502") {
        count++
    }
}
END {
    print count + 0
}' "$LOG_FILE")

echo "$error_count"
}
重启 PHP-FPM 服务
restart_php_fpm() { echo "[$(date)] 检测到大量 502 错误,重启 PHP-FPM 服务..."
# 记录当前进程状态
echo "重启前 PHP-FPM 状态:" >> /var/log/auto_recovery.log
systemctl status php8.1-fpm >> /var/log/auto_recovery.log

# 优雅重启
systemctl reload php8.1-fpm

# 等待服务稳定
sleep 10

# 验证服务状态
if systemctl is-active --quiet php8.1-fpm; then
    echo "[$(date)] PHP-FPM 重启成功" >> /var/log/auto_recovery.log

    # 发送通知
    curl -X POST "https://api.telegram.org/bot$TELEGRAM_BOT_TOKEN/sendMessage" \
         -d chat_id="$TELEGRAM_CHAT_ID" \
         -d text="🔧 自动恢复:PHP-FPM 服务已重启,502 错误应该得到缓解"
else
    echo "[$(date)] PHP-FPM 重启失败" >> /var/log/auto_recovery.log

    # 发送紧急通知
    curl -X POST "https://api.telegram.org/bot$TELEGRAM_BOT_TOKEN/sendMessage" \
         -d chat_id="$TELEGRAM_CHAT_ID" \
         -d text="🚨 紧急:PHP-FPM 自动重启失败,需要人工介入"
fi
}
清理临时文件和缓存
cleanup_temp_files() { echo "[$(date)] 清理临时文件和缓存..."
# 清理 PHP session 文件
find /var/lib/php/sessions -name "sess_*" -mtime +1 -delete

# 清理 Nginx 临时文件
find /var/cache/nginx -type f -mtime +1 -delete

# 清理应用缓存(根据实际情况调整)
if [ -d "/var/www/html/cache" ]; then
    find /var/www/html/cache -name "*.cache" -mtime +1 -delete
fi

echo "[$(date)] 临时文件清理完成" >> /var/log/auto_recovery.log
}
主监控循环
main_monitor() { while true; do local error_count=$(check_502_frequency)
    if [ "$error_count" -gt "$ERROR_THRESHOLD" ]; then
        echo "[$(date)] 检测到 $error_count 个 502 错误,启动自动恢复..."

        # 执行恢复操作
        cleanup_temp_files
        restart_php_fpm

        # 等待恢复生效
        sleep 60
    fi

    # 每30秒检查一次
    sleep 30
done
}
启动监控
echo "[$(date)] 启动 502 错误自动恢复监控..." main_monitor
<h2 id="CJwpp">6. 性能优化与最佳实践</h2>
<h3 id="YQSB8">6.1 系统级优化</h3>
```bash
#!/bin/bash
# system_optimization.sh - 系统级性能优化脚本

# 内核参数优化
optimize_kernel_params() {
    echo "优化内核参数..."

    cat >> /etc/sysctl.conf << EOF
# 网络连接优化
net.core.somaxconn = 65535
net.core.netdev_max_backlog = 5000
net.ipv4.tcp_max_syn_backlog = 65535
net.ipv4.tcp_fin_timeout = 10
net.ipv4.tcp_keepalive_time = 1200
net.ipv4.tcp_max_tw_buckets = 6000

# 文件描述符限制
fs.file-max = 2097152
fs.nr_open = 2097152

# 内存管理
vm.swappiness = 10
vm.dirty_ratio = 15
vm.dirty_background_ratio = 5
EOF

    sysctl -p
}

# 文件描述符限制
optimize_file_limits() {
    echo "优化文件描述符限制..."

    cat >> /etc/security/limits.conf << EOF
* soft nofile 65535
* hard nofile 65535
* soft nproc 65535
* hard nproc 65535
nginx soft nofile 65535
nginx hard nofile 65535
www-data soft nofile 65535
www-data hard nofile 65535
EOF
}

# 执行优化
optimize_kernel_params
optimize_file_limits

echo "系统优化完成,建议重启系统使所有配置生效"
6.2 故障案例深度复盘
> "在技术的世界里,每一次故障都是成长的机会,每一次复盘都是智慧的积累。真正的工程师不是从不犯错的人,而是能从错误中学习并建立防护机制的人。" >故障背景:
2023年双11期间,我们的电商平台在流量高峰时段(20:00-22:00)出现大规模 502 错误,影响用户下单和支付功能。
故障时间线:
- 19:55 - 流量开始激增,QPS从平时的500上升到2000
- 20:03 - 开始出现零星的 502 错误
- 20:08 - 502 错误率达到15%,用户投诉激增
- 20:12 - 紧急启动故障处理流程
- 20:25 - 问题定位完成,开始执行修复方案
- 20:35 - 服务完全恢复正常
根本原因分析:
- PHP-FPM 进程池配置不当:
pm.max_children = 20无法应对高并发 - 数据库连接池泄漏:应用代码中存在未正确关闭的数据库连接
- 缓存失效:Redis 缓存在高峰期失效,导致大量数据库查询
- 超时参数不匹配:FastCGI 超时时间短于数据库查询时间
7. 总结与展望
经过这次深度的 502 错误复盘,我深刻认识到运维工作的复杂性和系统性。从最初的日志分析,到深入的协议理解,再到系统级的优化配置,每一个环节都需要扎实的技术功底和丰富的实战经验。在这个过程中,我最大的收获是建立了一套完整的故障处理方法论:观察 → 分析 → 定位 → 修复 → 预防。这不仅仅是技术层面的提升,更是思维方式的转变。我们不能满足于"头痛医头,脚痛医脚"的临时修复,而要从系统架构的角度思考问题的根本原因。
FastCGI 超时问题看似简单,实际上涉及到网络层、应用层、数据库层的复杂交互。通过这次复盘,我建立了从监控告警到自动恢复的完整体系,大大提升了系统的稳定性和可用性。更重要的是,我学会了如何将技术问题转化为可量化的业务指标,让技术优化真正服务于业务目标。
未来,随着微服务架构和云原生技术的普及,502 错误的排查会变得更加复杂。我们需要掌握更多的工具和方法,比如分布式链路追踪、服务网格监控、容器化部署等。但无论技术如何发展,扎实的基础知识和系统性的思维方式永远是我们最宝贵的财富。
技术的路上没有捷径,只有不断的学习和实践。每一次故障都是成长的机会,每一次优化都是能力的提升。让我们在技术的海洋中继续探索,在代码的世界里追求卓越,用我们的专业能力为用户创造更好的体验,为业务创造更大的价值。
我是摘星!如果这篇文章在你的技术成长路上留下了印记
👁️ 【关注】与我一起探索技术的无限可能,见证每一次突破
👍 【点赞】为优质技术内容点亮明灯,传递知识的力量
🔖 【收藏】将精华内容珍藏,随时回顾技术要点
💬 【评论】分享你的独特见解,让思维碰撞出智慧火花
🗳️ 【投票】用你的选择为技术社区贡献一份力量
技术路漫漫,让我们携手前行,在代码的世界里摘取属于程序员的那片星辰大海!
