

一、创建文件
# 首先导入pandas
import pandas as pd

# 创建DataFrame
df=pd.DataFrame() # 此时创建的是个空文件,无数据
# 调用to_excel并给它一个路径
df.to_excel('C:\\Temp\\output.xlsx')
print('Done!')
# 此时output文件就被创建到文件夹中了
如果想要在创建的同时给文件数据:
df=pd.DataFrame({'ID':[1,2,3],'Name':['iop','qwe','wer']})
最前面一列是自动索引,如果想要把ID当作索引:
df=pd.DataFrame({'ID':[1,2,3],'Name':['iop','qwe','wer']})
print(df) # 会在运行窗口输出数据表格
df=pd.DataFrame({'ID':[1,2,3],'Name':['iop','qwe','wer']})
df=df.set_index('ID') # set_index()会产生一个新的DataFrame,然后再赋给df
print(df)
df=pd.DataFrame({'ID':[1,2,3],'Name':['iop','qwe','wer']})
df=df.set_index('ID')
df.to_excel('C:\\Temp\\output.xlsx')
print('Done!')
成功了!
二、读取文件
2.1 导入文件及打印相关信息
import pandas as pd

# 导入文件地址
people=pd.read_excel('C:\\Temp\\people.xlsx')
# 打印输出表格行列数据
print(people.shape) # shape能告诉我们表格有多少行多少列  (行,列)
# 打印输出表格列名称
print(people.columns) # columns能告诉我们表格列的名称
# 打印输出表格的前几行
print(people.head()) # 通常情况下表格数据很多,都打印出来看不全,所以一般只打印表格的head部分
# 打印输出表格的后几行
print(people.tail()) # tail可以看表格的末尾几行
2.1.1 shape 行列数
print(people.shape) # shape能告诉我们表格有多少行多少列 (行,列)
2.1.2 columns 列名
print(people.columns) # columns能告诉我们表格列的名称
2.1.3 head 开头几行
print(people.head()) # 通常情况下表格数据很多,都打印出来看不全,所以一般只打印表格的head部分
只想看前3行:
print(people.head(3))
有时列的信息太多,只看前几行的时候也会隐藏一部分:
pd.options.display.max_columns=999 # 随便设置一个大的数字,可以让隐藏的信息都显示出来
2.1.4 tail 末尾几行
print(people.tail()) # tail可以看表格的末尾几行
2.2 常见问题情况
2.2.1 数据第1行是乱码
有时候表格数据第1行是错误的:
此时使用
columns读取出来的列名是错误的,因为列名不再在第1行
解决方法:
people=pd.read_excel('C:\\Temp\\people.xlsx',header=1) # header默认为0
在读取文件时将header值改为1
2.2.2 数据第1行是空白
有时候表格数据第1行是空的,数据错位:
此时就算不重新赋值header都能正确输出
解决方法: 不用管
2.2.3 文件就没有header
文件就没有列名,只有一堆数据:
此时使用
columns读取出来的列名是错误的
解决方法:
people=pd.read_excel('C:\\Temp\\people.xlsx',header=None)
在读取文件时将header值设为None
人为设置一个header:
people=pd.read_excel('C:\\Temp\\people.xlsx',header=None)
people.columns=['ID','Type','FirstName','MiddleName','LastName']
# 将其放入表格
people.to_excel('C:\\Temp\\people.xlsx')
2.2.4 索引又出来了!
- 方法一:
set_index
people=people.set_index('ID')
- 方法二:
inplace
people.set_index('ID',inplace=True) # 直接在DataFrame上面改,不生成新的
- 方法三:
inplace
people=pd.read_excel('C:\\Temp\\people.xlsx',index_col='ID') # 在读取文件时就修改
三、行、列、单元格
3.1 创建序列的三种方法
import pandas as pd

d={'x':100,'y':200,'z':300}
s1=pd.Series(d) # 把字典的key转化为s1的index,把value转化为data
print(s1.index) # Index(['x', 'y', 'z'], dtype='object')
print(s1)
import pandas as pd

L1=[100,200,300]
L2=['x','y','z']
s1=pd.Series(L1,index=L2)
print(s1)
import pandas as pd

s1=pd.Series([100,200,300],index=['x','y','z'])
print(s1)
3.2 以列的形式加入
import pandas as pd

s1=pd.Series([1,2,3],index=[1,2,3],name='A') # 把s1当作一列加入DataFrame,index为行号
s2=pd.Series([10,20,30],index=[1,2,3],name='B')
s3=pd.Series([100,200,300],index=[1,2,3],name='C')

# 如果想要作为列加入,需要使用字典的形式加入
df=pd.DataFrame({s1.name:s1,s2.name:s2,s3.name:s3})
print(df)
3.3 以行的形式加入
import pandas as pd

s1=pd.Series([1,2,3],index=[1,2,3],name='A') # 把s1当作一列加入DataFrame,index为行号
s2=pd.Series([10,20,30],index=[1,2,3],name='B')
s3=pd.Series([100,200,300],index=[1,2,3],name='C')

# 如果想要作为行加入,需要使用列表的形式加入
df=pd.DataFrame([s1,s2,s3]) # 把name看作行号,把每个列表看作一行
print(df)
3.4 对齐
对齐的原理是根据index,相同的对齐
当把s3的index改为[2,3,4]:
import pandas as pd

s1=pd.Series([1,2,3],index=[1,2,3],name='A')
s2=pd.Series([10,20,30],index=[1,2,3],name='B')
s3=pd.Series([100,200,300],index=[2,3,4],name='C')

# 对齐的原理是根据index,相同的对齐
df=pd.DataFrame({s1.name:s1,s2.name:s2,s3.name:s3})
print(df)
四、数据区域读取填充数字
已知有一个这样的文件:
此时打印表格,无法自动跳过前面的空行和空列:
import pandas as pd

books=pd.read_excel('C:\\Temp\\books.xlsx')
print(books)
- 使用
skiprows跳过空行:skiprows=3 - 使用
usecols指定要看的列:usecols=C,D,E,F或usecols=C:F
import pandas as pd

books=pd.read_excel('C:\\Temp\\books.xlsx',skiprows=3,usecols='C:F')
print(books)
- 使用
at给ID列索引为0处赋值为100
books['ID'].at[0]=100
- 使用
for循环给ID赋值
for i in books.index:
    books['ID'].at[i]=i+1 # 因为索引index是从0开始的
    # books.at[i,'ID']=i+1 也可以
- 使用
dtype将ID数据类型改为str型(默认是float型)
books=pd.read_excel('C:\\Temp\\books.xlsx',skiprows=3,usecols='C:F',dtype={'ID':str})
- 使用
for循环给InStore交替赋值Yes和No
for i in books.index:
    books['InStore'].at[i]='Yes'if i%2==0 else 'No'
    # books.at[i,'InStore']='Yes'if i%2==0 else 'No' 也可以
完整代码:
import pandas as pd

books=pd.read_excel('C:\\Temp\\books.xlsx',skiprows=3,usecols='C:F',dtype={'ID':str})
for i in books.index:
    books['ID'].at[i]=i+1 # 因为索引index是从0开始的
    books['InStore'].at[i]='Yes'if i%2==0 else 'No'

print(books)
五、填充日期序列
- 导入日期模块并在
for循环中赋值
from datetime import date,timedelta # 导入日期

start=date(2019,1,1) # 设置初始日期
for i in books.index:
    books['Date'].at[i]=start # 将start赋值给Date
- 使用
timedelta和for循环实现日期变更
for i in books.index:
    books['Date'].at[i]=start+timedelta(days=i)
    # 在start日期的基础上加上i天,注意timedelta最多能以天为单位,不能加周、月、年等
加年:
for i in books.index:
    books['Date'].at[i]=date(start.year+i,start.month,start.day)
    # 相当于重新赋值
加月:
# 定义一个加月函数
def add_month(d,md):
    yd=md//12
    m=d.month+md%12
    if m!=12:
        yd+=m//12
        m=m%12
    return date(d.year+yd,m,d.day)

for i in books.index:
    books['Date'].at[i]=add_month(start,i)
    # books.at[i,'Date']=add_month(start,i) 也可以
完整代码:
import pandas as pd
from datetime import date,timedelta # 导入日期

# 定义一个加月函数
def add_month(d,md):
    yd=md//12
    m=d.month+md%12
    if m!=12:
        yd+=m//12
        m=m%12
    return date(d.year+yd,m,d.day)

books=pd.read_excel('C:\\Temp\\books.xlsx',skiprows=3,usecols='C:F',dtype={'ID':str})
start=date(2019,1,1)
for i in books.index:
    books['ID'].at[i]=i+1 # 因为索引index是从0开始的
    books['InStore'].at[i]='Yes'if i%2==0 else 'No'
    books['Date'].at[i]=add_month(start,i)

books.set_index('ID',inplace=True)
books.to_excel('C:\\Temp\\books.xlsx') # 将修改保存至文件
print('Done!')
六、函数填充、计算列
计算:
然后拖动右下角的填充(或者双击填充点),将Price列填满:
用 pandas 操作:
import pandas as pd

books=pd.read_excel('C:\Temp\books.xlsx',index_col='ID')
books['Price']=books['ListPrice']*books['Discount']

books.to_excel('C:\Temp\books.xlsx') # 将修改保存至文件
print('Done!')
也可以使用for循环
for i in books.index:
    books['Price'].at[i]=books['ListPrice'].at[i]*books['Discount'].at[i]
    # 这种方式常常用于不想从头到尾全部运算,而是只运算其中某一段
如:
for i in range(5,16):
    books['Price'].at[i]=books['ListPrice'].at[i]*books['Discount'].at[i]
给 Price 统一加2元:
方法一:直接+2
books['Price']=books['Price']+2
方法二:使用自定义函数
def add_2(x):
    return x+2
books['Price']=books['Price'].apply(add_2)
方法三:使用lambda匿名函数
books['Price']=books['Price'].apply(lambda x:x+2)
七、排序、多重排序
按照 Price 和 Worthy 排序:
用 pandas 操作:
- 使用
sort_values进行排序
products.sort_values(by='Price',inplace=True) # by根据什么排序(默认是升序),inplace=True就会在当前的进行排序,而不会生成一个新的
# 如果想要降序,即从大到小:将ascending设置为False
products.sort_values(by='Price',inplace=True,ascending=False)
products.sort_values(by=['Worthy','Price'],inplace=True,ascending=False) # 对字母是默认A-Z,如果没有ascending=False就会No在前,Yes在后
# 注意不能写多行sort_values,否则后面的会覆盖前面的,应该把多个排序因素写在一起
- 那么如何使价格按照大到小,价值按照Z-A呢?
products.sort_values(by=['Worthy','Price'],inplace=True,ascending=[True,False])
# 需要将ascending也分开写
完整代码:
import pandas as pd

products=pd.read_excel('C:\Temp\list.xlsx')
products=products.set_index('ID')

products.sort_values(by=['Worthy','Price'],inplace=True,ascending=[True,False])

products.to_excel('C:\Temp\list.xlsx')
print(products)
八、数据筛选、过滤
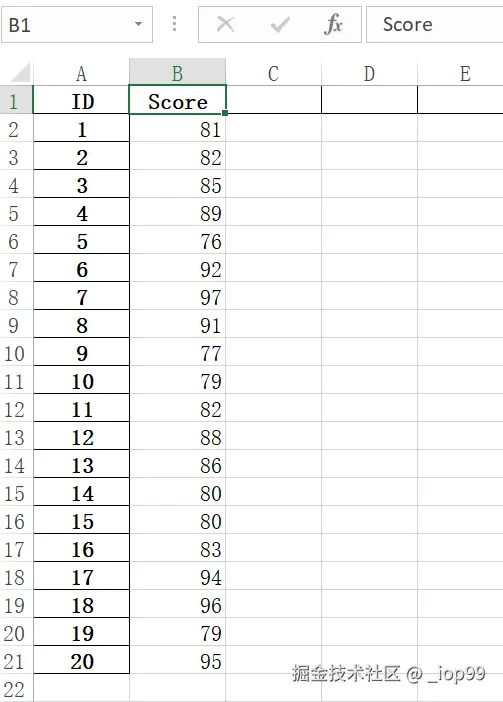
筛选出年龄在18-30岁,分数在85以上的学生:
用 pandas 操作:
- 先定义筛选函数
# 自定义筛选函数
def age_18_to_30(a):
    return 18<=a<=30

def level_A(s):
    return 85<=s<=100
- 使用
loc进行过滤
students=students.loc[students['Age'].apply(age_18_to_30)] # 使用这个函数过滤一遍Age数据
# students=students.loc[students.Age.apply(age_18_to_30)] 也可以
- 继续过滤
students=students.loc[students['Age'].apply(age_18_to_30)].loc[students['Score'].apply(level_A)]
# 注意是在后面接着写
完整代码:
import pandas as pd

def age_18_to_30(a):
    return 18<=a<=30

def level_A(s):
    return 85<=s<=100

students=pd.read_excel('C:\Temp\student.xlsx')
students=students.set_index('ID')

students=students.loc[students.Age.apply(age_18_to_30)].loc[students.Score.apply(level_A)]

students.to_excel('C:\Temp\student.xlsx')
print(students)
也可以使用lambda,就不用在前面定义筛选函数了:
import pandas as pd

students=pd.read_excel('C:\Temp\student.xlsx')
students=students.set_index('ID')

students=students.loc[students.Age.apply(lambda a:18<=a<=30)].loc[students.Score.apply(lambda s:85<=s<=100)]

print(students)
九、柱状图
并且从高到低排序:
9.1 基础柱状图
9.1.1 用 pandas 操作
- 引入
matplotlib
import matplotlib # 由于PyCharm内置的Matplotlib后端与我当前使用的Matplotlib版本不兼容,解决方法:切换Matplotlib后端(第1-2行)
matplotlib.use('TkAgg')  # 或 'Qt5Agg'
import matplotlib.pyplot as plt
- 使用
plot.bar制作柱状图
students.plot.bar(x='Field',y='Number') # x轴为Field,y轴为Number
plt.show() # 显示图像
完整代码:
import pandas as pd
import matplotlib # 由于PyCharm内置的Matplotlib后端与我当前使用的Matplotlib版本不兼容,解决方法:切换Matplotlib后端(第2-3行)
matplotlib.use('TkAgg')  # 或 'Qt5Agg'
import matplotlib.pyplot as plt

students=pd.read_excel('C:\Temp\student.xlsx')
students.plot.bar(x='Field',y='Number') # x轴为Field,y轴为Number
plt.show() # 显示图像
- 使用
sort_values进行排序,默认为升序,如果要降序就加上ascending=False
students.sort_values(by='Number',inplace=True)
- 发现x轴标签怎么都被截断了?
tight_layout()
plt.tight_layout() # 紧凑型布局
- 设置颜色
color和标题title
students.plot.bar(x='Field',y='Number',color='green',title='Students by Field')
完整代码:
import pandas as pd
import matplotlib # 由于PyCharm内置的Matplotlib后端与我当前使用的Matplotlib版本不兼容,解决方法:切换Matplotlib后端(第2-3行)
matplotlib.use('TkAgg')  # 或 'Qt5Agg'
import matplotlib.pyplot as plt

students=pd.read_excel('C:\Temp\student.xlsx')
students.sort_values(by='Number',inplace=True)
# students.plot.bar(x='Field',y='Number',color='green',title='Students by Field')
plt.bar(students.Field,students.Number,color='green')

plt.tight_layout() # 紧凑型布局
plt.show() # 显示图像
9.1.2 用 matplotlib 制作
plt.bar(students.Field,students.Number,color='green')
- 注意现在的标签是叠在一起的,可以使用
xticks让标签旋转一下
plt.xticks(students.Field,rotation=90) # 将标签旋转一下,旋转为90度
- 使用
xlabel和ylabel添加坐标轴标签
plt.xlabel('Field')
plt.ylabel('Number')
title设置图标标题
plt.title('Students bu Field',fontsize=16) # 字号为16
完整代码:
import pandas as pd
import matplotlib
matplotlib.use('TkAgg')
import matplotlib.pyplot as plt

students=pd.read_excel('C:\Temp\student.xlsx')
students.sort_values(by='Number',inplace=True)
plt.bar(students.Field,students.Number,color='green')
plt.xticks(students.Field,rotation=90)
plt.xlabel('Field')
plt.ylabel('Number')
plt.title('Student by Field',fontsize=16) # 字号16
plt.tight_layout()
plt.show()
9.2 分组柱图
- 用列表打印分组柱图
students.plot.bar(x='Field',y=[2021,2022],color=['green','orange'])
- 使用
sort_values进行排序
students.sort_values(by=2021,inplace=True,ascending=False) # 根据2021数据从大到小排序
- 设置标题并加粗
plt.title
plt.title('Student by Field',fontsize=16,fontweight='bold') # 16号字,加粗
- 将x轴坐标斜45度 调用
plt.gca()函数
# 优化轴部分
ax=plt.gca() # 调用函数,拿到当前的轴
ax.set_xticklabels(students['Field'],rotation=45,ha='right') # 重新铺一遍x轴上的文字  rotation角度,ha水平对齐
- 如果觉得图像外的空白太多了或太少了,想要调整 调用
plt.gcf()函数
f=plt.gcf() # 函数gcf(),拿到当前的图像
f.subplots_adjust(left=0.2,bottom=0.42) # 左边留出20%宽度,底部留出42%的宽度
完整代码:
import pandas as pd
import matplotlib
matplotlib.use('TkAgg')
import matplotlib.pyplot as plt

students=pd.read_excel('C:\Temp\student.xlsx')
students.sort_values(by=2021,inplace=True,ascending=False) # 根据2021数据从大到小排序
students.plot.bar(x='Field',y=[2021,2022],color=['green','orange'])
plt.title('Student by Field',fontsize=16,fontweight='bold') # 16号字,加粗
plt.xlabel('Field',fontweight='bold') # 坐标轴标题加粗
plt.ylabel('Number',fontweight='bold')
# 优化轴部分
ax=plt.gca() # 调用函数,拿到当前的轴
ax.set_xticklabels(students['Field'],rotation=45,ha='right') # 重新铺一遍x轴上的文字  rotation角度,ha水平对齐
f=plt.gcf() # 函数gcf(),拿到当前的图像
f.subplots_adjust(left=0.2,bottom=0.42) # 左边留出20%宽度,底部留出42%的宽度

plt.show() # 显示图像
9.3 叠加水平柱状图
- 首先在分组柱状图的基础上,使用
stacked让它们在同一柱展示(叠加柱状图)
users.plot.bar(x='Name',y=['Oct','Nov','Dec'],stacked=True)
- 按照总量排序
# 新建一列Total
users['Total']=users['Oct']+users['Nov']+users['Dec']
# 按照Total排序
users.sort_values(by='Total',inplace=True,ascending=False)
- 在打印图片时使用
plot.barh改为横版的
users.plot.barh(x='Name',y=['Oct','Nov','Dec'],stacked=True,title='User Behavior')
完整代码:
import pandas as pd
import matplotlib
matplotlib.use('TkAgg')
import matplotlib.pyplot as plt

users=pd.read_excel('C:\Temp\users.xlsx')
users['Total']=users['Oct']+users['Nov']+users['Dec'] # 新建一列Total
users.sort_values(by='Total',inplace=True,ascending=False) # 按照Total排序
users.plot.barh(x='Name',y=['Oct','Nov','Dec'],stacked=True,title='User Behavior')
plt.tight_layout()

plt.show()
十、饼图
注意:表格中年份的前面加个单引号告诉excel这不是数字而是字符串
- 使用
plot.pie()画饼图
students['2018'].plot.pie()
- 修改
index_col值
students=pd.read_excel('C:\Temp\students.xlsx',index_col='From')
- 使用
sort_values或counterclock将数据顺时针排列
students['2018'].sort_values(ascending=True).plot.pie(fontsize=8) # sort_values的ascending默认就是True,所以ascending=True可写可不写
students['2018'].plot.pie(fontsize=8,counterclock=False) # counterclock设置为False,变逆时针为顺时针
- 设置
startangle角度,让饼图起点从上面开始
students['2018'].sort_values(ascending=True).plot.pie(fontsize=8,startangle=-270)
完整代码:
import pandas as pd
import matplotlib
matplotlib.use('TkAgg')
import matplotlib.pyplot as plt

students=pd.read_excel('C:\Temp\students.xlsx',index_col='From')
students['2018'].plot.pie(fontsize=8,counterclock=False,startangle=-270)
plt.title('Source of International Students',fontsize=16,fontweight='bold') # 设置标题
plt.ylabel('2018',fontsize=14,fontweight='bold') # 重写y轴标题
plt.show()
十一、折线趋势图、叠加区域图
-
折线图:
-
叠加区域图:
11.1 折线图
plot画折线图
weeks.plot(y=['Accessories','Bikes','Clothing','Components']) # 如果只有一个,就是一条折线,如果有多个,就是多条折线
# 也可以给一列color来调整它们的颜色
- 使用
xlabel的.index修改x轴的间隔
plt.xlabel(weeks.index)
11.2 叠加区域图
- 想要画叠加区域图,只需要加上
.area
weeks.plot.area(y=['Accessories','Bikes','Clothing','Components'])
十二、散点图、直方图、密度图
- 散点图:
- 直方图:
- 密度图:
太多数据excel会承受不起
12.1 散点图
- 散点图
.plot.scatter
homes.plot.scatter(x='sqft_living',y='price')
完整代码:
import pandas as pd
import matplotlib
matplotlib.use('TkAgg')
import matplotlib.pyplot as plt

homes=pd.read_excel('C:\Temp\homes.xlsx')
homes.plot.scatter(x='sqft_living',y='price')

plt.show()
12.2 直方图
- 直方图
.plot.hist
homes.sqft_living.plot.hist() # x轴为sqft_living(房屋面积直方图)
- 太粗糙了?x轴分布区间使用
bins并赋值
homes.sqft_living.plot.hist(bins=100)
- 修改x轴刻度值:
xticks
plt.xticks(range(0,max(homes.sqft_living),500),fontsize=8,rotation=90) # 作用范围为0到x轴最大值;步长为500;字号为8号;倾斜角度90度
完整代码:
import pandas as pd
import matplotlib
matplotlib.use('TkAgg')
import matplotlib.pyplot as plt

homes=pd.read_excel('C:\Temp\homes.xlsx')
homes.sqft_living.plot.hist(bins=100)
plt.xticks(range(0,max(homes.sqft_living),500),fontsize=8,rotation=90)

plt.show()
12.3 密度图
- 密度图
.plot.kde
homes.sqft_living.plot.kde()
完整代码:
import pandas as pd
import matplotlib
matplotlib.use('TkAgg')
import matplotlib.pyplot as plt

homes=pd.read_excel('C:\Temp\homes.xlsx')
homes.sqft_living.plot.kde()
plt.xticks(range(0,max(homes.sqft_living),500),fontsize=8,rotation=90)

plt.show()
十三、数据相关性
- 使用
corr()打印两列两列之间的数据相关性
print(homes.corr())
十四、多表联合
已知两个表:
14.1 excel操作
-
在student表添加Score列;在其下第一个单元格使用
VLOOKUP函数:以A2(ID)为索引,查询score文件范围为A2-B21的值,输出所查询到单元格那一行的第2个值
-
再双击右下角进行自动填充
-
为什么21后的值明明查不到却还是被填充了呢?
因为VLOOKUP函数默认为近似填充
改为=VLOOKUP(A2,[score.xlsx]Sheet1!A2:B21,2,FALSE)
-
如果想要修改没有对应值时的填充:
=IFNA(VLOOKUP(A2,[score.xlsx]Sheet1!A2:B21,2,FALSE),0)
14.2 pandas操作
14.2.1 方法一:merge
table=students.merge(scores,on='ID')
# 此时如果有些数据联立不上就会被直接丢弃
注意: 匹配的关键是
on,此时两边列名都叫ID,所以只写一个on,如果两边不一样,则使用left_on、right_on
- 为什么表会这么短?其他没匹配上的数据呢?
how
table=students.merge(scores,how='left',on='ID')
# 使用how,意思是无论能否联立上,优先把左边那张表留下
- 修改匹配不上的数据的默认值
fillna()
table=students.merge(scores,how='left',on='ID').fillna(0)
# 可是变成浮点数了
- 将它们重新变成整数
table.Score=table.Score.astype(int)
完整代码:
import pandas as pd

students=pd.read_excel('C:\Temp\students.xlsx',index_col='ID')
scores=pd.read_excel('C:\Temp\score.xlsx',index_col='ID')
# 方法一:merge
table=students.merge(scores,how='left',left_on=students.index,right_on=scores.index).fillna(0)
table.Score=table.Score.astype(int)

print(table)
14.2.2 方法二:join
当使用
merge时,读取文件处有index_col且不写on,会报错students=pd.read_excel('C:\Temp\students.xlsx',index_col='ID') scores=pd.read_excel('C:\Temp\score.xlsx',index_col='ID') table=students.merge(scores,how='left').fillna(0) # pandas.errors.MergeError: No common columns to perform merge on. Merge options: left_on=None, right_on=None, left_index=False, right_index=False
- 此时如果使用
join方法,就不会报错
table=students.join(scores,how='left').fillna(0)
# 也可以写on,但是left_on和right_on已经无法识别了
完整代码:
import pandas as pd

students=pd.read_excel('C:\Temp\students.xlsx',index_col='ID')
scores=pd.read_excel('C:\Temp\score.xlsx',index_col='ID')
# 方法二:join
table=students.join(scores,how='left').fillna(0)
table.Score=table.Score.astype(int)

print(table)
十五、数据校验
pandas操作:
import pandas as pd

# 写一个校验函数
def score_valodation(row): # 选择try识别异常,出现异常则使用except抛出异常
    try:
        assert 0<=row.Score<=100
    except:
        print(f'{row.ID}\t号学生{row.Name}的成绩{row.Score}是错误的!') # 此处\t是制表符,为了让它们对齐,更美观

def score_valodation2(row): # 选择if循环判断是否符合条件
    if not 0<=row.Score<=100:
        print(f'{row.ID}\t号学生{row.Name}的成绩{row.Score}是错误的!')
# 两个函数都可以使用

students=pd.read_excel('C:\Temp\students.xlsx') # 当数据校验时最好不要特意设置index
students.apply(score_valodation,axis=1) # axis有两个值,0和1:0的含义是从上到下;1的含义是从左到右
# students.apply(score_valodation2,axis=1)
十六、把一列数据分割成两列
pandas操作:
- 使用
.str.split()进行分割
df=students['Full Name'].str.split() # 将Full Name下的str进行分割,并赋值给df  如:James Wilson --> [James, Wilson]
# 默认情况下split会把空格当作分隔符
# 默认情况下split会保留所有分割的字符串(n=0或1),如果设置了n值,则最多会切割n次
- 设置
expand值,将其直接分割为两列
df=students['Full Name'].str.split(expand=True) # expand默认是False,设置为True后会被直接分割为两列
- 把分好的两列加进文件
students['First Name']=df[0]
students['Last Name']=df[1]
完整代码:
import pandas as pd

students=pd.read_excel('C:\Temp\students.xlsx',index_col='ID')
# 将Full Name分割为两列
df=students['Full Name'].str.split(n=0,expand=True)
# 把分好的两列加进文件
students['First Name']=df[0]
students['Last Name']=df[1]

print(students)
十七、求和求平均统计引导
pandas操作:
- 从文件中拿到子集,方便后续操作
temp=students[['Test_1','Test_2','Test_3']] # 拿到文件的子集
- 使用
sum函数进行求和运算,因为默认运用于列,所以需要修改axis值
row_sum=temp.sum(axis=1) # 按行求总和
- 使用
mean函数进行求平均运算,因为默认运用于列,所以需要修改axis值
row_mean=temp.mean(axis=1) # 按行求平均
- 将平均值和总和并到文件中
students['Total']=row_sum
students['Average']=row_mean
- 拿到子集并求平均值
# 做一个班级情况汇总
col_mean=students[['Test_1','Test_2','Test_3','Total','Average']].mean()
- 使用
_append将其当作一行传入文件
students=students._append(col_mean,ignore_index=True)
# 因为append会生成一个新的DataFrame,所以赋值到students中
完整代码:
import pandas as pd

students=pd.read_excel('C:\Temp\students.xlsx',index_col='ID')
temp=students[['Test_1','Test_2','Test_3']] # 拿到文件的子集
row_sum=temp.sum(axis=1) # 按行求总和
row_mean=temp.mean(axis=1) # 按行求平均
# 将平均值和总和并到文件中
students['Total']=row_sum
students['Average']=row_mean
# 做一个班级的汇总
col_mean=students[['Test_1','Test_2','Test_3','Total','Average']].mean() # 拿到子集并求平均值
# 给这一行取个名字
col_mean['Name']='Summary'
# 使用append将其当作一行传入文件
students=students._append(col_mean,ignore_index=True) # 因为append会生成一个新的DataFrame,所以赋值到students中

print(students)
十八、定位、消除重复数据
pandas操作:
- 使用
drop_duplicates进行去重,筛选条件为subset
students.drop_duplicates(subset='Name',inplace=True)
# 根据Name进行重复筛选;如果多个筛选条件就给一个['Name','Age']
# 去除数据就在当前列进行去除,所以inplace=True
drop_duplicates的keep属性:有重复时保留哪一个
students.drop_duplicates(subset='Name',inplace=True,keep='first')
# 当有重复时保留第一个,默认就为first
- 使用
duplicated查看哪些行是重复的
# 找出哪些数据是重复的
dupe=students.duplicated(subset='Name')
# 查看文件中是否有重复数据
print(dupe.any()) # True
- 展示出重复的数据
iloc
# 怎么拿到重复的数据?
# 思路:根据duplicated拿到的结果为True的行的索引,然后把它们展示出来
dupe=dupe[dupe==True] # 过滤并重新赋值,就只剩下结果为True的值
print(students.iloc[dupe.index]) # iloc定位;根据dupe的索引在文件中进行定位,打印出被定位的值
完整代码:
import pandas as pd

students=pd.read_excel('C:\Temp\students.xlsx')

# 找出哪些数据是重复的
dupe=students.duplicated(subset='Name')
# 查看文件中是否有重复数据
print(dupe.any())

# 展示重复的数据
dupe=dupe[dupe==True]
print(students.iloc[dupe.index])

# 去掉重复数据
students.drop_duplicates(subset='Name',inplace=True,keep='last')
十九、行列转换
pandas操作:
- 使用
transpose()将表进行旋转
table=videos.transpose() # 旋转
完整代码:
import pandas as pd

pd.options.display_columns=999 # 全部显示,不省略
videos=pd.read_excel('C:\Temp\videos.xlsx',index_col='Month')
table=videos.transpose() # 旋转

print(table)
二十、读取CSV/TSV/TXT中的数据
从外部获取数据:
pandas操作:
- 使用
read_csv读取CSV、TSV、TXT文件
student1=pd.read_csv('C:\Temp\student.csv',index_col='ID') # 读取CSV

student2=pd.read_csv('C:\Temp\student.tsv',sep='\t',index_col='ID') # 读取TSV,sep表示用制表符对其进行分割

student3=pd.read_csv('C:\Temp\student.txt',sep='|',index_col='ID') # 读取TXT
完整代码:
import pandas as pd

student1=pd.read_csv('C:\Temp\student.csv',index_col='ID') # 读取CSV
student2=pd.read_csv('C:\Temp\student.tsv',sep='\t',index_col='ID') # 读取TSV,sep表示用制表符对其进行分割
student3=pd.read_csv('C:\Temp\student.txt',sep='|',index_col='ID') # 读取TXT
二十一、透视表、分组、聚合
- 使用pandas+faker生成一个商品销售表文件
import pandas as pd
from faker import Faker
import random

fake = Faker()

# 定义商品分类
categories = {
    "Tech": ["Electronics", "Gadgets"],
    "Fashion": ["Clothing", "Accessories"],
    "Sports": ["Footwear", "Fitness"],
    "Home": ["Kitchenware", "Furniture"]
}

# 生成100条数据
data = []
for id in range(1, 101):
    category = random.choice(list(categories.keys()))
    subcategory = random.choice(categories[category])
    product = fake.word().capitalize() + " " + fake.word().capitalize()
    date = fake.date_between(start_date='-1y', end_date='today')
    total = round(random.uniform(10, 200), 2)

    data.append([id, total, date, product, subcategory, category])

# 创建DataFrame并导出Excel
df = pd.DataFrame(data, columns=["ID", "Total", "Date", "Product", "Subcategory", "Category"])
df.to_excel("C:\Temp\sales_records.xlsx", index=False)
print("Excel文件已生成:sales_records.xlsx")
pandas操作:
- 制作透视表,方法一:
pivot_table
import numpy as np # 引包,为了能使用aggfunc聚合函数

pt1=orders.pivot_table(index='Category',columns='Year',values='Total',aggfunc=np.sum)
# aggfunc聚合函数,用于计算Total
完整代码:
import pandas as pd
import numpy as np

pd.options.display.max_columns=999
orders=pd.read_excel("C:\Temp\sales_records.xlsx")
# 添加年份列
orders['Year']=pd.DatetimeIndex(orders['Date']).year
# 制作透视表,方法一:pivot_table
pt1=orders.pivot_table(index='Category',columns='Year',values='Total',aggfunc=np.sum) # aggfunc聚合函数,用于计算Total

print(pt1)
- 制作透视表,方法二:
groupby
# 首先对数据进行分组
groups=orders.groupby(['Subcategory','Year'])
# 然后对不同的列进行计算
s=groups['Total'].sum()
c=groups['ID'].count()
# 生成一个新的DataFrame,把上面的s、c两列并到一起
pt2=pd.DataFrame({'Sum':s,'Count':c})
完整代码:
import pandas as pd

pd.options.display.max_columns=999
orders=pd.read_excel("C:\Temp\sales_records.xlsx")
# 添加年份列
orders['Year']=pd.DatetimeIndex(orders['Date']).year
# 制作透视表,方法二:groupby
groups=orders.groupby(['Subcategory','Year']) # 首先对数据进行分组
s=groups['Total'].sum() # 然后对不同的列进行计算
c=groups['ID'].count()
pt2=pd.DataFrame({'Sum':s,'Count':c}) # 生成一个新的DataFrame,把上面的s、c两列并到一起

print(pt2)
二十二、线性回归与数据预测
pandas操作:
- 先画柱状图
sales=pd.read_excel('C:\Temp\company_revenue.xlsx',dtype={'Month':str}) # 读取时顺便将Month设置为str格式,否则会显示为浮点数,如:2023.01

plt.bar(sales.index,sales.Revenue) # 柱状图,x轴为index
plt.title('Sales')
plt.xticks(sales.index,sales.Month,rotation=90) # 重铺x轴
plt.tight_layout()
plt.show()
- 再画趋势线
# 为了进行线性回归分析,需要引入
from scipy.stats import linregress

# 求线性回归方程
slope,intercept,r,p,std_err= linregress(sales.index,sales.Revenue) # 斜率、y轴上的截距、r、p、标准差
exp=sales.index*slope+intercept # 期望值

# 将刚刚的柱状图改为散点图
plt.scatter(sales.index,sales.Revenue)
# 画回归直线图
plt.plot(sales.index,exp,color='orange')
- 将标题改为回归方程
plt.title(f'y={slope}*x+{intercept}') # 标题为回归方程
完整代码:
import pandas as pd
import matplotlib
matplotlib.use('TkAgg')
import matplotlib.pyplot as plt
from scipy.stats import linregress # 为了进行线性回归分析,需要引入

sales=pd.read_excel('C:\Temp\company_revenue.xlsx',dtype={'Month':str}) # 读取时顺便将Month设置为str格式,否则会显示为浮点数,如:2023.01

# 求线性回归方程
slope,intercept,r,p,std_err= linregress(sales.index,sales.Revenue) # 斜率、y轴上的截距、r、p、标准差
exp=sales.index*slope+intercept # 期望值

# 画图
plt.scatter(sales.index,sales.Revenue) # 散点图
plt.plot(sales.index,exp,color='orange') # 回归直线
plt.title(f'y={slope}*x+{intercept}') # 标题为回归方程
plt.xticks(sales.index,sales.Month,rotation=90) # 重铺x轴
plt.tight_layout()
plt.show()
二十三、行操作集锦
完整代码:
import pandas as pd

page_001=pd.read_excel('C:\Temp\Students1.xlsx')
page_002=pd.read_excel('C:\Temp\Students2.xlsx')

students=page_001._append(page_002).reset_index(drop=True) # 使用_append拼接两张表;使用reset_index()重新排列index,drop=True将原来的index放弃

stu=pd.Series({'ID':41,'Name':'iop','Score':99}) # 使用Series创建一个新行
students=students._append(stu,ignore_index=True) # ignore_index=True自动生成一个index,如果不加会报错

students.at[39,'Name']='iop' # 使用at修改已存在的数据
stu=pd.Series({'ID':40,'Name':'iop','Score':100}) # 直接把这一行替换掉
students.iloc[39]=stu

# 插入操作需要先将完整的表切片,再将数据插入
stu=pd.Series({'ID':101,'Name':'qwe','Score':101})
part1=students[:20] # 切片0-19
part2=students[20:]
students=part1._append(stu,ignore_index=True)._append(part2).reset_index(drop=True)

students.drop(index=[0,1,2],inplace=True) # 删除行
students.drop(index=range(3,6),inplace=True)

# 将一些数据的Name设为空方便后续操作
for i in range(8,14):
    students['Name'].at[i]=''

# 根据条件删除行
missing=students.loc[students['Name']=='']
students.drop(index=missing.index,inplace=True) # 删除名字为空的行
students=students.reset_index(drop=True)

print(students)
23.1 合并两张表 _append
# 使用_append拼接两张表
students=page_001._append(page_002).reset_index(drop=True)
# 使用reset_index()重新排列index,drop=True将原来的index放弃
23.2 在末尾追加一个手动创建的新行
# 使用Series创建一个新行
stu=pd.Series({'ID':41,'Name':'iop','Score':99})
# 使用_append加入原表中
students=students._append(stu,ignore_index=True) # ignore_index=True自动生成一个index,如果不加会报错
23.3 更改数据表中已经有的值
# 1. 使用at修改已存在的数据
students.at[39,'Name']='iop'
students.at[39,'Score']='100'

# 2. 直接把这一行替换掉
stu=pd.Series({'ID':40,'Name':'iop','Score':100})
students.iloc[39]=stu
23.4 在数据表中插入一行
# 插入操作需要先将完整的表切片,再将数据插入
stu=pd.Series({'ID':101,'Name':'qwe','Score':101})
part1=students[:20] # 切片0-19
part2=students[20:]
students=part1._append(stu,ignore_index=True)._append(part2).reset_index(drop=True)
23.5 删除数据行
# 使用drop删除行,根据index
students.drop(index=[0,1,2],inplace=True)
students.drop(index=range(0,10),inplace=True)

# 将一些数据的Name设为空方便后续操作
for i in range(8,14):
    students['Name'].at[i]=''

# 根据条件删除行
missing=students.loc[students['Name']=='']
students.drop(index=missing.index,inplace=True) # 删除名字为空的行
二十四、列操作集锦
完整代码:
import pandas as pd
import numpy as np

page_001=pd.read_excel('C:\Temp\Students1.xlsx')
page_002=pd.read_excel('C:\Temp\Students2.xlsx')

# concat 类似于 _append,只是用法不同
students=pd.concat([page_001,page_002]).reset_index(drop=True)

# 追加列
students['Age']=25
# students['Age']=np.repeat(25,len(students)) 也可以
# students['Age']=np.arange(0,len(students)) 也可以

# 删除列
students.drop(columns='Age',inplace=True)
# students.drop(columns=['Age','Score'],inplace=True) 也可以

# 插入列
students.insert(1,column='Foo',value=30) # 在排号为1的列前面插入一列(排号从0开始)
# students.insert(1,column='Foo',value=np.repeat('foo',len(students))) 也可以

# 改列名
students.rename(columns={'Foo':'FOO','Name':'NAME'},inplace=True)

# 去掉空值
students['ID']=students['ID'].astype(float) # 设为浮点数,因为需要先设置为浮点数,才能变为NAN
for i in range(5,11):
    students['ID'].at[i]=np.nan # 设为NAN
students.dropna(inplace=True) # 专门去掉NAN,并设为原地操作

print(students)
24.1 将两张表横向拼接 concat
# concat 类似于 _append,只是用法不同
students=pd.concat([page_001,page_002],axis=1) # axis默认值是0,为从上到下,改为1后就会横向拼接了
24.2 追加列
# 方法一:直接赋值
students['Age']=25
# 方法二:repeat
students['Age']=np.repeat(25,len(students)) 也可以
# 方法三:arange
students['Age']=np.arange(0,len(students)) 也可以
24.3 删除列 drop
students.drop(columns='Age',inplace=True)
# students.drop(columns=['Age','Score'],inplace=True) 也可以
24.4 插入列 insert
students.insert(1,column='Foo',value=30) # 在排号为1的列前面插入一列(排号从0开始)
# students.insert(1,column='Foo',value=np.repeat('foo',len(students))) 也可以
24.5 改列名 rename
students.rename(columns={'Foo':'FOO','Name':'NAME'},inplace=True)
24.6 去掉空值 dropna
students['ID']=students['ID'].astype(float) # 设为浮点数,因为需要先设置为浮点数,才能变为NAN
for i in range(5,11):
    students['ID'].at[i]=np.nan # 设为NAN

students.dropna(inplace=True) # 专门去掉NAN,并设为原地操作
二十五、复杂计算列
求外接圆面积
import pandas as pd
import numpy as np

# 先写计算函数
def get_circumcircle_area(l,h):
    r=np.sqrt(l**2+h**2)/2
    return r**2**np.pi

# 排列更美观
def wrapper(row):
    return get_circumcircle_area(row['Length'],row['Height'])

rects=pd.read_excel('C:\Temp\Rectangles.xlsx')
rects['CA']=rects.apply(wrapper,axis=1) # 横向

print(rects)
不定义排列函数,改用lambda:
import pandas as pd
import numpy as np

# 先写计算函数
def get_circumcircle_area(l,h):
    r=np.sqrt(l**2+h**2)/2
    return r**2**np.pi

rects=pd.read_excel('C:\Temp\Rectangles.xlsx')
rects['CA']=rects.apply(lambda row:get_circumcircle_area(row['Length'],row['Height']),axis=1) # 横向

print(rects)
