需求
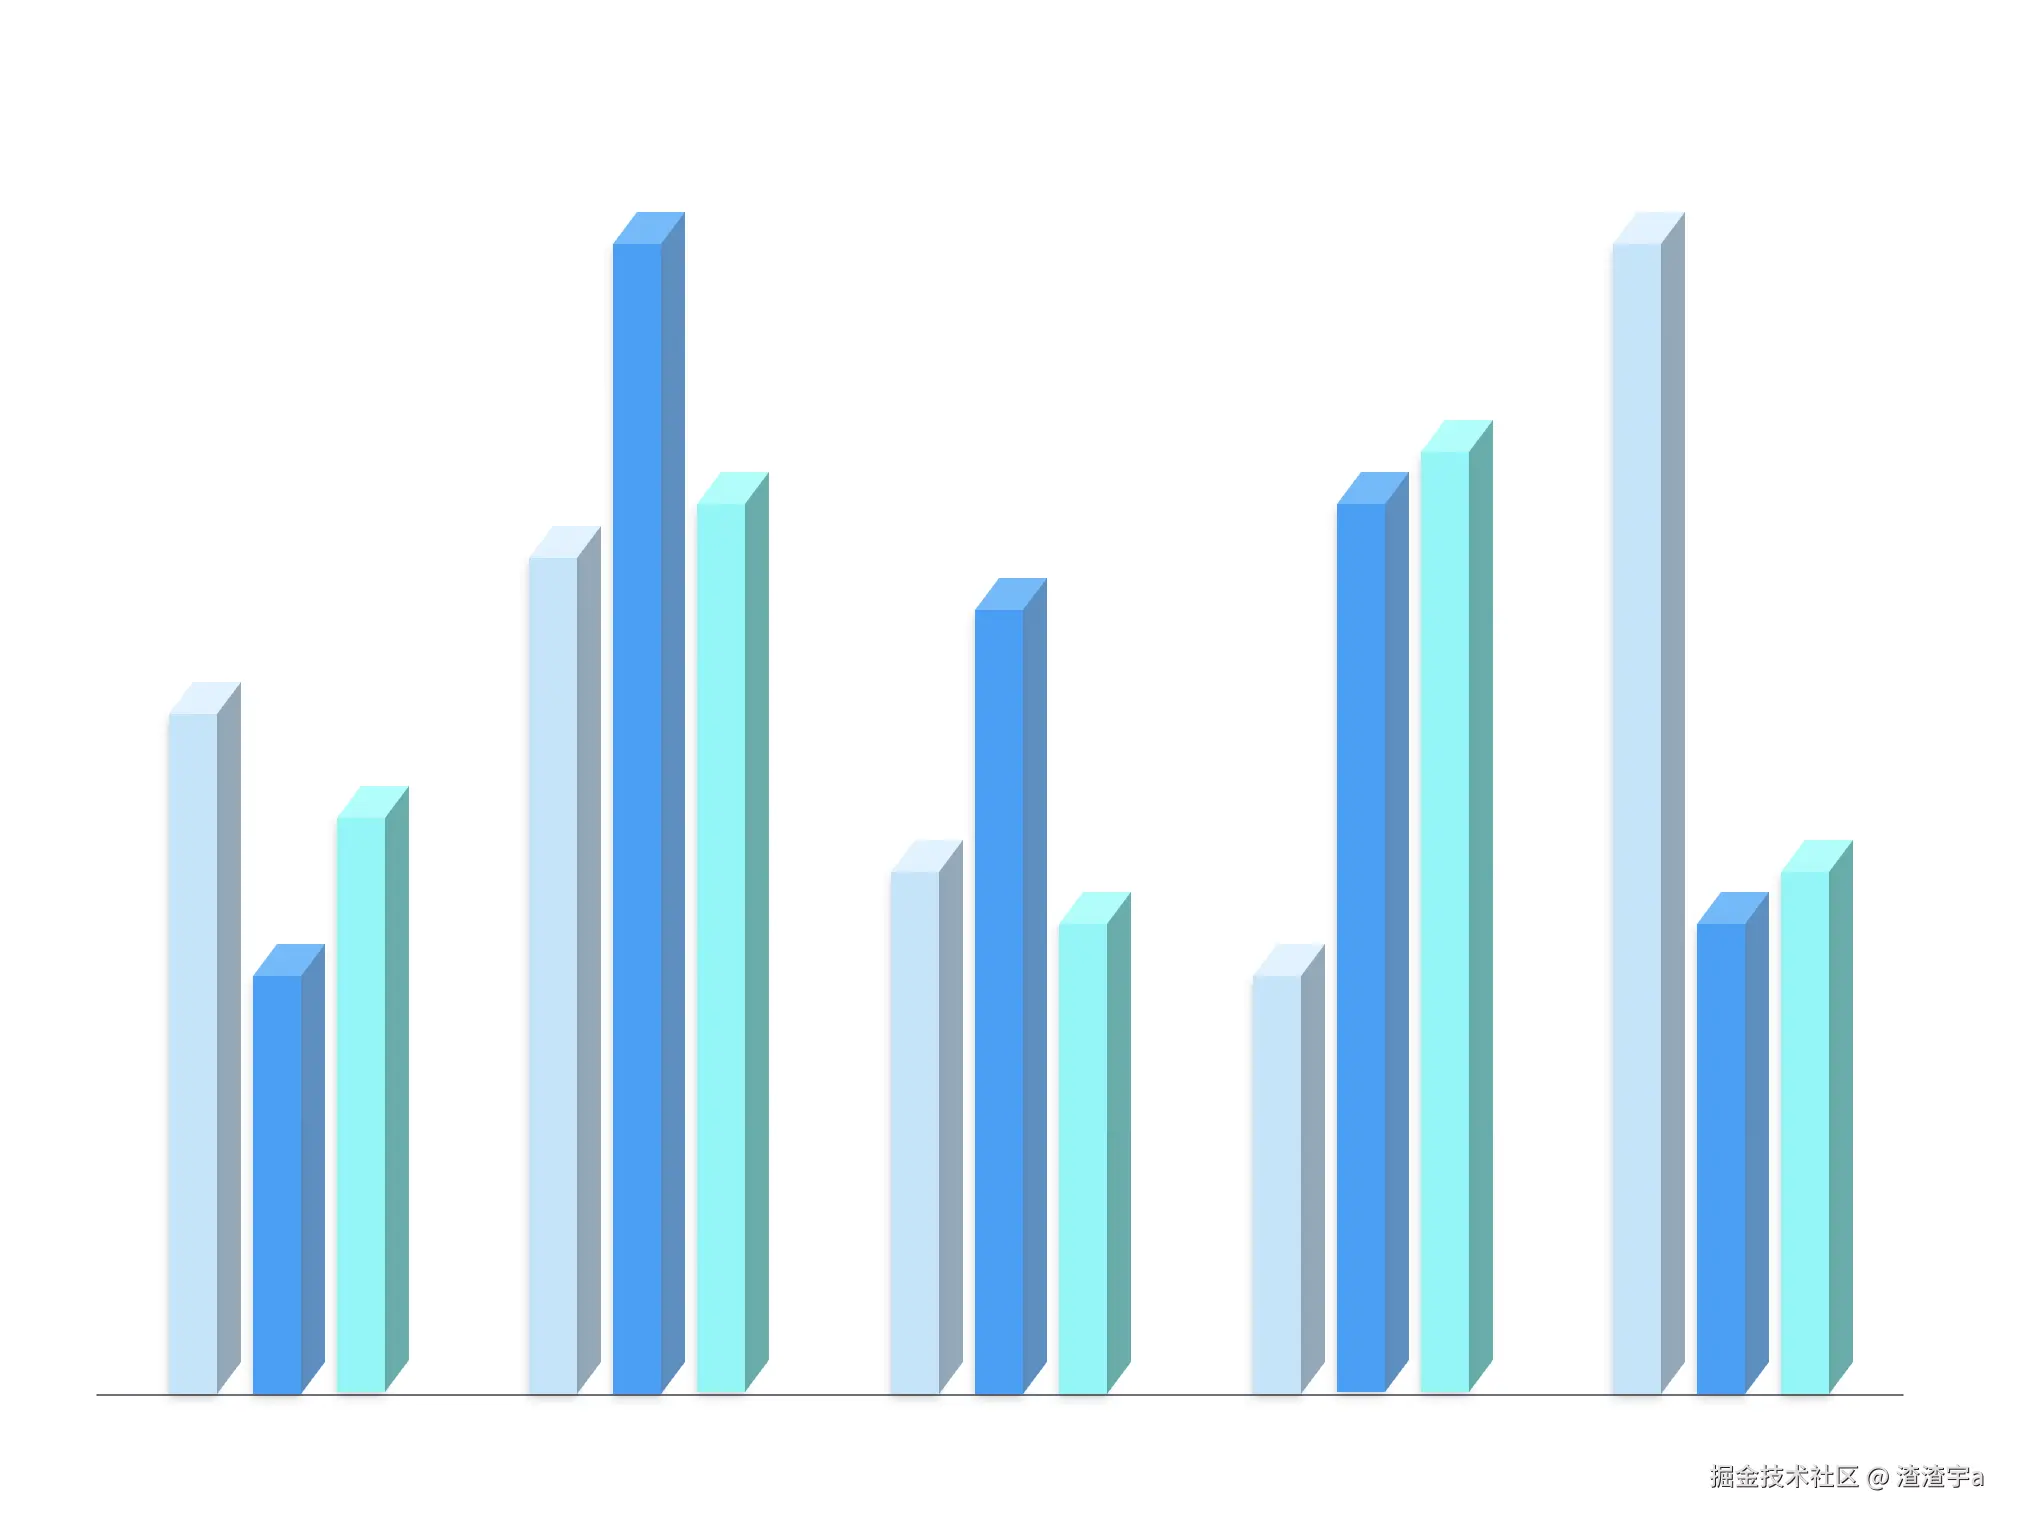
难点
- 多簇柱的话不能用
barGap重叠来实现侧方面,因为barGap是全局性质的参数
- 三个面的位置调整
实现
- custom分别实现单柱的正面(rect)、侧面(polygon),顶部(polygon)
- 遍历同组多个值批量生成,按index * x基准值 来决定位置
内容可直接放在echart的example中展示:
const x = ['a', 'b', 'c', 'd', 'e'],
y = [
[13, 16, 10, 8, 22],
[8, 22, 15, 17, 9],
[11, 17, 9, 18, 10]
],
barColors = [
{
front: '#BEE5FB',
side: '#7094A9',
top: '#D9F1FF'
},
{
front: '#18A0FB',
side: '#1274B5',
top: '#43B4FF'
},
{
front: 'rgba(108, 249, 249, 1)',
side: '#009B96',
top: '#8DFFFB'
}
];
const returnMutiple3DBarCustomSeries = (oeiginData, index) => {
const colors = barColors[index];
const data = oeiginData.map((n, i) => [i, n]);
const o = {
type: 'custom',
renderItem: function (params, api) {
const categoryIndex = api.value(0);
const value = api.value(1);
const [x, y] = api.coord([categoryIndex, value]);
const barWidth = 24;
const barHei = Math.floor(api.size([0, value])[1]);
const sideWidth = 12;
const topHeight = 16;
const baseX =
Math.floor(x) + barWidth * (index - 1) * 1.75 - barWidth / 2;
const baseY = Math.floor(y);
return {
type: 'group',
children: [
{
type: 'rect',
shape: {
x: baseX,
y: baseY,
width: barWidth,
height: barHei
},
style: {
fill: colors.front,
shadowColor: 'rgba(0,0,0,0.2)',
shadowBlur: 5,
shadowOffsetY: 2,
opacity: 1
}
},
{
type: 'polygon',
shape: {
x: baseX,
y: baseY,
points: [
[baseX + barWidth, baseY + barHei],
[baseX + barWidth + sideWidth, baseY + barHei - topHeight],
[baseX + barWidth + sideWidth, baseY - topHeight],
[baseX + barWidth, baseY]
]
},
style: {
fill: colors.side,
opacity: 0.8
}
},
{
type: 'polygon',
shape: {
points: [
[baseX, baseY],
[baseX + barWidth, baseY],
[baseX + barWidth + sideWidth, baseY - topHeight],
[baseX + sideWidth, baseY - topHeight]
]
},
style: {
fill: colors.top,
opacity: 0.9
}
}
]
};
},
data
};
return o;
};
option = {
tooltip: {
trigger: 'axis',
textStyle: {
fontSize: 22
},
padding: 10
},
grid: {
left: '5%',
right: '5%',
bottom: '20%',
top: '5%'
},
xAxis: {
data: x,
axisLabel: {
fontSize: 24,
color: '#fff'
},
axisTick: {
show: false
}
},
yAxis: {
type: 'value',
axisLabel: {
fontSize: 24,
color: '#fff'
},
splitLine: {
show: true,
lineStyle: {
color: '#fff',
type: 'dashed'
}
},
axisTick: {
show: false
}
},
series: y.map((d, i) => returnMutiple3DBarCustomSeries(d, i))
};
相关链接


