1.echarts
<template>
<div class="test">
<div ref="chartRef" style="width: 100%; height: 100%"></div>
</div>
</template>
<script setup>
import { onMounted, ref } from 'vue'
import * as echarts from 'echarts'
const chartRef = ref(null)
const initChart = () => {
const myChart = echarts.init(chartRef.value)
const url = 'https://geo.datav.aliyun.com/areas_v3/bound/360000_full.json'
fetch(url)
.then((res) => res.json())
.then((data) => {
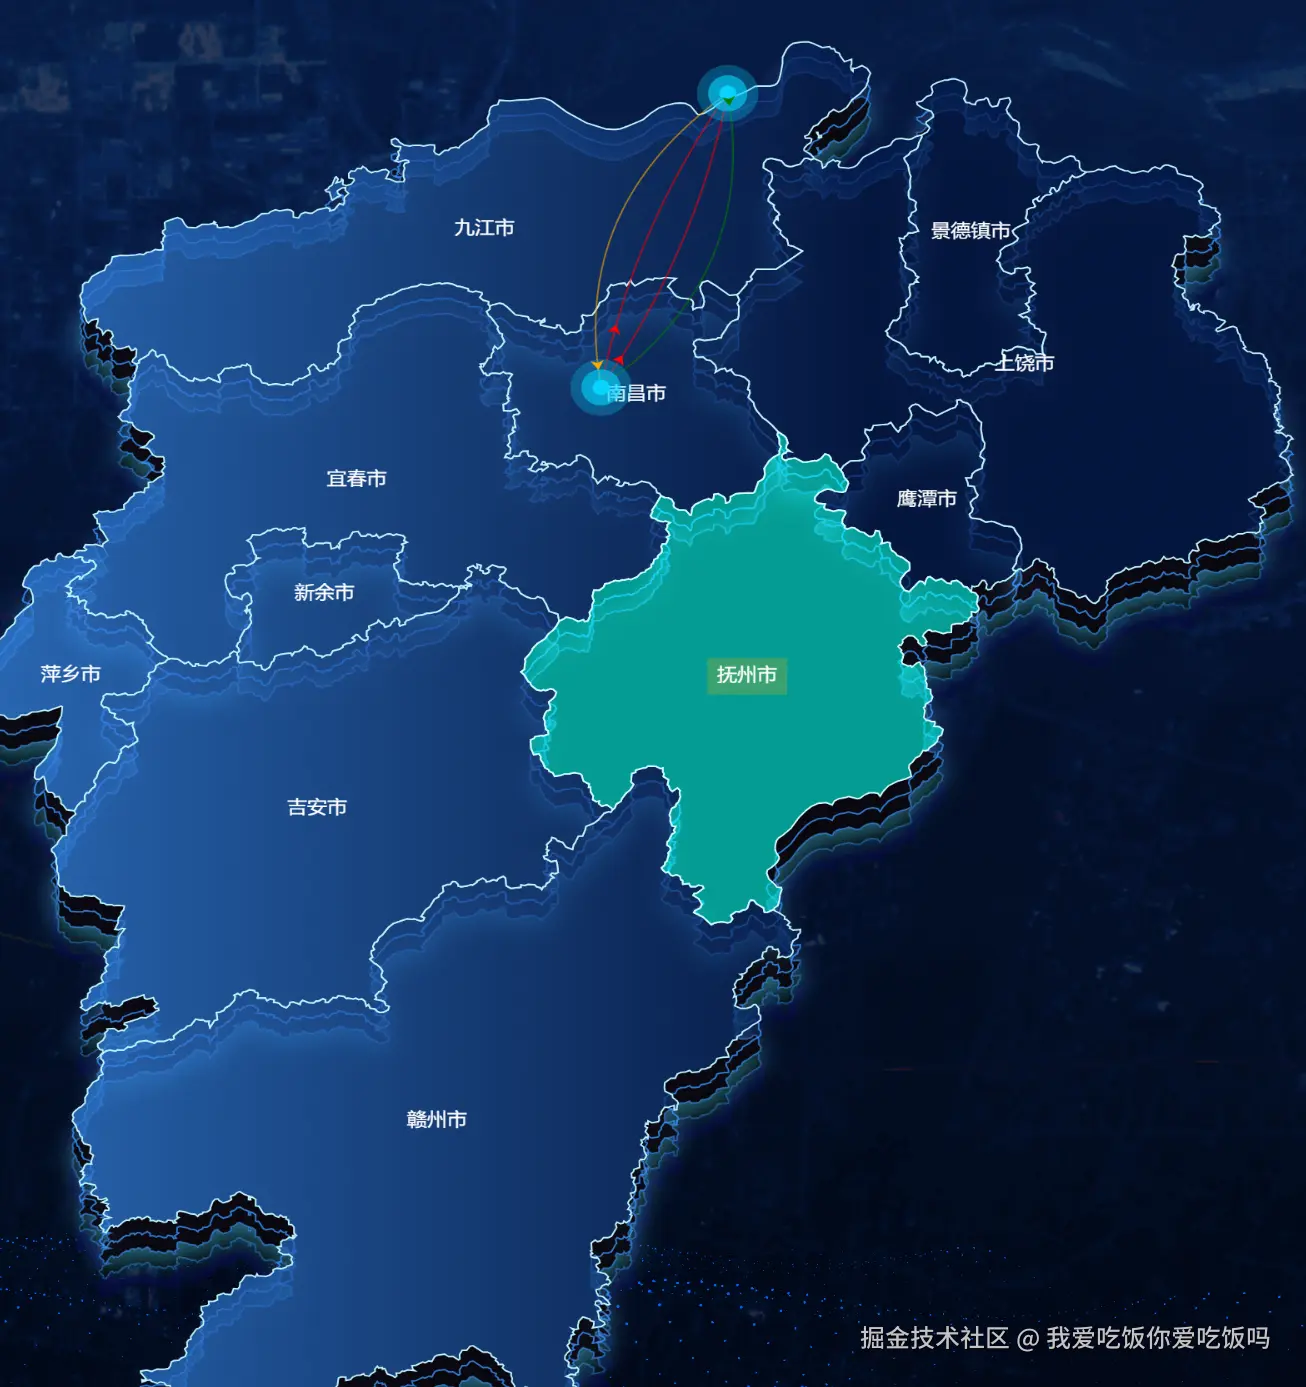
echarts.registerMap('jiangxi', data)
const points = [
[115.8921, 28.6765],
[116.3661, 29.8683],
]
const lines = [
{ from: [115.8921, 28.6765], to: [116.3661, 29.8683], lineType: 0, curveness: 0.1 },
{ from: [115.8921, 28.6765], to: [116.3661, 29.8683], lineType: 0, curveness: -0.1 },
{ from: [116.3661, 29.8683], to: [115.8921, 28.6765], lineType: 1, curveness: 0.3 },
{ from: [116.3661, 29.8683], to: [115.8921, 28.6765], lineType: 2, curveness: -0.3 },
]
const lineData = lines.map((line) => {
return {
coords: [line.from, line.to],
lineType: line.lineType,
lineStyle: {
color: ['red', 'green', 'orange'][line.lineType],
width: 1,
opacity: 0.6,
curveness: line.curveness,
},
}
})
const option = {
geo: [
{
layoutCenter: ['50%', '50%'],
layoutSize: '180%',
show: true,
map: 'jiangxi',
roam: false,
zoom: 0.5,
aspectScale: 1,
label: {
show: true,
textStyle: {
color: '#fff',
fontSize: 12,
},
emphasis: {
color: '#fff',
borderWidth: '12',
borderColor: '#3BA272',
fontSize: 12,
},
},
itemStyle: {
normal: {
areaColor: {
type: 'linear',
x: 1200,
y: 0,
x2: 0,
y2: 0,
colorStops: [
{
offset: 0,
color: 'rgba(3,27,78,0.75)',
},
{
offset: 1,
color: 'rgba(58,149,253,0.75)',
},
],
global: true,
},
borderColor: '#c0f3fb',
borderWidth: 1,
},
emphasis: {
areaColor: 'rgba(0,254,233,0.6)',
},
},
},
{
type: 'map',
map: 'jiangxi',
zlevel: -1,
aspectScale: 1,
zoom: 0.5,
layoutCenter: ['50%', '51%'],
layoutSize: '180%',
roam: false,
silent: true,
itemStyle: {
normal: {
borderWidth: 1,
borderColor: 'rgba(58,149,253,0.8)',
shadowColor: 'rgba(172, 122, 255,0.5)',
shadowOffsetY: 5,
shadowBlur: 15,
areaColor: 'rgba(5,21,35,0.1)',
},
},
},
{
type: 'map',
map: 'jiangxi',
zlevel: -2,
aspectScale: 1,
zoom: 0.5,
layoutCenter: ['50%', '52%'],
layoutSize: '180%',
roam: false,
silent: true,
itemStyle: {
normal: {
borderWidth: 1,
borderColor: 'rgba(58,149,253,0.6)',
shadowColor: 'rgba(65, 214, 255,.5)',
shadowOffsetY: 5,
shadowBlur: 15,
areaColor: 'transpercent',
},
},
},
{
type: 'map',
map: 'jiangxi',
zlevel: -3,
aspectScale: 1,
zoom: 0.5,
layoutCenter: ['50%', '53%'],
layoutSize: '180%',
roam: false,
silent: true,
itemStyle: {
normal: {
borderWidth: 1,
borderColor: 'rgba(58,149,253,0.4)',
areaColor: 'transpercent',
},
},
},
{
type: 'map',
map: 'jiangxi',
zlevel: -4,
aspectScale: 1,
zoom: 0.5,
layoutCenter: ['50%', '54%'],
layoutSize: '180%',
roam: false,
silent: true,
itemStyle: {
normal: {
borderWidth: 5,
borderColor: 'rgba(5,9,57,0.8)',
areaColor: 'rgba(5,21,35,0.1)',
},
},
},
],
series: [
{
type: 'effectScatter',
coordinateSystem: 'geo',
data: points,
symbolSize: 8,
itemStyle: {
color: '#06d3ff',
},
rippleEffect: {
period: 10,
scale: 6,
brushType: 'fill',
},
},
{
type: 'lines',
coordinateSystem: 'geo',
effect: {
show: true,
period: 6,
trailLength: 0,
symbol: 'arrow',
symbolSize: 6,
},
lineStyle: {
width: 2,
opacity: 0.6,
},
data: lineData,
},
],
}
myChart.setOption(option)
})
}
onMounted(() => {
initChart()
})
</script>
<style scoped>
.test {
height: 100%;
width: 100%;
color: #fff;
background-color: transparent;
}
</style>
2.用vue-echarts#
partFive.js
import * as echarts from 'echarts'
import jiangxiJson from '@/assets/jiangxi.json'
export default function usePartFive() {
const nameMap = '江西'
const mapIns = ref()
const mapChartOpt = ref({
geo: [
{
layoutCenter: ['50%', '50%'],
layoutSize: '180%',
show: true,
map: nameMap,
roam: false,
zoom: 0.5,
aspectScale: 1,
label: {
show: true,
textStyle: {
color: '#fff',
fontSize: 12,
},
emphasis: {
color: '#fff',
borderWidth: '12',
borderColor: '#3BA272',
fontSize: 12,
},
},
itemStyle: {
normal: {
areaColor: {
type: 'linear',
x: 1200,
y: 0,
x2: 0,
y2: 0,
colorStops: [
{
offset: 0,
color: 'rgba(3,27,78,0.75)',
},
{
offset: 1,
color: 'rgba(58,149,253,0.75)',
},
],
global: true,
},
borderColor: '#c0f3fb',
borderWidth: 1,
},
emphasis: {
areaColor: 'rgba(0,254,233,0.6)',
},
},
},
{
type: 'map',
map: nameMap,
zlevel: -1,
aspectScale: 1,
zoom: 0.5,
layoutCenter: ['50%', '51%'],
layoutSize: '180%',
roam: false,
silent: true,
itemStyle: {
normal: {
borderWidth: 1,
borderColor: 'rgba(58,149,253,0.8)',
shadowColor: 'rgba(172, 122, 255,0.5)',
shadowOffsetY: 5,
shadowBlur: 15,
areaColor: 'rgba(5,21,35,0.1)',
},
},
},
{
type: 'map',
map: nameMap,
zlevel: -2,
aspectScale: 1,
zoom: 0.5,
layoutCenter: ['50%', '52%'],
layoutSize: '180%',
roam: false,
silent: true,
itemStyle: {
normal: {
borderWidth: 1,
borderColor: 'rgba(58,149,253,0.6)',
shadowColor: 'rgba(65, 214, 255,.5)',
shadowOffsetY: 5,
shadowBlur: 15,
areaColor: 'transpercent',
},
},
},
{
type: 'map',
map: nameMap,
zlevel: -3,
aspectScale: 1,
zoom: 0.5,
layoutCenter: ['50%', '53%'],
layoutSize: '180%',
roam: false,
silent: true,
itemStyle: {
normal: {
borderWidth: 1,
borderColor: 'rgba(58,149,253,0.4)',
areaColor: 'transpercent',
},
},
},
{
type: 'map',
map: nameMap,
zlevel: -4,
aspectScale: 1,
zoom: 0.5,
layoutCenter: ['50%', '54%'],
layoutSize: '180%',
roam: false,
silent: true,
itemStyle: {
normal: {
borderWidth: 5,
borderColor: 'rgba(5,9,57,0.8)',
areaColor: 'rgba(5,21,35,0.1)',
},
},
},
],
series: [
{
type: 'effectScatter',
coordinateSystem: 'geo',
data: [],
symbolSize: 8,
itemStyle: {
color: '#06d3ff',
},
rippleEffect: {
period: 10,
scale: 6,
brushType: 'fill',
},
},
{
type: 'lines',
coordinateSystem: 'geo',
effect: {
show: true,
period: 6,
trailLength: 0,
symbol: 'arrow',
symbolSize: 6,
},
lineStyle: {
width: 2,
opacity: 0.6,
},
data: [],
},
],
})
const initMap = () => {
mapChartOpt.value.series[0].data = [
[115.8921, 28.6765],
[116.3661, 29.8683],
]
const lines = [
{ from: [115.8921, 28.6765], to: [116.3661, 29.8683], lineType: 0, curveness: 0.1 },
{ from: [115.8921, 28.6765], to: [116.3661, 29.8683], lineType: 0, curveness: -0.1 },
{ from: [116.3661, 29.8683], to: [115.8921, 28.6765], lineType: 1, curveness: 0.3 },
{ from: [116.3661, 29.8683], to: [115.8921, 28.6765], lineType: 2, curveness: -0.3 },
]
const lineData = lines.map((line) => {
return {
coords: [line.from, line.to],
lineType: line.lineType,
lineStyle: {
color: ['red', 'green', 'orange'][line.lineType],
width: 1,
opacity: 0.6,
curveness: line.curveness,
},
}
})
mapChartOpt.value.series[1].data = lineData
echarts.registerMap(nameMap, jiangxiJson)
return Promise.resolve()
}
onMounted(async () => {
await initMap()
})
return {
mapIns,
mapChartOpt,
}
}
index.vue
<template>
  <div class="test">
    <ECharts ref="mapIns" id="mapIns" :option="mapChartOpt" />
  </div>
</template>

<script setup>
import { onMounted, ref } from 'vue'
import * as echarts from 'echarts'
import { createComponent } from 'echarts-for-vue'
const ECharts = createComponent({ echarts, h })
import usePartFive from './js/partFive'
const { mapIns, mapChartOpt } = usePartFive()
</script>

<style scoped>
.test {
  height: 100%;
  width: 100%;
  color: #fff;
  background-color: transparent;
}
</style>


