<template>
<div id="supermap" ref="supermap" class="supermap" style="height: 100vh; width: 100vw; margin: 0 14px 0 10px"></div>
</template>
<script>
import { Map, View } from 'ol'
import TileLayer from 'ol/layer/Tile'
import { Image as ImageLayer } from 'ol/layer'
import { TileSuperMapRest } from '@supermap/iclient-ol'
import { Mapv } from '@supermap/iclient-ol/overlay/Mapv'
import * as mapv from 'mapv'
export default {
name: 'dashboard',
computed: {
mapBaseUrl() {
return this.$params?.SUPER_MAP_URL || ''
}
},
mounted() {
var url = this.mapBaseUrl + 'iserver/services/map-china400/rest/maps/ChinaDark?prjCoordSys={epsgcode:4326}'
var map = new Map({
target: 'supermap',
view: new View({
center: [113.28, 22.65],
zoom: 8,
projection: 'EPSG:4326',
multiWorld: true
}),
layers: [
new TileLayer({
source: new TileSuperMapRest({
url: url,
prjCoordSys: { epsgCode: 4326 }
}),
projection: 'EPSG:4326'
})
]
})
const geojson = require('./modules/map/json/china.json')
var geojsonOptions = {
gradient: {
0: 'rgba(55, 50, 250, 0.4)',
1: 'rgba(55, 50, 250, 1)'
},
max: 354551,
draw: 'intensity'
}
var geojsonDataSet = mapv.geojson.getDataSet(geojson)
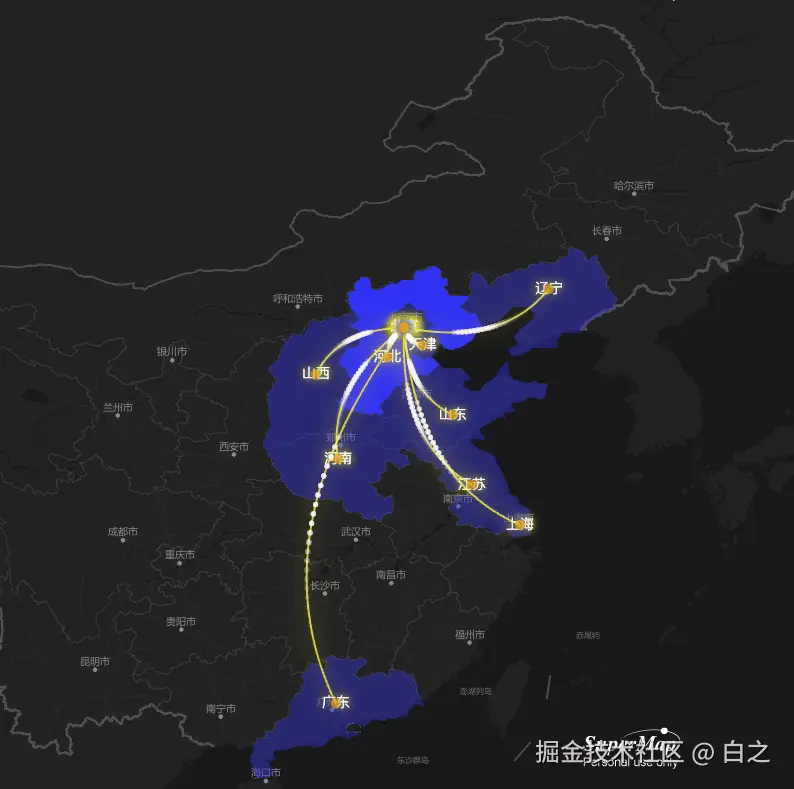
var to = '北京'
var qianxi = new mapv.DataSet([
{
from: '河北',
count: 354551,
to: to
},
{
from: '天津',
count: 97323,
to: to
},
{
from: '山东',
count: 28664,
to: to
},
{
from: '山西',
count: 16650,
to: to
},
{
from: '辽宁',
count: 14379,
to: to
},
{
from: '河南',
count: 10980,
to: to
},
{
from: '内蒙古自治区',
count: 9603,
to: to
},
{
from: '江苏',
count: 4536,
to: to
},
{
from: '上海',
count: 3556,
to: to
},
{
from: '广东',
count: 2600,
to: to
}
])
var qianxiData = qianxi.get()
var lineData = []
var pointData = []
var textData = []
var timeData = []
var citys = {}
for (var i = 0; i < qianxiData.length; i++) {
var fromCenter = mapv.utilCityCenter.getCenterByCityName(qianxiData[i].from)
var toCenter = mapv.utilCityCenter.getCenterByCityName(qianxiData[i].to)
if (!fromCenter || !toCenter) {
continue
}
citys[qianxiData[i].from] = qianxiData[i].count
citys[qianxiData[i].to] = 100
pointData.push({
geometry: {
type: 'Point',
coordinates: [fromCenter.lng, fromCenter.lat]
}
})
pointData.push({
geometry: {
type: 'Point',
coordinates: [toCenter.lng, toCenter.lat]
}
})
textData.push({
geometry: {
type: 'Point',
coordinates: [fromCenter.lng, fromCenter.lat]
},
text: qianxiData[i].from
})
textData.push({
geometry: {
type: 'Point',
coordinates: [toCenter.lng, toCenter.lat]
},
text: qianxiData[i].to
})
var curve = mapv.utilCurve.getPoints([fromCenter, toCenter])
for (let j = 0; j < curve.length; j++) {
timeData.push({
geometry: {
type: 'Point',
coordinates: curve[j]
},
count: 1,
time: j
})
}
lineData.push({
geometry: {
type: 'LineString',
coordinates: curve
//coordinates: [[fromCenter.lng, fromCenter.lat], [toCenter.lng, toCenter.lat]]
},
count: 30 * Math.random()
})
}
var data = geojsonDataSet.get({
filter: function (item) {
if (!citys[item.name]) {
return false
}
item.count = citys[item.name]
return true
}
})
geojsonDataSet = new mapv.DataSet(data)
map.addLayer(
new ImageLayer({
source: new Mapv({ map: map, dataSet: geojsonDataSet, mapvOptions: geojsonOptions })
})
)
var textDataSet = new mapv.DataSet(textData)
var textOptions = {
draw: 'text',
font: '14px Arial',
fillStyle: 'white',
shadowColor: 'yellow',
shadowBlue: 10,
zIndex: 11,
shadowBlur: 10
}
map.addLayer(
new ImageLayer({
source: new Mapv({ map: map, dataSet: textDataSet, mapvOptions: textOptions })
})
)
var lineDataSet = new mapv.DataSet(lineData)
var lineOptions = {
strokeStyle: 'rgba(255, 250, 50, 0.8)',
shadowColor: 'rgba(255, 250, 50, 1)',
shadowBlur: 20,
lineWidth: 2,
zIndex: 100,
draw: 'simple'
}
map.addLayer(
new ImageLayer({
source: new Mapv({ map: map, dataSet: lineDataSet, mapvOptions: lineOptions })
})
)
var pointOptions = {
fillStyle: 'rgba(254,175,3,0.7)',
shadowColor: 'rgba(55, 50, 250, 0.5)',
shadowBlur: 10,
size: 5,
zIndex: 10,
draw: 'simple'
}
var pointDataSet = new mapv.DataSet(pointData)
map.addLayer(
new ImageLayer({
source: new Mapv({ map: map, dataSet: pointDataSet, mapvOptions: pointOptions })
})
)
var timeDataSet = new mapv.DataSet(timeData)
var timeOptions = {
fillStyle: 'rgba(255, 250, 250, 0.5)',
zIndex: 200,
size: 2.5,
animation: {
type: 'time',
stepsRange: {
start: 0,
end: 50
},
trails: 10,
duration: 2
},
draw: 'simple'
}
map.addLayer(
new ImageLayer({
source: new Mapv({ map: map, dataSet: timeDataSet, mapvOptions: timeOptions })
})
)
}
}
</script>


