完整代码如下:
<!DOCTYPE html>
<html>
<head>
<meta charset="utf-8">
<title>Plotly.js Spectrogram Example</title>
<script src="https://cdn.plot.ly/plotly-3.0.0-rc.1.min.js" charset="utf-8"></script>
</head>
<body>
<div id="spectrogram"></div>
<div id="dopplerPlot" style="width: 100%; height: 500px;"></div>
<div id="heatmapPlot" style="width: 100%; height: 600px;"></div>
<script>
const times = [];
const frequencies = [];
const snrData = [];
for (let t = 0; t <= 24; t += 0.15) {
times.push(t);
}
for (let f = 45; f <= 90; f += 1) {
frequencies.push(f);
}
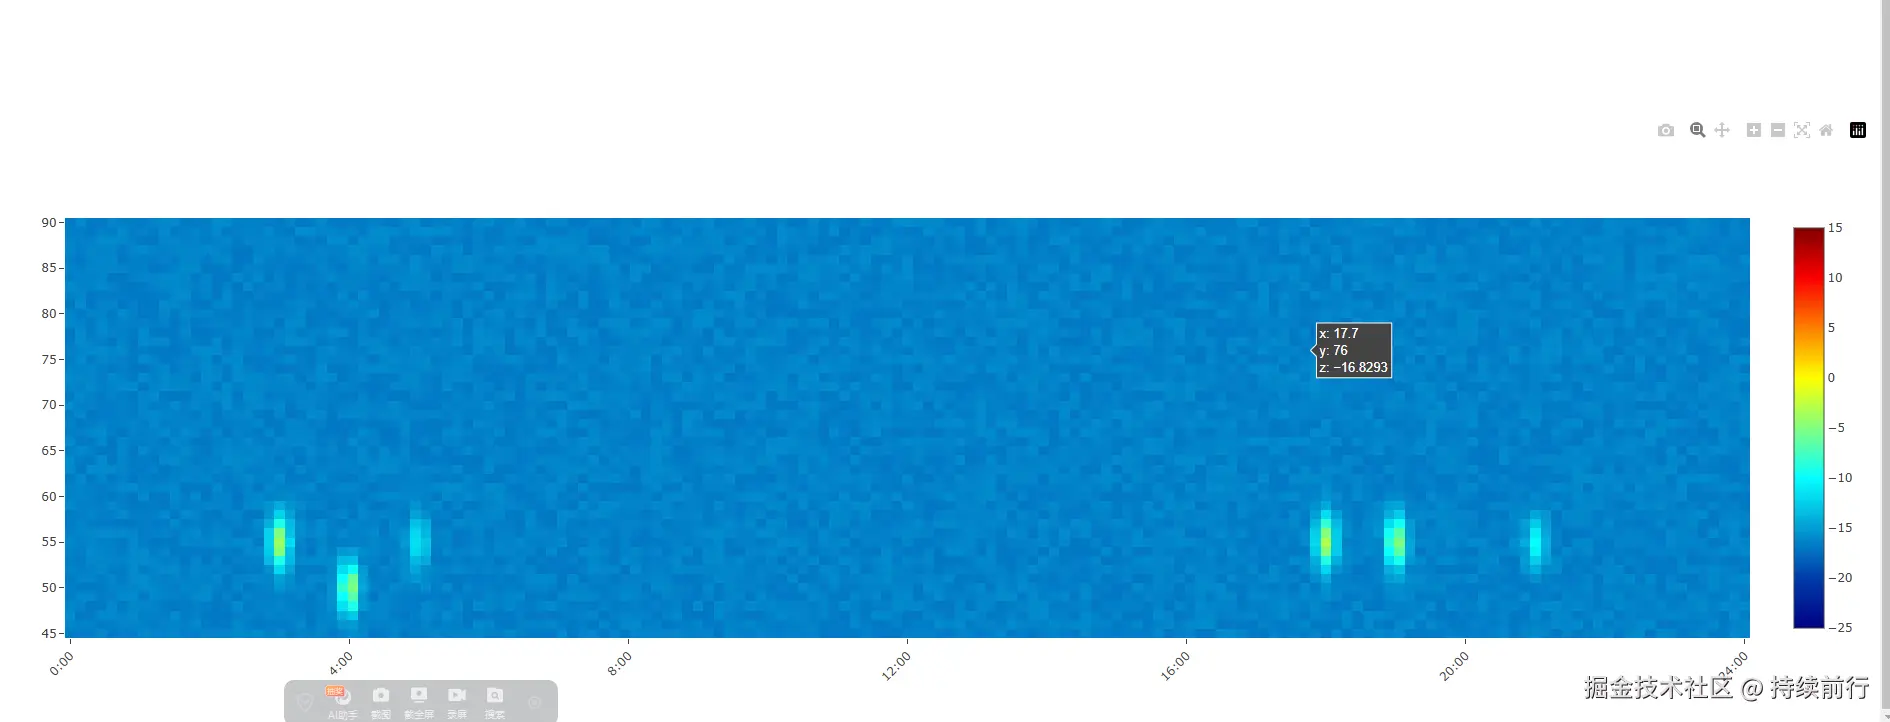
const signals = [
{ A: 13, f0: 55, t0: 3, sigma_f: 2, sigma_t: 0.1 },
{ A: 13, f0: 50, t0: 4, sigma_f: 2, sigma_t: 0.1 },
{ A: 6, f0: 55, t0: 5, sigma_f: 2, sigma_t: 0.1 } ,
{ A:13 , f0: 55, t0: 18, sigma_f: 2, sigma_t: 0.1 },
{ A: 13, f0: 55, t0: 19, sigma_f: 2, sigma_t: 0.1 },
{ A: 6, f0: 55, t0: 21, sigma_f: 2, sigma_t: 0.1 },
];
for (let i = 0; i < frequencies.length; i++) {
const row = [];
for (let j = 0; j < times.length; j++) {
const t = times[j];
let snr = -17 + Math.random() * 1.1;
for (const signal of signals) {
const { A, f0, t0, sigma_f, sigma_t } = signal;
snr += A * Math.exp(
-((frequencies[i] - f0) ** 2) / (2 * sigma_f ** 2) -
((t - t0) ** 2) / (2 * sigma_t ** 2)
);
}
row.push(snr);
}
snrData.push(row);
}
const customTickVals = [0, 4, 8, 12, 16,20,24];
const customTickText = ['0:00', '4:00', '8:00', '12:00', '16:00', '20:00','24:00'];
const trace = {
z: snrData,
x: times,
y: frequencies,
type: 'heatmap',
colorscale: 'Jet',
colorbar: {
title: 'SNR/dB',
titleside: 'right',
},
zmin: -25,
zmax: 15,
};
const layout = {
title: 'Simulated Doppler Heatmap with Selected Time Points',
xaxis: {
title: 'Time (UT)',
tickvals: customTickVals,
ticktext: customTickText,
tickangle: -45,
},
yaxis: {
title: 'Frequency (MHz)',
},
};
Plotly.newPlot('heatmapPlot', [trace], layout);
</script>
</body>
</html>


