

发现G6现在网上在线解答的文章都是4.x版本居多,但是5.x其实改了挺多方法的,具体可以看g6.antv.antgroup.com/manual/upgr… 这里面展示了很多4.0版本升级到5.0版本的api修改及其他修改
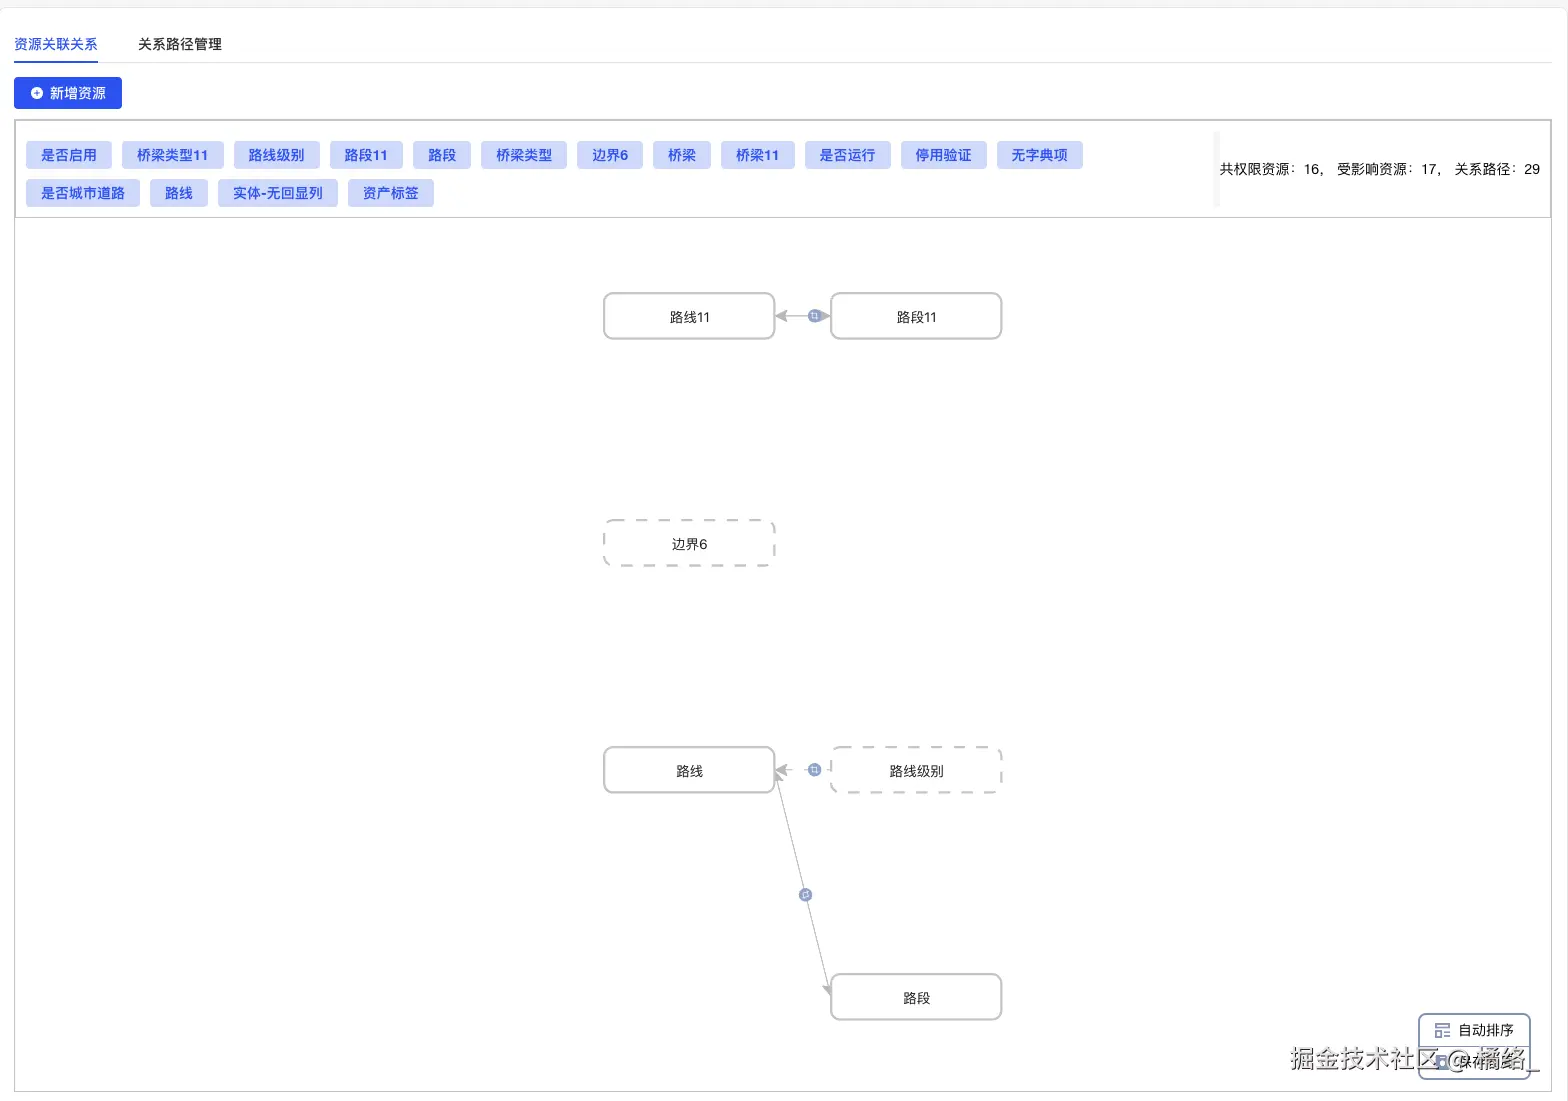
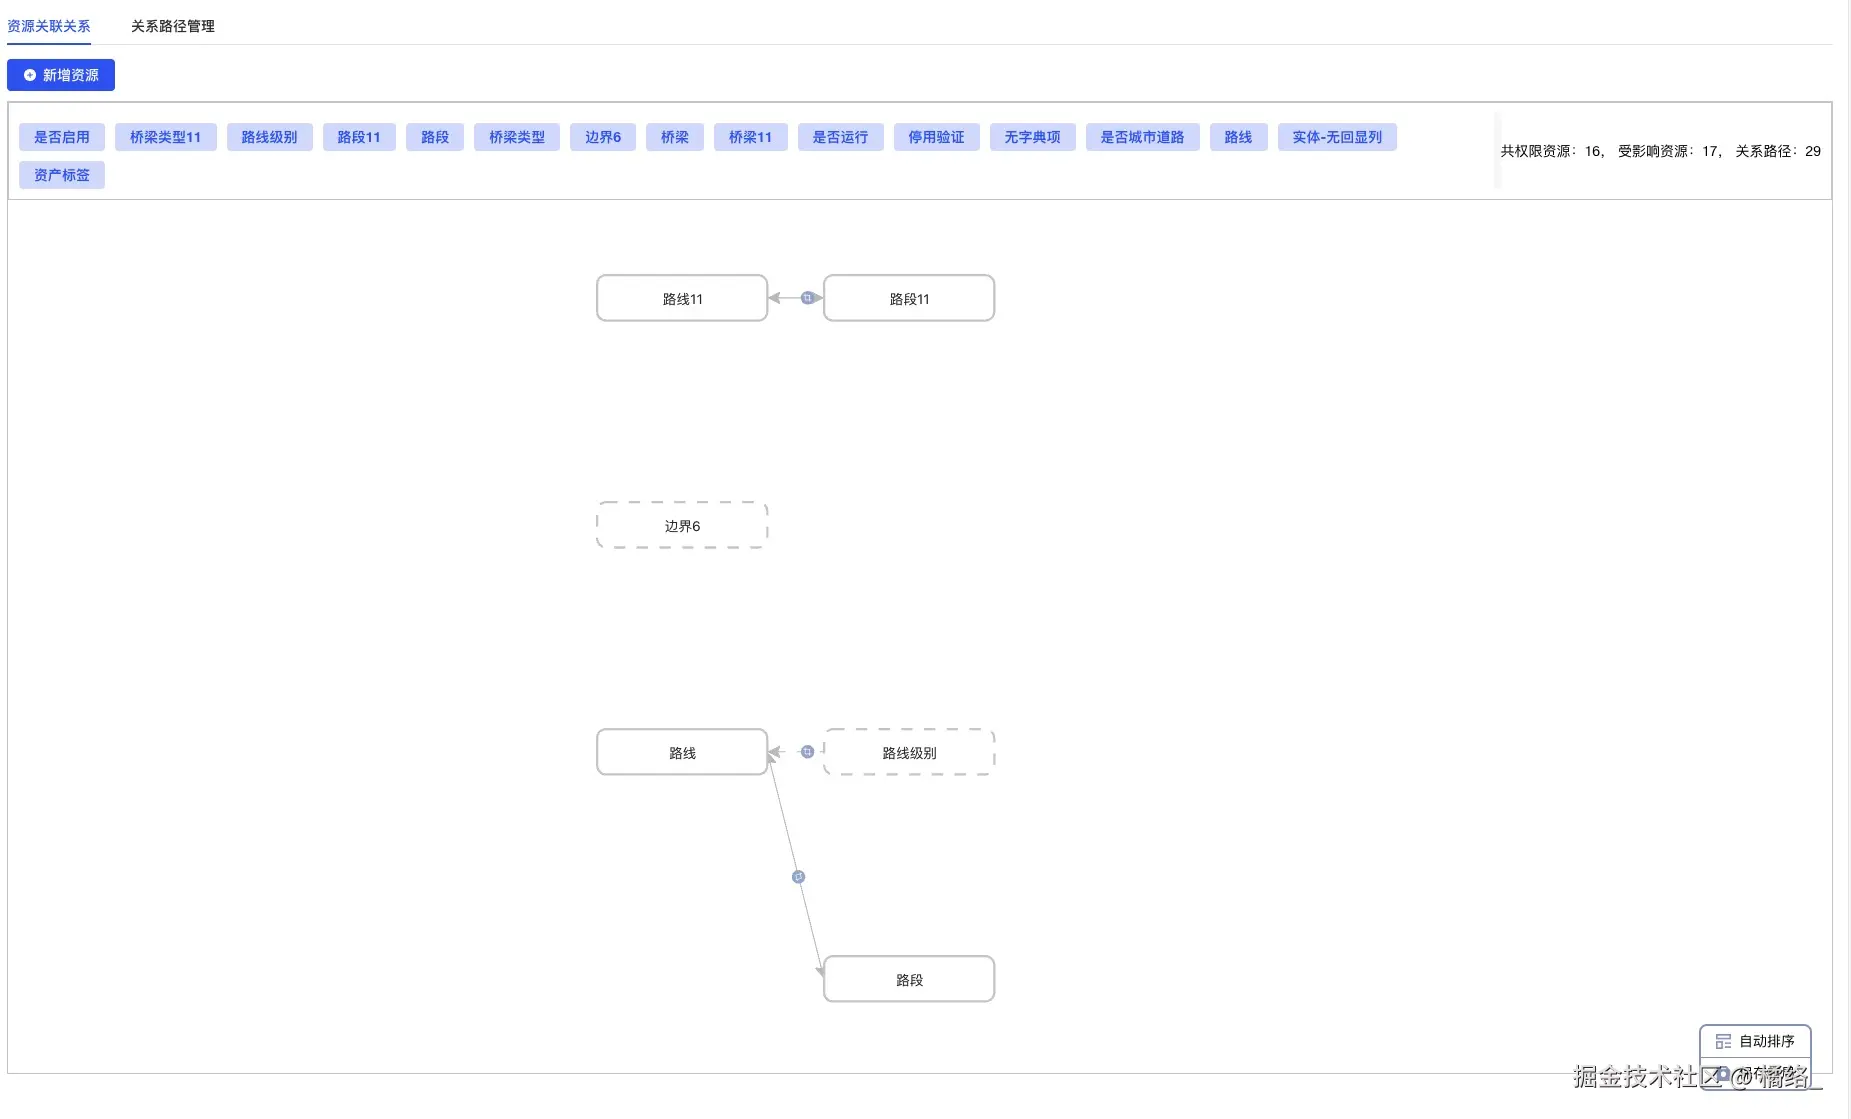
这是我的效果,下面代码只给了执行画布的
//html
<div class="container-box">
    <div id="container"></div>
    <div class="style-box">
        <div @click="saveCanvasStyle(1)" class="layout-box"><img src="/src/assets/layout.png" alt="" />自动排序</div>
        <div @click="saveCanvasStyle"><img src="/src/assets/save-layout.png" alt="" />保存布局</div>
    </div>
</div>
```
//ts
// 画布数据
let graph;
const { Graph } = G6;
//资源列表
const canvasData = ref(); ////source-边起始节点 ID,target-边目标节点 ID
```
const getResourceRelationList = async () => {
try {
formInline.show = false;
//后端直接返回和G6数据一样的数据
const { data } = await selectResourceRelationList();
if (data) {
if (graph) {
graph.clear();
}
canvasData.value = {
...data,
nodes: data?.nodes?.map((v, i) => {
let style;
try {
style = JSON.parse(v.style); // 确保解析成功
} catch (e) {
style = ''; // 默认值,避免错误
}
return {
...v,
style,
};
}),
};
containerCreate(canvasData.value);
}
} catch (err) {
console.log(err);
useMessage().error(err.msg);
}
};
```
const containerCreate = data => {
if (!canvasData?.value?.nodes) return;
// 判断是否所有节点都没有样式信息——由于存在重置布局,重置布局的话,需要样式安装G6自己的排列规则去排列,所以需要判断是否有样式信息
const hasNodeStyle = data?.nodes?.some(node => node.style && Object.keys(node.style).length > 0);
graph = new Graph({
container: 'container',
autoFit: 'view',
zoom: 1,
zoomRange: [0.3, 5],
layout: hasNodeStyle
? null
: {
// 如果有样式,layout 为 null;否则使用默认布局
type: 'dagre', // 使用 dagre 布局,也可以使用其他布局,如 grid、circular 等
rankdir: 'LR', // 左->右布局
align: 'DL',
controlPoints: true,
},
data, //数据
node: {
//节点
type: 'rect',
badge: true,
state: {
highlight: {
// 节点高亮样式
// fill: '#375EE2',
stroke: '#375EE2',
fontColor: '#fff',
lineWidth: 3,
halo: true,
},
selected: {
// 节点选中样式
fill: '#375EE2',
stroke: '#375EE2',
lineWidth: 3,
},
},
style: {
size: [150, 40],
lineDash: d => (d.data.resourceType === '2' ? [10, 10] : [0, 0]),
fill: '#fff',
stroke: '#ccc',
lineWidth: 2,
fontSize: 20,
labelText: d => d.name,
radius: 8,
labelPlacement: 'center',
ports: [{ placement: 'top' }, { placement: 'bottom' }, { placement: 'left' }, { placement: 'right' }],
},
palette: {
field: d => d.combo,
},
},
edge: {
// type: 'polyline',
style: {
endArrow: d => d.isDist !== '2',
startArrow: d => d.isDist !== '1',
labelPlacement: 'canter',
badge: true,
badgeText: '\ue611',
badgeFontFamily: 'iconfont',
badgeBackgroundWidth: 12,
badgeBackgroundHeight: 12,
lineDash: d => (d.isDist !== '0' ? [10, 10] : [0, 0]),
router: {
type: 'orth', // 或者 'orth' 使边避免重叠
// offset: 90, // 通过偏移来避免重叠
},
stroke: '#C0C0C0',
label: {
position: 'center',
},
},
state: {
// 线高亮样式
highlight: {
stroke: '#375EE2',
},
selected: {
// 线选中样式
stroke: '#375EE2',
lineWidth: 3,
},
},
},
combo: {
//组合
type: 'rect',
style: {
radius: 8,
labelText: d => d.id,
lineDash: 0,
collapsedLineDash: [5, 5],
},
},
animation: false,
behaviors: [
//交互
'zoom-canvas',
'drag-canvas',
'drag-element',
'contextmenu',
'click-select',
{
type: 'hover-activate',
degree: 0,
state: 'highlight',
},
],
plugins: [
//插件
{
type: 'contextmenu',
trigger: 'contextmenu',
onClick: (v, e, d) => {
const nodeData = graph.getElementData(d.id);
if (v === 'add') {
handelOpenAdd('addNode', nodeData.data);
} else {
//当前节点修改为选中状态
graph.setElementState(d.id, 'selected', true);
//需要调用的方法及获取的数据,
//getResourceList();
//formInline.source = d.id;
//formInline.show = true;
}
},
getItems: e => {
return [
{ name: '新建资源节点', value: 'add' },
{ name: '选择已有资源', value: 'detail' },
];
},
enable: e => {
return ['node'].includes(e.targetType);
},
},
],
});
// 对于没有样式信息的节点,使用默认坐标
if (hasNodeStyle) {
const list = data.nodes.filter(node => !node.style || Object.keys(node.style).length == 0);
const nodesWithStyle = data.nodes.filter(node => node.style && Object.keys(node.style).length > 0);
// 获取所有具有 style 的节点的 x 值
const xValues = nodesWithStyle.map(node => {
// 假设 style 中有一个 x 属性
return node.style.x;
});
const yValues = nodesWithStyle.map(node => {
// 假设 style 中有一个 x 属性
return node.style.y;
});
// 找到最小的 x 值
const minX = Math.min(...xValues);
const minY = Math.min(...yValues);
//为了没有样式的新增节点不重叠,找出最小的XY轴值,通过加减的方式排列,按自己的需求来
list.forEach((node, index) => {
if (!node.style || Object.keys(node.style).length === 0) {
// 设置默认位置
const x = minX + (index + 1) * 180; // 水平间隔
const y = minY - 100; // 固定垂直位置
graph.updateNodeData([{ id: node.id, style: { size: [150, 40], x, y } }]);
}
});
}
//执行渲染
graph.render();
//节点点击的操作
graph.on('node:click', (e, d) => {
const nodeData = graph.getElementData(e.target.id);
handelOpenDetail('detail', nodeData);
});
//边点击之后的操作
graph.on('edge:click', (e, d) => {
const edgeData = graph.getEdgeData(e.target.id);
handelOpenResource({ type: 'detailEdge', data: edgeData });
});
//这里的代码是我用来解决残影的,你会发现你移动节点的时候有残影,但是移动一下布局或者缩放一
下,残影就没有了,所以我直接去当前的缩放比例,重新赋值回去,虽然有点笨拙,但是功能实现了,其实
官网有提到相关的注意事项(看下图),但是我不能确保每一个注意事项都能不出现,所以只能自己想办法
graph.on('node:dragend', e => {
let num = graph.getZoom(); // 获取当前的缩放级别
graph.zoomTo(num); // 缩放画布至指定比例(绝对缩放)
});
};
```
// 保存画布样式及重置样式
const saveCanvasStyle = async val => {
console.log(graph.getZoom(), 'getComboData');
try {
let nodeData = graph.getNodeData().map(v => {
let style = {
x: v.style.x,
y: v.style.y,
z: v.style.z,
};
return {
id: v.id,
style: val === 1 ? '' : JSON.stringify(style),
};
});
await updateBatchStyleById(nodeData);
useMessage().success('保存成功');
await getResourceRelationList();
} catch (err) {
console.log(err);
useMessage().error(err.msg);
}
};
```
```
