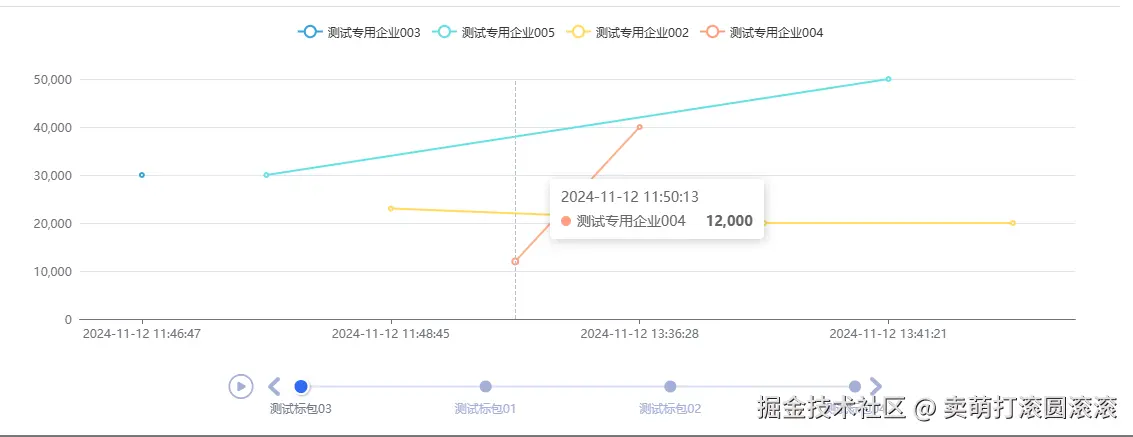
实现效果如下
实现步骤
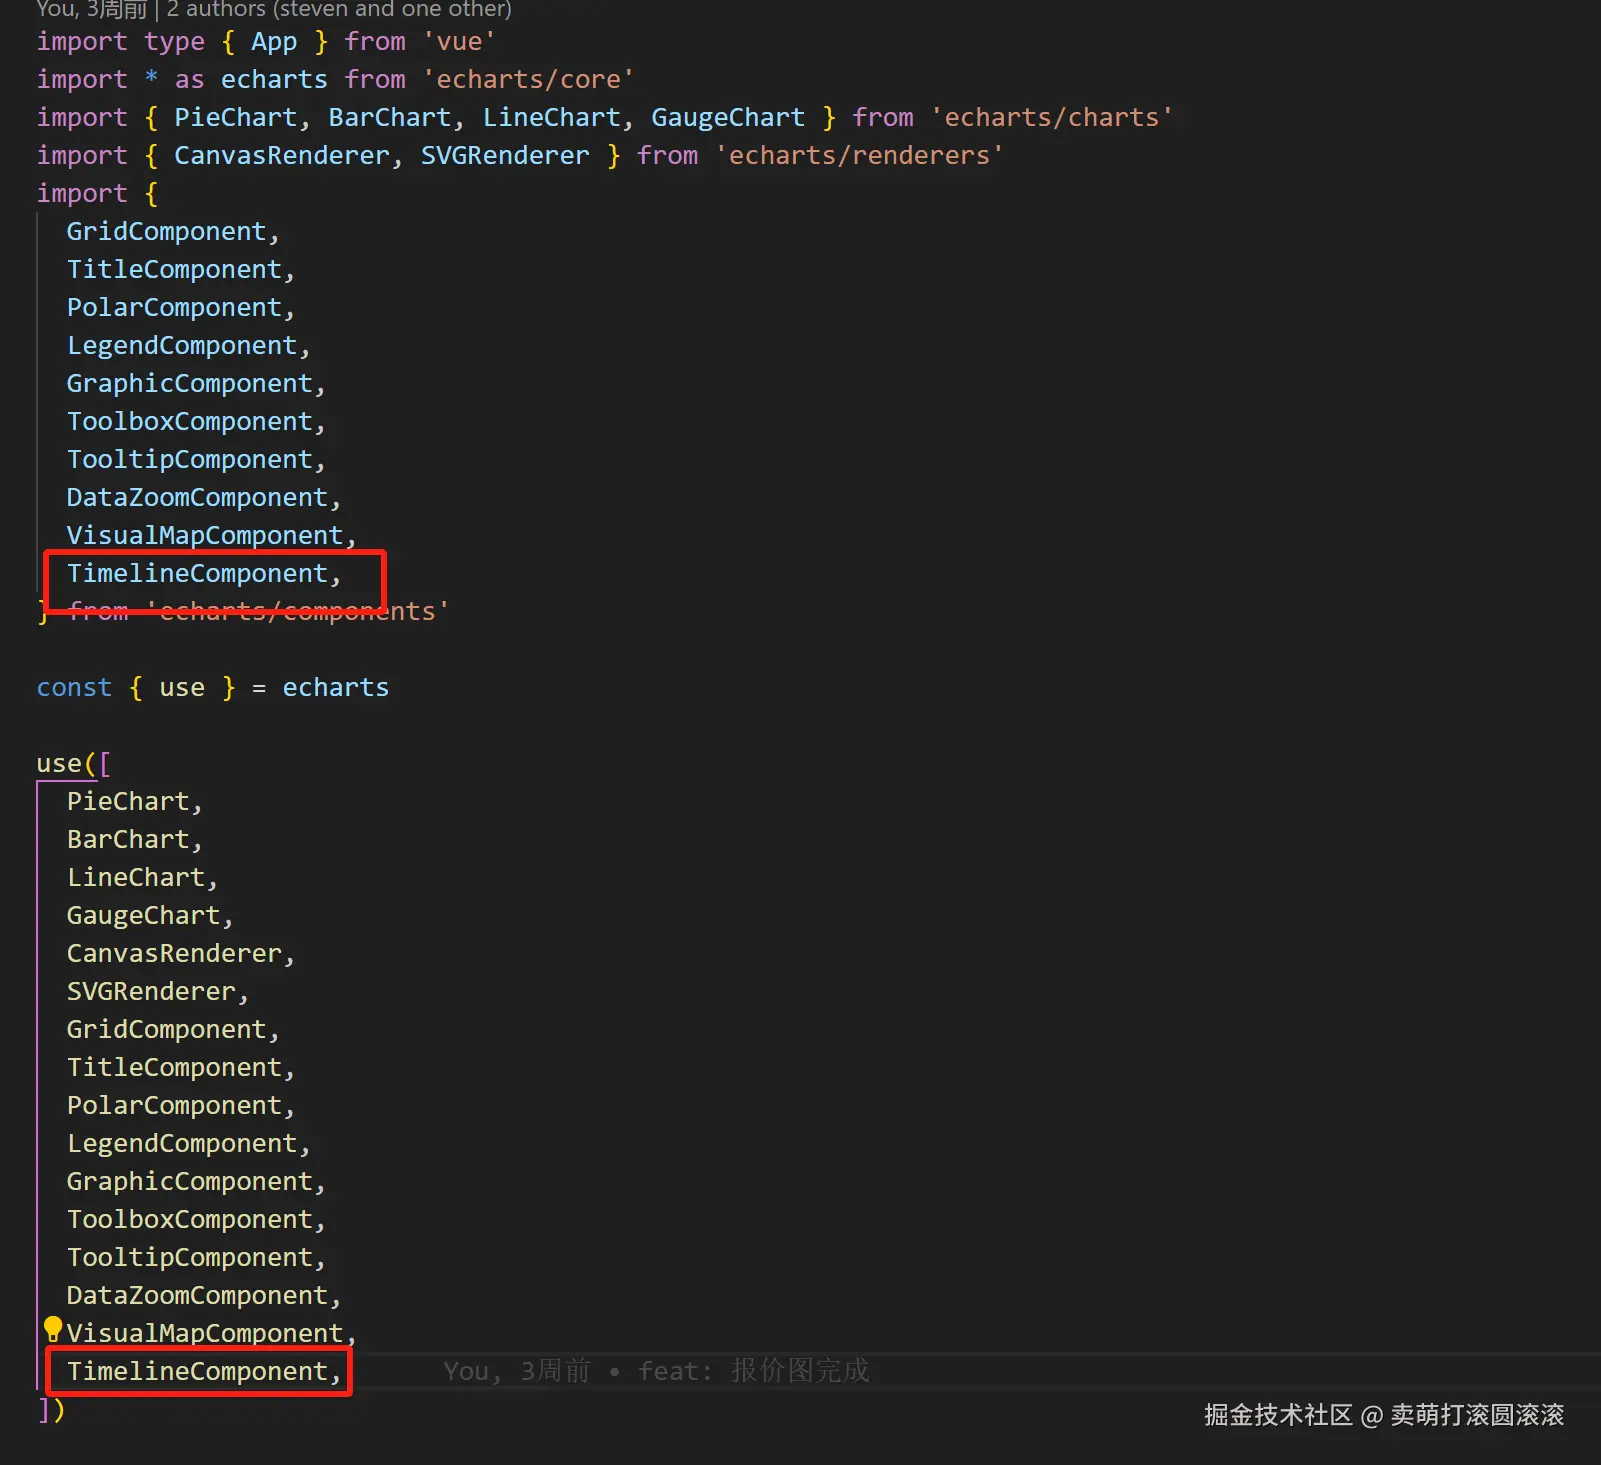
先在@/plugins/echarts.ts的文件中加入时间轴的组件
封装chartLine的组件
<script setup lang="ts">
  import { type PropType, ref, computed, watch, nextTick } from 'vue'
  import { useDark, useECharts } from '@pureadmin/utils'

  const props = defineProps({
    data: {
      type: Array as PropType<Array<number>>,
      default: () => [],
    },
    color: {
      type: String,
      default: '#41b6ff',
    },
  })

  const { isDark } = useDark()

  const theme = computed(() => (isDark.value ? 'dark' : 'light'))

  const chartRef = ref()
  const { setOptions, getOption } = useECharts(chartRef, {
    theme,
    renderer: 'svg',
  })

  const getOptions: any = (val: any, currentIndex: any) => {
    const xAxisData = []
    val[currentIndex]?.detailData?.forEach((v: any) => {
      for (let i = 0; i < v.detailTotals.length; i++) {
        xAxisData.push(v.detailTotals[i].createTime)
      }
    })
    return {
      container: '.line-card',
      tooltip: {
        trigger: 'axis',
      },
      legend: {
        type: 'scroll',
        data: val[currentIndex]?.detailData?.map((v: any) => v.supplierName),
      },
      grid: {
        left: '3%',
        right: '4%',
        bottom: '20%',
        containLabel: true,
      },
      xAxis: {
        type: 'category',
        axisTick: {
          alignWithLabel: true,
        },
        data: [...new Set(xAxisData)]?.sort((a, b) => {
          return new Date(a).getTime() - new Date(b).getTime()
        }),
      },

      yAxis: {
        type: 'value',
      },
      series: val[currentIndex]?.detailData?.map((v: any) => ({
        name: v.supplierName,
        type: 'line',
        data: v.detailTotals?.map((item: any) => [item.createTime, item.total]),
      })),
    }
  }

  watch(
    () => props.data,
    async (val: any) => {
      if (val.length <= 0) {
        return
      }
      await nextTick() // 确保DOM更新完成后再执行
      let currentIndex = 0
      setOptions(
        {
          timeline: {
            axisType: 'category',
            autoPlay: false,
            playInterval: 2000,
            currentIndex: currentIndex,
            data: val?.map((v: any) => v.packageName),
          },
          ...getOptions(val, currentIndex),
        },
        {
          name: 'timelinechanged',
          callback: (params) => {
            currentIndex = params.currentIndex
            setOptions({
              ...getOptions(val, currentIndex),
              timeline: {
                ...getOption().timeline[0],
                currentIndex: currentIndex,
              },
            })
          },
        },
      )
    },
    {
      deep: true,
      immediate: true,
    },
  )
</script>

<template>
  <div ref="chartRef" style="width: 100%; height: 400px" />
</template>
使用
<script setup lang="ts">
  import ChartLine from './ChartLine.vue'
  import { ref} from 'vue'
  const chartData = ref<any>([])
</script>

<template>
    <ChartLine :data="chartData" />
</template>


