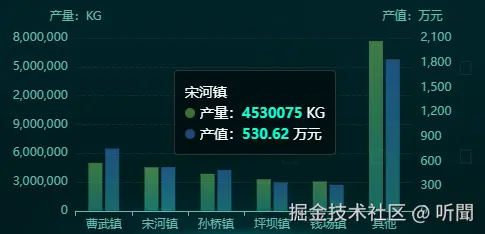
话不多说咱们直接上最终效果图
代码实现
{
grid: {
top: "20%",
bottom: "16%",
left: "14%",
right: "12%"
},
tooltip: {
axisPointer: {
type: "none",
show: false
},
trigger: "axis",
color: "#fff",
backgroundColor: "rgba(0,0,0,.5)",
fontSize: 14,
borderColor: "rgba(255, 255, 255, .16)",
textStyle: {
color: "#fff",
fontSize: 14
},
formatter: function(params: any) {
const res = `
<div>${params[0].name}</div>
<div><span style="display:inline-block;margin-right:5px;border-radius:100px;width:10px;height:10px;background-color:#83E76B73"></span>产量:<span style="color: #09ffd2;font-weight: bold;">${params[0].data}</span> KG</div>\n
<div><span style="display:inline-block;margin-right:5px;border-radius:100px;width:10px;height:10px;background-color:#408CF173"></span>产值:<span style="color: #09ffd2;font-weight: bold;">${params[1].data}</span> 万元</div>
`;
return res;
}
},
series: [
{
name: "产量",
type: "bar",
yAxisIndex: 0,
barWidth: "14px",
data: [],
itemStyle: {
color: new echarts.graphic.LinearGradient(0, 1, 0, 0, [
{
offset: 0,
color: "#35C3AA73"
},
{
offset: 1,
color: "#83E76B73"
}
])
}
},
{
name: "产值",
type: "bar",
yAxisIndex: 1,
barWidth: "14px",
data: [],
itemStyle: {
color: new echarts.graphic.LinearGradient(0, 1, 0, 0, [
{
offset: 0,
color: "#35C3C373"
},
{
offset: 1,
color: "#408CF173"
}
])
}
}
],
xAxis: {
type: "category",
data: [],
axisLine: {
lineStyle: {
color: "#61BCB1"
}
}
},
yAxis: [
{
type: "value",
name: "产量:KG",
splitLine: {
lineStyle: {
color: "#023735",
type: "dashed"
}
},
axisLine: {
lineStyle: {
color: "#61BCB1"
}
}
},
{
type: "value",
name: "产值:万元",
position: "right",
splitLine: {
show: false
},
axisLine: {
lineStyle: {
color: "#61BCB1"
}
}
}
]
}


