参考1:juejin.cn/post/719387…
参考2:juejin.cn/post/723252…
标签
<div id="app">
<div :style="{'width':echartsConf.width, 'height':echartsConf.height}" :id="echartsConf.cntainer"></div>
</div>
样式
html,
body {
width: 100vw;
height: 100vh;
overflow: hidden;
box-sizing: border-box;
margin: 0px;
}
body {
background: #032139;
padding: 20px;
display: flex;
}
#app {
margin: 0 auto;
}
#app {
pointer-events: all;
text-align: left;
box-sizing: border-box;
}
#app * {
box-sizing: border-box;
}
.toolTipTitle {
width: 100px;
color: #fff;
}
js
const DH_LeftShape = echarts.graphic.extendShape({
buildPath(ctx, shape) {
const { topBasicsYAxis, bottomYAxis, basicsXAxis } = shape;
const WIDTH = 15;
const OBLIQUE_ANGLE_HEIGHT = 3.6;
const p1 = [basicsXAxis - WIDTH, topBasicsYAxis - OBLIQUE_ANGLE_HEIGHT];
const p2 = [basicsXAxis - WIDTH, bottomYAxis];
const p3 = [basicsXAxis, bottomYAxis];
const p4 = [basicsXAxis, topBasicsYAxis];
ctx.moveTo(p1[0], p1[1]);
ctx.lineTo(p2[0], p2[1]);
ctx.lineTo(p3[0], p3[1]);
ctx.lineTo(p4[0], p4[1]);
},
});
const DH_RightShape = echarts.graphic.extendShape({
buildPath(ctx, shape) {
const { topBasicsYAxis, bottomYAxis, basicsXAxis } = shape;
const WIDTH = 15;
const OBLIQUE_ANGLE_HEIGHT = 3.6;
const p1 = [basicsXAxis, topBasicsYAxis];
const p2 = [basicsXAxis, bottomYAxis];
const p3 = [basicsXAxis + WIDTH, bottomYAxis];
const p4 = [basicsXAxis + WIDTH, topBasicsYAxis - OBLIQUE_ANGLE_HEIGHT];
ctx.moveTo(p1[0], p1[1]);
ctx.lineTo(p2[0], p2[1]);
ctx.lineTo(p3[0], p3[1]);
ctx.lineTo(p4[0], p4[1]);
},
});
const DH_TopShape = echarts.graphic.extendShape({
buildPath(ctx, shape) {
const { topBasicsYAxis, basicsXAxis } = shape;
const WIDTH = 15;
const OBLIQUE_ANGLE_HEIGHT = 3.6;
const p1 = [basicsXAxis, topBasicsYAxis];
const p2 = [basicsXAxis + WIDTH, topBasicsYAxis - OBLIQUE_ANGLE_HEIGHT];
const p3 = [basicsXAxis, topBasicsYAxis - OBLIQUE_ANGLE_HEIGHT * 2];
const p4 = [basicsXAxis - WIDTH, topBasicsYAxis - OBLIQUE_ANGLE_HEIGHT];
ctx.strokeStyle = 'rgba(255,255,255,1)';
ctx.beginPath();
ctx.moveTo(p1[0], p1[1]);
ctx.lineTo(p2[0], p2[1]);
ctx.lineTo(p3[0], p3[1]);
ctx.lineTo(p4[0], p4[1]);
ctx.closePath();
},
});
echarts.graphic.registerShape('DH_LeftShape', DH_LeftShape);
echarts.graphic.registerShape('DH_RightShape', DH_RightShape);
echarts.graphic.registerShape('DH_TopShape', DH_TopShape);
function DH_GetColumnRenderItem(params, api) {
const basicsCoord = api.coord([api.value(0), api.value(1)]);
const topBasicsYAxis = basicsCoord[1];
const basicsXAxis = basicsCoord[0];
const bottomYAxis = api.coord([api.value(0), 0])[1];
let resColor;
if (Object.prototype.toString.call(api.style().fill) === '[object String]') {
resColor = api.style().fill;
} else {
resColor = api.style().fill.colorStops[0].color;
}
const animationSet = {
enterFrom: {
// 淡入
style: {
opacity: 0,
},
y: 20,
},
enterAnimation: {
duration: 1000,
delay: 300,
},
};
return {
type: 'group',
// 组合柱体
children: [
{
type: 'DH_LeftShape',
shape: {
topBasicsYAxis,
basicsXAxis,
bottomYAxis,
},
style: api.style(),
...animationSet,
},
{
type: 'DH_LeftShape',
shape: {
topBasicsYAxis,
basicsXAxis,
bottomYAxis,
},
style: {
// 新添加的渐变效果
fill: new echarts.graphic.LinearGradient(1, 0, 1, 1, [
{
offset: 0,
color: 'rgba(255,255,255, 0.1)',
},
{
offset: 0.1,
color: 'rgba(255,255,255,0.1)',
},
{
offset: 1,
color: 'rgba(155,155,155,0)',
},
]),
},
...animationSet,
},
{
type: 'DH_RightShape',
shape: {
topBasicsYAxis,
basicsXAxis,
bottomYAxis,
},
style: api.style(),
...animationSet,
},
{
type: 'DH_TopShape',
shape: {
topBasicsYAxis,
basicsXAxis,
bottomYAxis,
},
style: {
...api.style(),
fill: resColor,
// stroke: resColor, // 设置线条颜色为白色
// lineWidth: 0.5, // 设置线条粗细,单位为像素
// lineDash: [0.5, 1], // 设置虚线样式,数组中的值分别表示实线和虚线的长度
},
...animationSet,
},
],
};
}
new Vue({
el: '#app',
data() {
return {
colorList: [
[
{
offset: 0,
color: 'rgba(203,144,45,1)',
},
{
offset: 1,
color: 'rgba(203,144,45,0.03)',
},
],
[
{
offset: 0,
color: 'rgba(65,205,58,1)',
},
{
offset: 1,
color: 'rgba(65,205,58,0.03)',
},
],
[
{
offset: 0,
color: 'rgba(38,200,165,1)',
},
{
offset: 1,
color: 'rgba(38,200,165,0.03)',
},
],
[
{
offset: 0,
color: 'rgba(37,160,254,1)',
},
{
offset: 1,
color: 'rgba(37,160,254,0.03)',
},
],
[
{
offset: 0,
color: 'rgba(140,110,240,1)',
},
{
offset: 1,
color: 'rgba(140,110,240, 0.03)',
},
],
[
{
offset: 0,
color: 'rgba(37,144,249,1)',
},
{
offset: 1,
color: 'rgba(37,144,249, 0.03)',
},
],
[
{
offset: 0,
color: 'rgba(71,224,148,1)',
},
{
offset: 1,
color: 'rgba(71,224,148, 0.03)',
},
],
[
{
offset: 0,
color: 'rgba(216,155,249,1)',
},
{
offset: 1,
color: 'rgba(216,155,249, 0.03)',
},
],
[
{
offset: 0,
color: 'rgba(19,206,231,1)',
},
{
offset: 1,
color: 'rgba(19,206,231, 0.03)',
},
],
],
echartsConf: {
width: '532px',
height: '277px',
cntainer: 'barEcahrts' + new Date().getTime(),
instantiation: '',
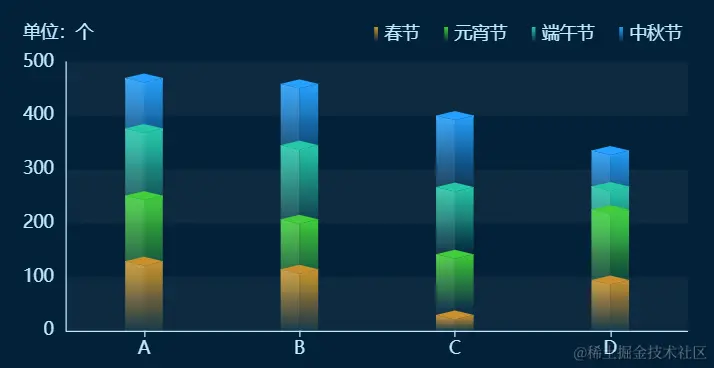
yUnits: ['个'],
xScale: ['A', 'B', 'C', 'D'],
data: [
{
name: '春节',
data: [121, 106, 21, 86],
},
{
name: '元宵节',
data: [122, 93, 113, 131],
},
{
name: '端午节',
data: [125, 138, 125, 43],
},
{
name: '中秋节',
data: [94, 114, 133, 67],
},
],
options: '',
},
};
},
mounted() {
this.duplicateColor_ = this.duplicateColor();
this.initEchartsAndUpdate();
},
computed: {
duplicateColor() {
return (dataLength) => {
let colorList = [...this.colorList];
let time = Math.ceil(dataLength / colorList.length);
if (time > 1) {
for (let i = 1; i < time; i++) {
colorList.push(...this.colorList);
}
}
return colorList;
};
},
},
methods: {
getlegendData(lables, resultColor) {
const data = [];
lables.forEach((item, index) => {
data.push({
name: item.name,
itemStyle: {
color: new echarts.graphic.LinearGradient(
0,
0,
0,
1,
resultColor[index]
),
},
});
});
return data;
},
getRendererData(targetData, maxLength) {
let rendergraphData = [];
targetData.reduce(
(lastV, nowV) => {
let resObj = {
name: nowV.name,
data: [],
colorOffset: 0,
};
let nowData = nowV.data;
let oldData = lastV.data;
let offsetNum = 0;
for (let i = 0; i < maxLength; i++) {
let a = Number(nowData[i] || '0');
let b = Number(oldData[i] || '0');
let sum = a + b;
if (sum - a) {
offsetNum += Number((a / sum).toFixed(2));
}
resObj.data.push(sum);
}
if (offsetNum) {
let finalOffset = Number((offsetNum / maxLength).toFixed(2));
resObj.colorOffset = finalOffset + 0.12;
}
rendergraphData.push(resObj);
return resObj;
},
{
name: '--',
data: [],
}
);
console.log(rendergraphData);
return rendergraphData;
},
setColorOffset(targetColors, targetData) {
let colorsUpdateOffset = JSON.parse(JSON.stringify(targetColors));
colorsUpdateOffset.forEach((item, index) => {
if (targetData[index]?.colorOffset) {
let color_ = item[0].color.split(',');
let endDiaphaneity = 0 + ')';
color_[color_.length - 1] = endDiaphaneity;
let finalColor = color_.join(',');
item.push({
offset: targetData[index].colorOffset,
color: finalColor,
});
}
});
return colorsUpdateOffset;
},
getTooltipPopup(params, targetData) {
let str = params[0].name + '<br/>';
params.forEach((item) => {
let x = item.seriesIndex;
let y = item.dataIndex;
str +=
item.marker +
item.seriesName +
':' +
targetData[x].data[y] +
'<br/>';
});
return str;
},
initEchartsAndUpdate: function () {
let that = this;
let echartsConf = this.echartsConf;
if (echartsConf.instantiation) {
echartsConf.instantiation.dispose &&
echartsConf.instantiation.dispose();
echartsConf.instantiation = null;
}
if (
!echartsConf.xScale &&
!Array.isArray(echartsConf.xScale) &&
!echartsConf.xScale.length
) {
console.error('无数据');
return;
}
echartsConf.instantiation = echarts.init(
document.getElementById(echartsConf.cntainer)
);
let resultColor = Object.freeze(
that.duplicateColor(echartsConf.data.length)
);
const maxLength = echartsConf.data.reduce((lastV, nowV) => {
return Math.max(nowV?.data?.length || 0, lastV);
}, 0);
let rendergraphData = this.getRendererData(echartsConf.data, maxLength);
let colorsUpdateOffset = this.setColorOffset(resultColor, rendergraphData);
echartsConf.options = {
color: resultColor,
tooltip: {
show: true,
trigger: 'axis',
formatter: (params) => {
return this.getTooltipPopup(params, echartsConf.data);
},
backgroundColor: 'RGBA(0, 49, 85, 0.5)',
backgroundColor: 'RGBA(0, 49, 85, 0.5)',
borderColor: 'rgba(0, 151, 251, 0)',
confine: true,
borderRadius: 2,
textStyle: {
color: '#BCE9FC',
fontSize: 18,
align: 'left',
},
},
grid: {
left: '0px',
top: '40px',
right: '0px',
bottom: '0px',
containLabel: true,
},
xAxis: {
type: 'category',
data: echartsConf.xScale,
axisTick: {
show: true,
alignWithLabel: true,
},
axisLabel: {
color: '#BFEBFF',
fontSize: 14,
fontWeight: 400,
fontFamily: '微软雅黑',
interval: 0,
formatter: function (params) {
var val = '';
if (params.length > 6) {
val = params.substr(0, 6) + '...';
return val;
} else {
return params;
}
},
},
axisLine: {
lineStyle: {
color: '#BFEBFF',
width: 1,
},
},
},
graphic: [
{
type: 'text',
left: '0px',
top: '10px',
style: {
text: `单位:${echartsConf.yUnits[0]}`,
textAlign: 'left',
fill: '#BFEBFF',
fontSize: 14,
fontFamily: '微软雅黑',
},
enterFrom: {
style: { opacity: 0 },
x: 0,
},
},
],
yAxis: {
type: 'value',
splitLine: {
show: false,
lineStyle: {
type: 'dashed',
color: '#BFEBFF',
},
},
splitArea: {
show: true,
areaStyle: {
color: ['rgba(255,255,255,0.04)', 'transparent'],
},
},
axisLine: {
show: true,
lineStyle: {
color: '#BFEBFF',
width: 1,
},
},
axisLabel: {
color: '#BFEBFF',
fontSize: 14,
fontFamily: '微软雅黑',
interval: 0,
margin: 10,
textStyle: {
align: 'right',
},
},
},
legend: {
width: 460,
orient: 'horizontal',
right: '0px',
top: '4px',
bottom: 'middle',
icon: 'rect',
itemHeight: 12,
itemWidth: 3,
itemGap: 20,
selectedMode: false,
itemStyle: {},
textStyle: {
width: 80,
overflow: 'break',
lineHeight: 18,
color: '#BFEBFF',
fontSize: 14,
fontFamily: '微软雅黑',
shadowColor: '#000000',
shadowBlur: 0,
shadowOffsetX: 0,
shadowOffsetY: 2,
},
data: this.getlegendData(echartsConf.data, resultColor),
},
series: rendergraphData.map((item, index) => {
return {
z: maxLength - index,
type: 'custom',
...item,
renderItem: DH_GetColumnRenderItem,
itemStyle: {
color: () => {
return new echarts.graphic.LinearGradient(
0,
0,
0,
1,
colorsUpdateOffset[index]
);
},
},
};
}),
};
echartsConf.instantiation.setOption(echartsConf.options);
window.onresize = echartsConf.instantiation.resize;
},
},
});
演示地址:code.juejin.cn/pen/7275962…


