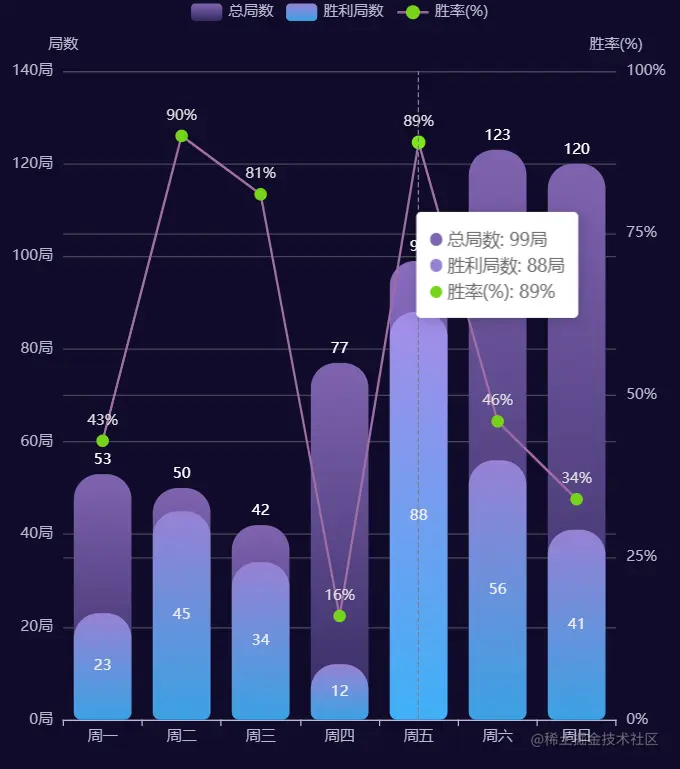
效果图
代码
- 复制粘贴即可使用
- 笔者这用的是vue-echarts,省去了一些操作
- echarts的配置项挺多的,记录一下吧,忘了的时候回来看看
- 话不多说,看代码
<template>
<div>
<v-chart theme="dark" :option="option" autoresize></v-chart>
</div>
</template>
<script setup>
import VChart from "vue-echarts";
import * as echarts from "echarts";
const xData = ['周一', '周二', '周三', '周四', '周五', '周六', '周日']
const yData1 = [53, 50, 42, 77, 99, 123, 120]
const yData2 = [23, 45, 34, 12, 88, 56, 41]
const yData3 = yData1.map((item, index) => {
let percent = (yData2[index] / item).toFixed(2)
return Number(percent) * 100
})
const yData1GradientColor = [
{
offset: 0,
color: '#8063B0'
},
{
offset: 1,
color: '#342A61'
}
]
const yData2GradientColor = [
{
offset: 0,
color: '#9781D4'
},
{
offset: 1,
color: '#3BA1E3'
}
]
const option = {
tooltip: {
trigger: 'axis',
formatter: function (params) {
let list = []
let listItem = ''
params.forEach((item) => {
let unitValue = item.seriesType == 'bar' ? item.value + '局' : item.value + '%'
list.push(item.marker + '' + item.seriesName + ': ' + unitValue)
})
listItem = list.join('<br/>')
return '<div>' + listItem + '</div>'
}
},
legend: {
orient: 'horizontal',
x: 'center',
y: 'top',
padding: 6,
},
xAxis: {
type: 'category',
data: xData
},
yAxis: [
{
type: 'value',
name: '局数',
yAxisIndex: 0,
axisLabel: {
formatter: "{value}局",
},
},
{
type: 'value',
name: "胜率(%)",
min: 0,
max: 100,
interval: 25,
axisLabel: {
formatter: "{value}%",
},
},
],
series: [
{
type: 'bar',
name: '总局数',
data: yData1,
label: {
show: true,
position: 'top',
color: '#fff'
},
itemStyle: {
borderRadius: [20, 20, 6, 6],
color: new echarts.graphic.LinearGradient(0, 0, 0, 1, yData1GradientColor),
}
},
{
type: 'bar',
name: "胜利局数",
data: yData2,
label: {
show: true,
color: '#eee'
},
barGap: "-100%",
itemStyle: {
borderRadius: [20, 20, 6, 6],
color: new echarts.graphic.LinearGradient(0, 0, 0, 1, yData2GradientColor),
}
},
{
type: 'line',
name: '胜率(%)',
data: yData3,
yAxisIndex: 1,
symbolSize: 10,
itemStyle: {
color: '#74D318',
},
lineStyle: {
color: "#946496",
},
label: {
show: true,
color: '#ddd',
formatter: '{c}%'
},
}
]
};
</script>
<style scoped>
.echarts {
width: 36vw;
height: 90vh;
}
</style>


