<!DOCTYPE html>
<html lang="en">
<head>
<meta charset="UTF-8">
<meta http-equiv="X-UA-Compatible" content="IE=edge">
<meta name="viewport" content="width=device-width, initial-scale=1.0">
<title>Sankey Diagram</title>
<script src="https://cdn.jsdelivr.net/npm/echarts@latest/dist/echarts.min.js"></script>
<style>
* {
margin: 0;
padding: 0;
}
#sankeyContainer {
width: 100vw;
height: 100vh;
}
</style>
</head>
<body>
<div id="sankeyContainer"></div>
</body>
</html>
<script>
var kvDisplay = (key, value) => `${key}\n${value}亿`
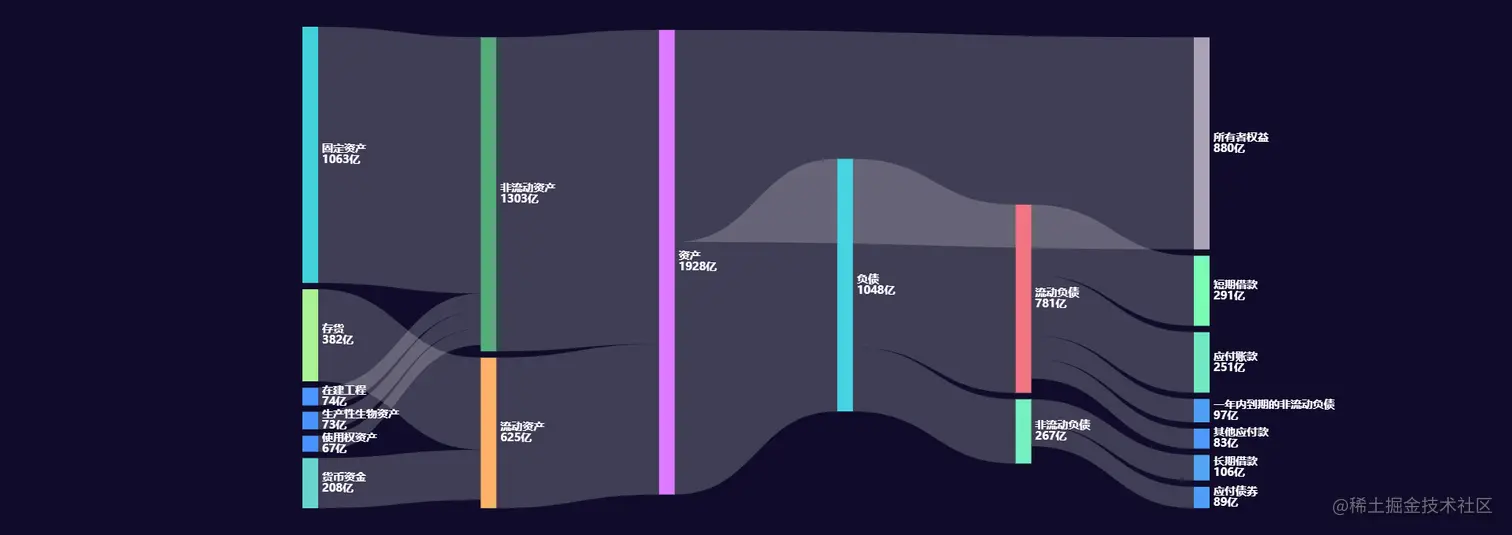
var sankeyArr =
[
['货币资金', '流动资产', 208],
['存货', '流动资产', 382],
['固定资产', '非流动资产', 1063],
['在建工程', '非流动资产', 74],
['生产性生物资产', '非流动资产', 73],
['使用权资产', '非流动资产', 67],
['流动资产', '资产', 625],
['非流动资产', '资产', 1303],
['资产', '负债', 1048],
['资产', '所有者权益', 880],
['负债', '流动负债', 781],
['负债', '非流动负债', 267],
['流动负债', '短期借款', 291],
['流动负债', '应付账款', 251],
['流动负债', '其他应付款', 83],
['流动负债', '一年内到期的非流动负债', 97],
['非流动负债', '长期借款', 106],
['非流动负债', '应付债券', 89],
]
</script>
<script>
var color = 'white',
myChart = echarts.init(document.getElementById('sankeyContainer'), 'dark'),
optData = [],
optLinks = [],
leftLine = sankeyArr[0][1],
nameObj = {};
for (let sanKeyItem of sankeyArr) {
let [source, target, value] = sanKeyItem;
if (target === leftLine) {
nameObj[source] = 'left'
}
if (!(source in nameObj)) {
nameObj[source] = '';
}
if (!(target in nameObj)) {
nameObj[target] = '';
}
optLinks.push({ source, target, value })
}
Object.keys(nameObj).forEach(key => {
if (nameObj[key] === 'left') {
optData.push({
name: key,
})
} else {
optData.push({ name: key })
}
});
console.log(optData, optLinks);
var option = {
toolbox: { feature: { saveAsImage: {} } },
series: {
type: 'sankey',
left: '20%',
data: optData,
links: optLinks,
orient: 'horizontal',
label: {
show: true,
position: 'right',
fontSize: 14,
fontWeight: 'bold',
color: color,
formatter: (params) => kvDisplay(params.data.name, params.value)
},
nodeGap: 8,
nodeWidth: 20,
nodeAlign: 'justify',
lineStyle: {
color: color,
curveness: .5
},
}
};
myChart.setOption(option);
</script>


