<!DOCTYPE html>
<html lang="en">
<head>
<title>Sankey Diagram</title>
<script src="https://www.gstatic.com/charts/loader.js"></script>
</head>
<body>
<div id="sankey_diagram"></div>
</body>
</html>
<script>
google.charts.load('current', { 'packages': ['sankey'] });
google.charts.setOnLoadCallback(drawChart);
function drawChart() {
var data = new google.visualization.DataTable();
data.addColumn('string', 'From');
data.addColumn('string', 'To');
data.addColumn('number', 'Weight');
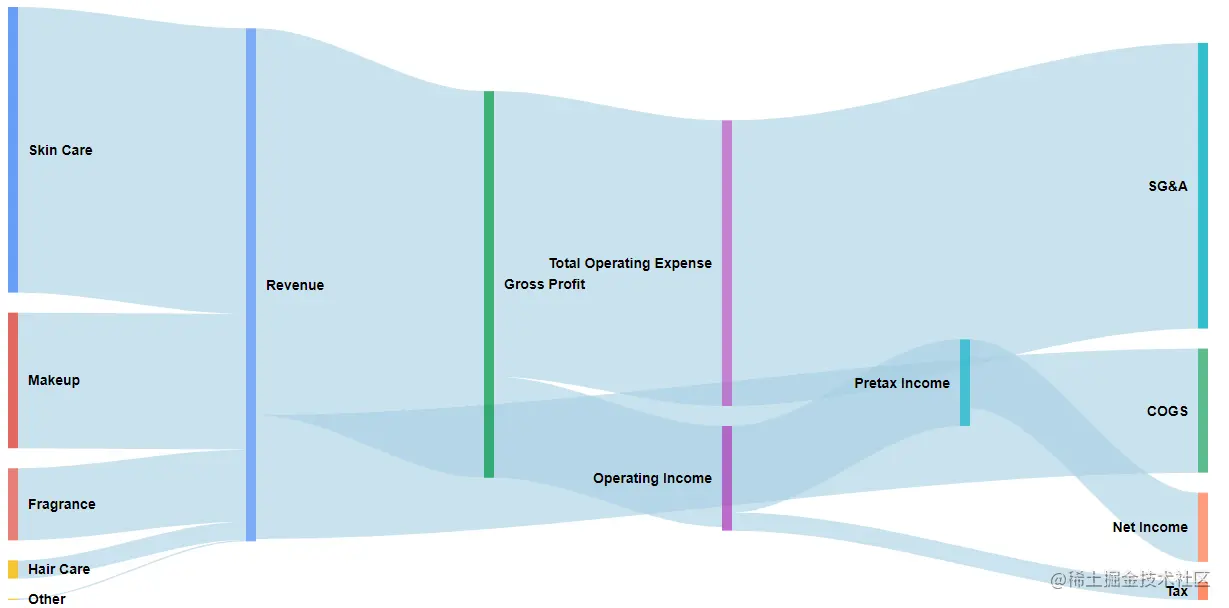
data.addRows([
['Skin Care', 'Revenue', 9.9],
['Makeup', 'Revenue', 4.7],
['Fragrance', 'Revenue', 2.5],
['Hair Care', 'Revenue', 0.631],
['Other', 'Revenue', 0.049],
['Revenue', 'Gross Profit', 13.4],
['Revenue', 'COGS', 4.3],
['Gross Profit', 'Operating Income', 3.5],
['Gross Profit', 'Total Operating Expense', 9.9],
['Total Operating Expense', 'SG&A', 9.9],
['Operating Income', 'Pretax Income', 3],
['Operating Income', 'Tax', 0.628],
['Pretax Income', 'Net Income', 2.4],
]);
var colors = ['#a6cee3', '#b2df8a', '#fb9a99', '#fdbf6f', '#cab2d6', '#ffff99', '#1f78b4', '#33a02c'];
var options = {
width: 1200,
height: 600,
sankey: {
node: {
width: 10,
nodePadding: 20,
labelPadding: 10,
label:{
fontSize: 14,
bold: true,
}
},
link: {
color: {
fill: '#a6cee3'
}
}
}
};
var chart = new google.visualization.Sankey(document.getElementById('sankey_diagram'));
chart.draw(data, options);
}
</script>


