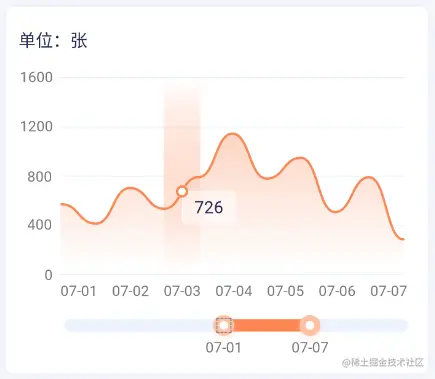
实现效果
echarts图表封装
<template>
<div class="mychart" ref="chart" id="id"></div>
</template>
<script>
import * as echarts from 'echarts'
export default {
data() {
return {
mychart: null,
time: null
}
},
mounted() {
this.chart()
},
props: {
datax: {
type: Array,
required: true
},
datay: {
type: Array,
required: true
},
imgUrl: {
type: String,
default:'cdn图片路径'
},
color: {
type: String,
default: '#fb8753'
},
gradientColor: {
type: Array,
required: true
},
unit: {
type: String,
default: '单位/张'
},
unit1: {
type: String,
default: '张'
},
start: {
type: Number,
default: 30
},
end: {
type: Number,
default: 75
}
},
watch: {
datax() {
this.chart()
},
datay() {
this.chart()
},
},
methods: {
lunboEcharts(echartsId, dataOption) {
let currentIndex = -1
if (this.time) clearInterval(this.time)
this.time = setInterval(() => {
const dataLen = dataOption.series[0].data.length
echartsId.dispatchAction({
type: 'downplay',
seriesIndex: 0,
dataIndex: currentIndex
})
currentIndex = (currentIndex + 1) % dataLen
echartsId.dispatchAction({
type: 'highlight',
seriesIndex: 0,
dataIndex: currentIndex
})
echartsId.dispatchAction({
type: 'showTip',
seriesIndex: 0,
dataIndex: currentIndex
})
}, 1000)
},
chart() {
const option = {
tooltip: {
extraCssText: 'z-index: 2000',
trigger: 'axis',
axisPointer: {
type: 'shadow',
label: {
formatter: ' ',
margin: 0,
color: '#252B50',
fontSize: '14'
},
shadowStyle: {
color: new echarts.graphic.LinearGradient(
0,
0,
0,
1,
this.gradientColor
),
width: 'auto'
}
},
backgroundColor: 'rgba(255,255,255,0.5)',
formatter: (params) => {
let res = `${params[0].name} <br/>`
for (const item of params) {
if (item.value !== 0 && item.value !== '0.00') {
return (res += `<span style="background: ${item.color}; height:10px; width: 10px; border-radius: 50%;display: inline-block;margin-right:10px;"></span> ${item.value} ${this.unit1}<br/>`)
}
}
}
},
title: {
subtext: '( 曲线图缩放、左右拖动,更精彩!)',
left: 'right',
subtextStyle: {
color: '#ff0000'
},
top: 15
},
dataZoom: [
{
type: 'inside',
show: false,
xAxisInex: 0,
start: this.start,
end: this.end
},
{
type: 'slider',
show: true,
height: 10,
borderColor: 'transparent',
backgroundColor: '#edf3ff',
dataBackground: {
lineStyle: {
color: '#edf3ff'
},
areaStyle: {
color: '#edf3ff'
}
},
handleIcon: `image://${this.imgUrl}`,
handleColor: this.color,
handleSize: 28,
handleStyle: {
borderColor: this.color,
shadowBlur: 4,
shadowOffsetX: 1,
shadowOffsetY: 1,
shadowColor: this.color,
borderCap: 'round'
},
fillerColor: this.color,
start: this.start,
end: this.end,
filterMode: 'none',
moveHandleSize: 0
}
],
xAxis: {
data: this.datax
},
grid: {
left: '55'
},
yAxis: {
show: true,
name: this.unit,
nameTextStyle: {
fontSize: 14,
padding: [0, 15, 4, 0]
}
},
series: [
{
label: {
position: 'right',
normal: {
show: true,
formatter: function (params) {
if (params.value > 0) {
return params.value
} else {
return ''
}
}
}
},
offset: '-8',
type: 'line',
data: this.datay,
itemStyle: {
color: this.color
},
smooth: true,
lineStyle: {
color: this.color
},
symbol: 'circle',
symbolSize: 5,
areaStyle: {
color: new echarts.graphic.LinearGradient(0, 0, 0, 1, [
{
offset: 0,
color: this.color
},
{
offset: 1,
color: 'rgb(255, 255, 255)'
}
])
}
}
]
}
let mychart = this.$echarts.getInstanceByDom(this.$refs.chart)
if (mychart == null) {
this.myChart = this.$echarts.init(this.$refs.chart)
mychart = this.$echarts.init(this.$refs.chart)
}
mychart.clear()
mychart.setOption(option, true)
window.onresize = () => {
mychart.resize()
}
const sliderZoom = mychart._componentsViews.find(
(view) => view.type === 'dataZoom.slider'
)
sliderZoom._displayables.handleLabels[0].x = 40
sliderZoom._displayables.handleLabels[0].y = 15
sliderZoom._displayables.handleLabels[1].x = -40
sliderZoom._displayables.handleLabels[1].y = 15
}
}
}
</script>
<style scoped>
.mychart {
width: 100%;
height: 100%;
}
</style>
echarts使用
<myEcharts
    class="proCharts"
    :datax="datax"
    :datay="datay"
    :imgUrl="imgUrl"
    :color="color"
    :gradientColor="gradientColor"
    :unit="unit"
    :unit1="unit1"
    :start="start"
    :end="end"
></myEcharts>

import myEcharts from '@/components/echarts.vue'
components: { myEcharts },


