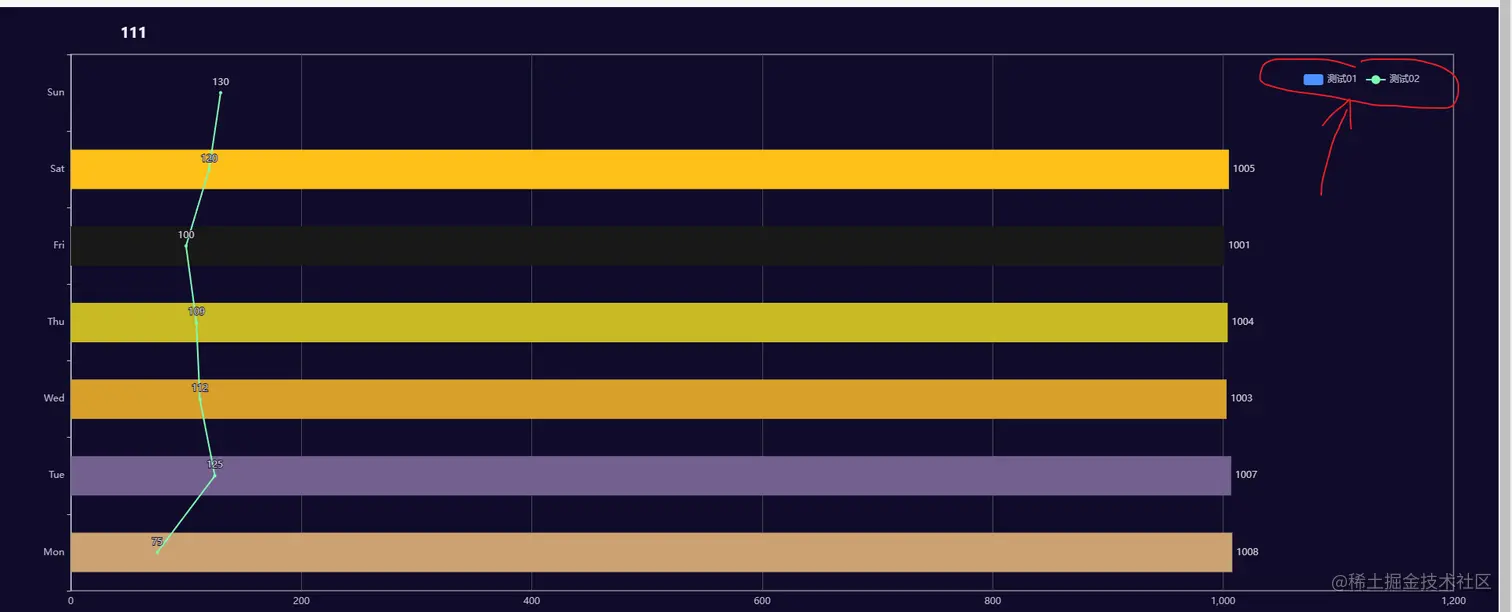
这是原本的效果
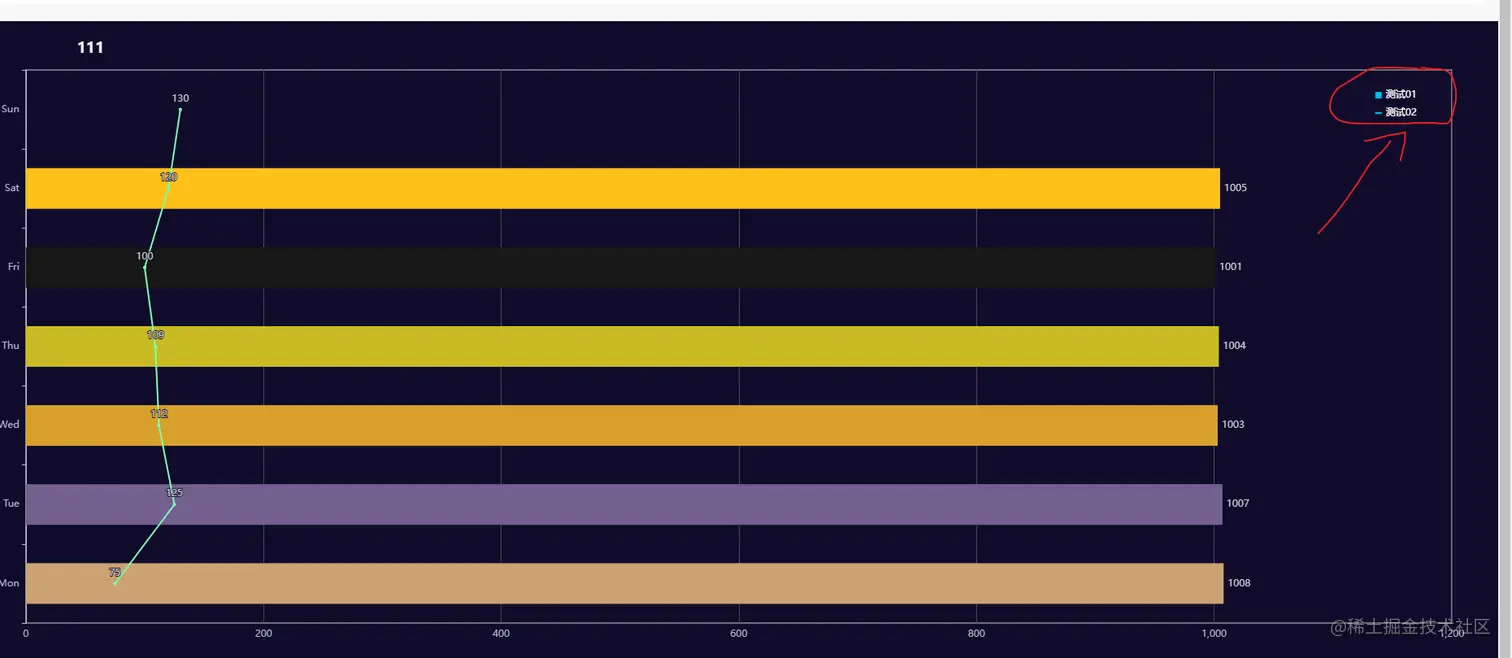
这是我们修改完之后的效果
代码如下
<template>
<div ref="axis" style="height: 800px;">
</div>
</template>
<script lang="ts" setup>
import { ref } from "vue";
import { onMounted } from 'vue';
import { inject } from 'vue';
const axis = ref(null)
const echarts = inject("echarts") as any;
let echartsValue = null as any;
const legendSvg = {
rect: 'path://M-0.000,-0.000 L10.000,-0.000 L10.000,10.000 L-0.000,10.000 L-0.000,-0.000 Z',
line: 'path://M-0.000,-0.000 L10.000,-0.000 L10.000,3.000 L-0.000,3.000 L-0.000,-0.000 Z'
}
const render = () => {
echartsValue = echarts.init(axis.value, 'dark');
const option = {
title: {
text: '111',
left: '150px',
top: '20px'
},
legend: {
top: "10%",
right: "5%",
show: true,
data: [{
name: '测试01',
icon: legendSvg.rect
}, {
name: '测试02',
icon: legendSvg.line
}],
orient: 'vertical',
y: 'center',
itemWidth: 8,
itemHeight: 8,
itemStyle: {
color: '#01bcee'
},
textStyle: {
color: '#fff',
fontSize: 12
}
},
xAxis: {
type: 'value',
},
yAxis: {
type: 'category',
data: ['Mon', 'Tue', 'Wed', 'Thu', 'Fri', 'Sat', 'Sun']
},
grid: {
show: true,
left: "3%",
right: "3%",
bottom: "5%",
containLabel: true,
},
tooltip: {
show: true,
trigger: "axis",
axisPointer: {
type: "shadow",
},
},
series: [
{
name: '测试01',
data: ['1008', '1007', '1003', '1004', '1001', '1005'],
type: 'bar',
barWidth: 50,
label: {
show: true,
position: 'right'
},
itemStyle: {
color: function (params: any) {
var colorList = ['#cca272', '#74608f', '#d7a02b', '#c8ba23', "#181818", "#ffc11a", "#337eef"];
return colorList[params.dataIndex]
},
}
},
{
name: '测试02',
data: [75, 125, 112, 109, 100, 120, 130],
type: 'line',
label: {
show: true
},
legendHoverLink: true
}
]
};
echartsValue.setOption(option);
echartsValue.resize();
}
window.addEventListener('resize', function () {
echartsValue && echartsValue.resize();
})
onMounted(() => {
render();
});
</script>
<style lang='scss' scoped>
</style>


