<!DOCTYPE html>
<html lang="zh-CN">
<head>
<meta charset="UTF-8" />
<meta http-equiv="X-UA-Compatible" content="IE=edge" />
<meta name="viewport" content="width=device-width, initial-scale=1.0" />
<title>Document</title>
<script src="https://cdn.staticfile.org/echarts/5.4.2/echarts.min.js"></script>
</head>
<body>
<div id="main" style="height: 700px; width: 700px"></div>
<script>
var chartDom = document.getElementById('main')
var myChart = echarts.init(chartDom)
var option
var dataStyle = {
normal: {
label: {
show: true,
color: '#fff',
fontSize: 18
},
labelLine: {
length: 40,
length2: 40
}
}
}
var labelShow = {
show: true,
color: '#fff',
fontSize: 15,
formatter: ['{d| {d}% }', '{b| {b} }'].join('\n'),
rich: {
d: {
fontSize: 15,
color: '#fff'
},
b: {
fontSize: 18,
color: '#fff'
}
}
}
var placeHolderStyle = {
normal: {
color: 'rgba(0,0,0,0)',
label: {
show: false
},
labelLine: {
show: false
}
},
emphasis: {
color: 'rgba(0,0,0,0)'
}
}
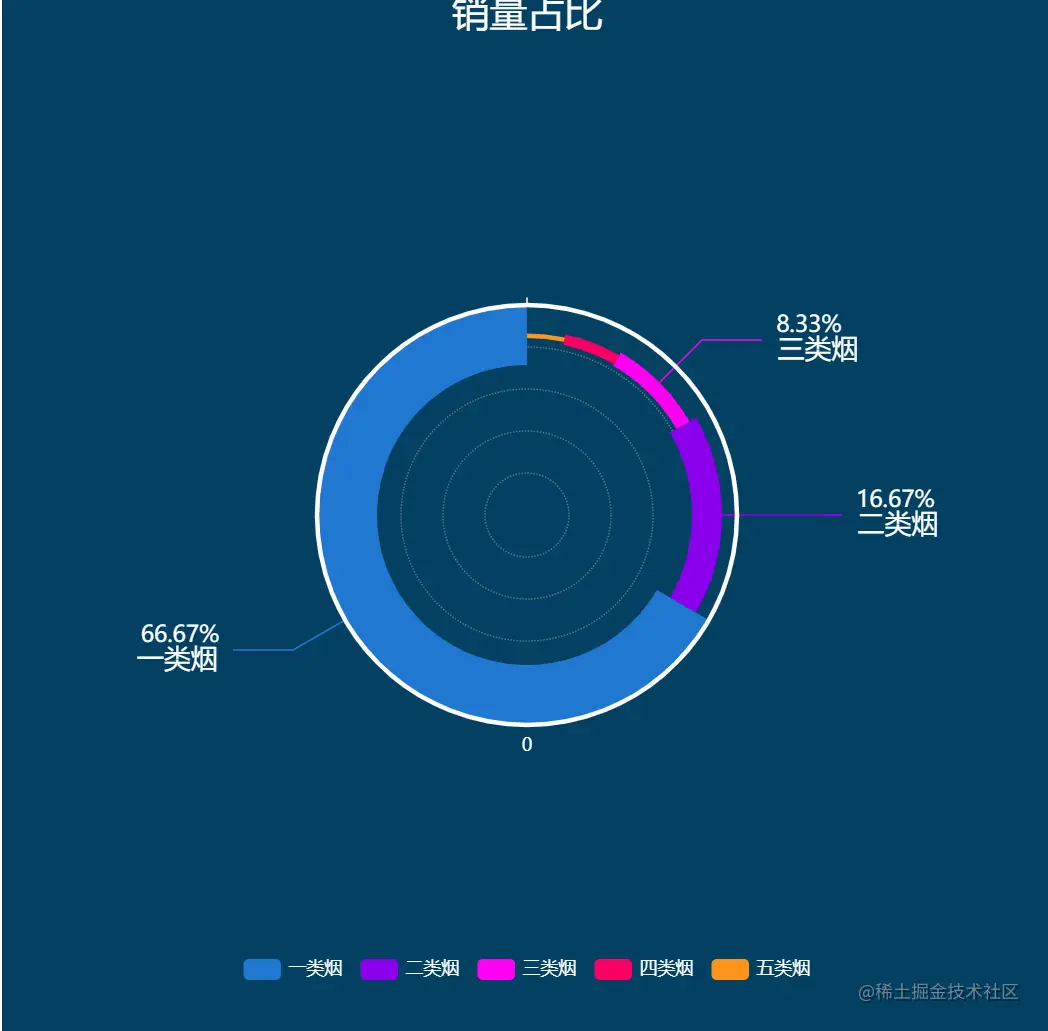
option = {
backgroundColor: '#044061',
title: {
text: '销量占比',
textStyle: {
fontSize: 25,
fontWeight: 'normal',
color: '#fff'
},
x: 'center'
},
color: ['#2078d1', '#8a00ec', '#ff00f3', '#fb0065', '#ff941b'],
tooltip: {
show: true,
formatter: '{b} <br/> {c} ({d}%)'
},
angleAxis: {
type: 'category',
z: 10,
axisLine: {
color: '#fff',
lineStyle: {
width: 3,
color: '#fff'
}
}
},
radiusAxis: {
axisTick: {
show: false
},
axisLabel: {
show: false,
color: '#fff'
},
axisLine: {
show: false,
color: '#fff',
lineStyle: {
color: '#fff'
}
},
splitLine: {
color: '#000',
lineStyle: {
type: 'dotted',
color: 'rgba(170,170,170,.5)'
}
}
},
polar: {
center: ['50%', '50%'],
radius: 140
},
legend: {
bottom: '5%',
textStyle: {
color: '#fff'
},
itemGap: 12,
data: ['一类烟', '二类烟', '三类烟', '四类烟', '五类烟']
},
series: [
{
name: 'Line 1',
type: 'pie',
clockWise: false,
radius: [100, 140],
itemStyle: dataStyle,
hoverAnimation: false,
data: [
{
value: 200,
name: '一类烟',
label: labelShow
},
{
value: 100,
name: '',
itemStyle: placeHolderStyle
}
]
},
{
name: 'Line 2',
type: 'pie',
clockWise: false,
radius: [110, 130],
itemStyle: dataStyle,
hoverAnimation: false,
data: [
{
value: 200,
name: '',
itemStyle: placeHolderStyle
},
{
value: 50,
name: '二类烟',
label: labelShow
},
{
value: 50,
name: '',
itemStyle: placeHolderStyle
}
]
},
{
name: 'Line 3',
type: 'pie',
clockWise: false,
hoverAnimation: false,
radius: [115, 125],
itemStyle: dataStyle,
data: [
{
value: 250,
name: '',
itemStyle: placeHolderStyle
},
{
value: 25,
name: '三类烟',
label: labelShow
},
{
value: 25,
name: '',
itemStyle: placeHolderStyle
}
]
},
{
name: 'Line 4',
type: 'pie',
clockWise: false,
hoverAnimation: false,
radius: [116, 123],
itemStyle: dataStyle,
data: [
{
value: 275,
name: '',
itemStyle: placeHolderStyle
},
{
value: 15,
name: '四类烟',
label: labelShow
},
{
value: 10,
name: '',
itemStyle: placeHolderStyle
}
]
},
{
name: 'Line 5',
type: 'pie',
clockWise: false,
hoverAnimation: false,
radius: [118, 121],
itemStyle: dataStyle,
data: [
{
value: 290,
name: '',
itemStyle: placeHolderStyle
},
{
value: 10,
name: '五类烟',
label: labelShow
}
]
},
{
type: 'bar',
data: [0],
coordinateSystem: 'polar',
name: '06a',
stack: 'a'
}
]
}
option && myChart.setOption(option)
</script>
</body>
</html>


