const offsetX = 20
const offsetY = 10
const CubeLeft = echarts.graphic.extendShape({
shape: {
x: 0,
y: 0
},
buildPath: function (ctx, shape) {
const xAxisPoint = shape.xAxisPoint
const c0 = [shape.x, shape.y]
const c1 = [shape.x - offsetX, shape.y - offsetY]
const c2 = [xAxisPoint[0] - offsetX, xAxisPoint[1] - offsetY]
const c3 = [xAxisPoint[0], xAxisPoint[1]]
ctx.moveTo(c0[0], c0[1]).lineTo(c1[0], c1[1]).lineTo(c2[0], c2[1]).lineTo(c3[0], c3[1]).closePath()
}
})
const CubeRight = echarts.graphic.extendShape({
shape: {
x: 0,
y: 0
},
buildPath: function (ctx, shape) {
const xAxisPoint = shape.xAxisPoint
const c1 = [shape.x, shape.y]
const c2 = [xAxisPoint[0], xAxisPoint[1]]
const c3 = [xAxisPoint[0] + offsetX, xAxisPoint[1] - offsetY]
const c4 = [shape.x + offsetX, shape.y - offsetY]
ctx.moveTo(c1[0], c1[1]).lineTo(c2[0], c2[1]).lineTo(c3[0], c3[1]).lineTo(c4[0], c4[1]).closePath()
}
})
const CubeTop = echarts.graphic.extendShape({
shape: {
x: 0,
y: 0
},
buildPath: function (ctx, shape) {
const c1 = [shape.x, shape.y]
const c2 = [shape.x + offsetX, shape.y - offsetY]
const c3 = [shape.x, shape.y - offsetX]
const c4 = [shape.x - offsetX, shape.y - offsetY]
ctx.moveTo(c1[0], c1[1]).lineTo(c2[0], c2[1]).lineTo(c3[0], c3[1]).lineTo(c4[0], c4[1]).closePath()
}
})
echarts.graphic.registerShape('CubeLeft', CubeLeft)
echarts.graphic.registerShape('CubeRight', CubeRight)
echarts.graphic.registerShape('CubeTop', CubeTop)
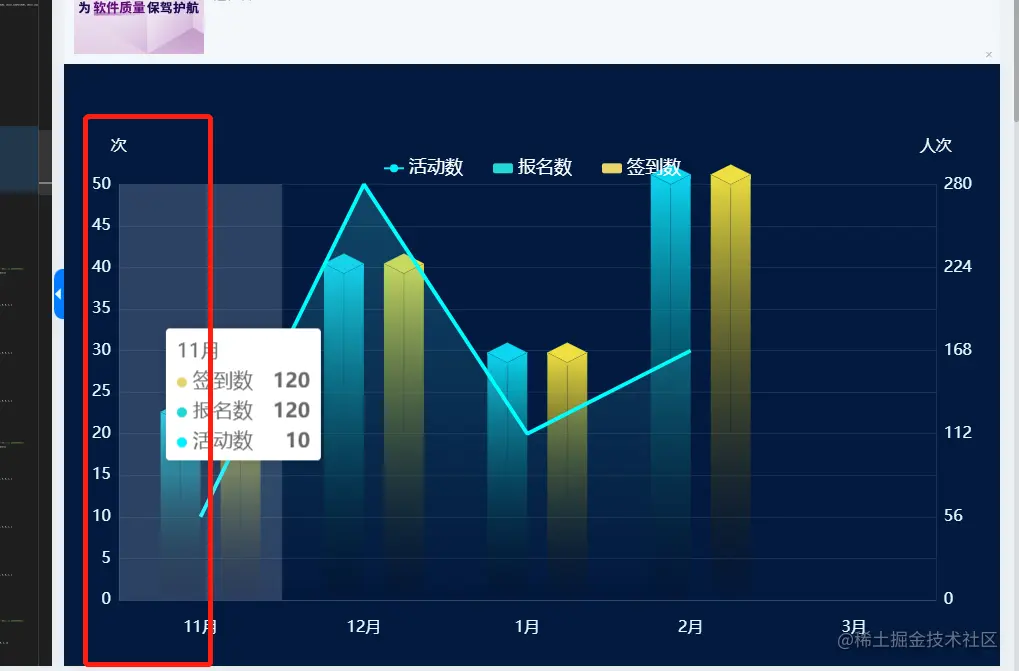
let yData = [120, 220, 160, 280]
let yData2 = [10, 50, 20, 30]
option = {
backgroundColor: '#031a40',
legend: {
show: true,
top: "15%",
itemGap: 30,
itemWidth: 20,
itemHeight: 10,
data: ["活动数", "报名数", "签到数"],
textStyle: {
fontSize: 18,
color: "#ffffff",
},
},
color: ['#E7D36B', '#26D6D7', '#43EFFF'],
tooltip: {
trigger: 'axis',
textStyle: {
fontSize: 20
},
axisPointer: {
type: 'shadow'
},
},
grid: {
top: "20%",
left: "3%",
right: "3%",
bottom: "5%",
containLabel: true,
},
xAxis: {
type: 'category',
data: ['11月', '12月', '1月', '2月', '3月'],
axisLine: {
show: true,
lineStyle: {
width: 1,
color: 'rgba(239, 247, 253, .1)'
}
},
axisTick: {
show: false
},
axisLabel: {
fontSize: 16,
color: "#E7FCFF",
margin: 20
},
},
yAxis: [{
type: 'value',
name: '次',
nameGap: 30,
nameTextStyle: {
color: "#ffffff",
fontWeight: 400,
fontSize: 16,
},
axisLine: {
show: true,
lineStyle: {
width: 1,
color: 'rgba(239, 247, 253, .1)'
}
},
splitLine: {
show: true,
lineStyle: {
color: 'rgba(239, 247, 253, .1)',
}
},
axisTick: {
show: false
},
axisLabel: {
fontSize: 16,
color: "#E7FCFF"
},
min: 0,
max: Math.ceil(Math.max.apply(null, yData2) / 5) * 5,
interval: Math.ceil(Math.max.apply(null, yData2) / 5)
},
{
type: 'value',
name: '人次',
nameGap: 30,
nameTextStyle: {
color: "#ffffff",
fontWeight: 400,
fontSize: 16,
},
axisLine: {
show: true,
lineStyle: {
width: 1,
color: 'rgba(239, 247, 253, .1)'
}
},
splitLine: {
show: !true,
lineStyle: {
color: 'rgba(239, 247, 253, .1)',
}
},
axisTick: {
show: false
},
axisLabel: {
fontSize: 16,
color: "#E7FCFF"
},
min: 0,
max: Math.ceil(Math.max.apply(null, yData) / 5) * 5,
interval: Math.ceil(Math.max.apply(null, yData) / 5)
}
],
series: [
{
name: "签到数",
type: 'custom',
yAxisIndex: 1,
renderItem: (params, api) => {
const location = api.coord([api.value(0), api.value(1)])
return {
type: 'group',
x: 40,
children: [
{
type: 'CubeLeft',
shape: {
api,
xValue: api.value(0),
yValue: api.value(1),
x: location[0],
y: location[1],
xAxisPoint: api.coord([api.value(0), 0])
},
style: {
fill: new echarts.graphic.LinearGradient(0, 0, 0, 1, [
{
offset: 0,
color: '#eedf40'
},
{
offset: 1,
color: 'rgba(0, 0, 0, 0.1)'
}
]),
stroke: 'rgba(3, 25, 63, .1)',
}
},
{
type: 'CubeRight',
shape: {
api,
xValue: api.value(0),
yValue: api.value(1),
x: location[0],
y: location[1],
xAxisPoint: api.coord([api.value(0), 0])
},
style: {
fill: new echarts.graphic.LinearGradient(0, 0, 0, 1, [
{
offset: 0,
color: '#eedf40'
},
{
offset: 1,
color: 'rgba(0, 0, 0, 0.1)'
}
]),
stroke: 'rgba(3, 25, 63, .1)',
}
},
{
type: 'CubeTop',
shape: {
api,
xValue: api.value(0),
yValue: api.value(1),
x: location[0],
y: location[1],
xAxisPoint: api.coord([api.value(0), 0])
},
style: {
fill: new echarts.graphic.LinearGradient(0, 0, 0, 1, [
{
offset: 0,
color: '#eedf40'
},
{
offset: 1,
color: '#eedf40'
}
]),
stroke: 'rgba(3, 25, 63, .1)',
}
}
]
}
},
data: yData
},
{
name: "报名数",
type: 'custom',
yAxisIndex: 1,
renderItem: (params, api) => {
const location = api.coord([api.value(0), api.value(1)])
return {
type: 'group',
x: -20,
children: [
{
type: 'CubeLeft',
shape: {
api,
xValue: api.value(0),
yValue: api.value(1),
x: location[0],
y: location[1],
xAxisPoint: api.coord([api.value(0), 0])
},
style: {
fill: new echarts.graphic.LinearGradient(0, 0, 0, 1, [
{
offset: 0,
color: '#0cd7f2'
},
{
offset: 1,
color: 'rgba(0, 0, 0, 0.1)'
}
]),
stroke: 'rgba(3, 25, 63, .1)',
}
},
{
type: 'CubeRight',
shape: {
api,
xValue: api.value(0),
yValue: api.value(1),
x: location[0],
y: location[1],
xAxisPoint: api.coord([api.value(0), 0])
},
style: {
fill: new echarts.graphic.LinearGradient(0, 0, 0, 1, [
{
offset: 0,
color: '#0cd7f2'
},
{
offset: 1,
color: 'rgba(0, 0, 0, 0.1)'
}
]),
stroke: 'rgba(3, 25, 63, .1)',
}
},
{
type: 'CubeTop',
shape: {
api,
xValue: api.value(0),
yValue: api.value(1),
x: location[0],
y: location[1],
xAxisPoint: api.coord([api.value(0), 0])
},
style: {
fill: new echarts.graphic.LinearGradient(0, 0, 0, 1, [
{
offset: 0,
color: '#0cd7f2'
},
{
offset: 1,
color: '#0cd7f2'
}
]),
stroke: 'rgba(3, 25, 63, .1)',
}
}
]
}
},
data: yData
},
{
name: '活动数',
type: "line",
showSymbol: true,
yAxisIndex: 0,
symbol: 'none',
itemStyle: {
color: "#01EEFD"
},
lineStyle: {
width: 3,
},
areaStyle: {
normal: {
color: new echarts.graphic.LinearGradient(0, 0, 0, 1, [{
offset: 0,
color: 'rgba(67, 239, 255, .3)',
},
{
offset: 1,
color: 'rgba(1, 17, 49, .3)',
}
]),
},
},
data: yData2
}]
};


