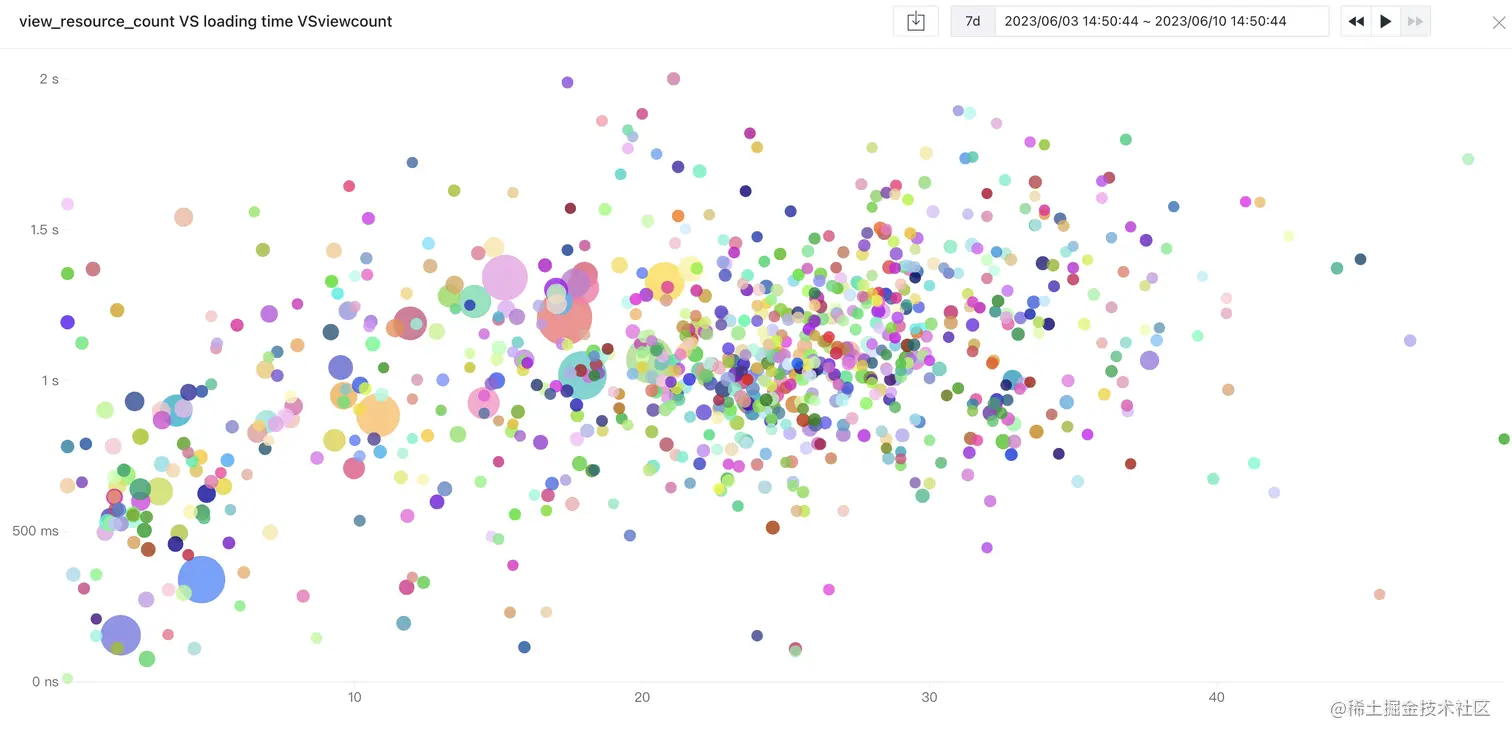
view_resource_count Vs loading time from avg by last 7 days and work priority
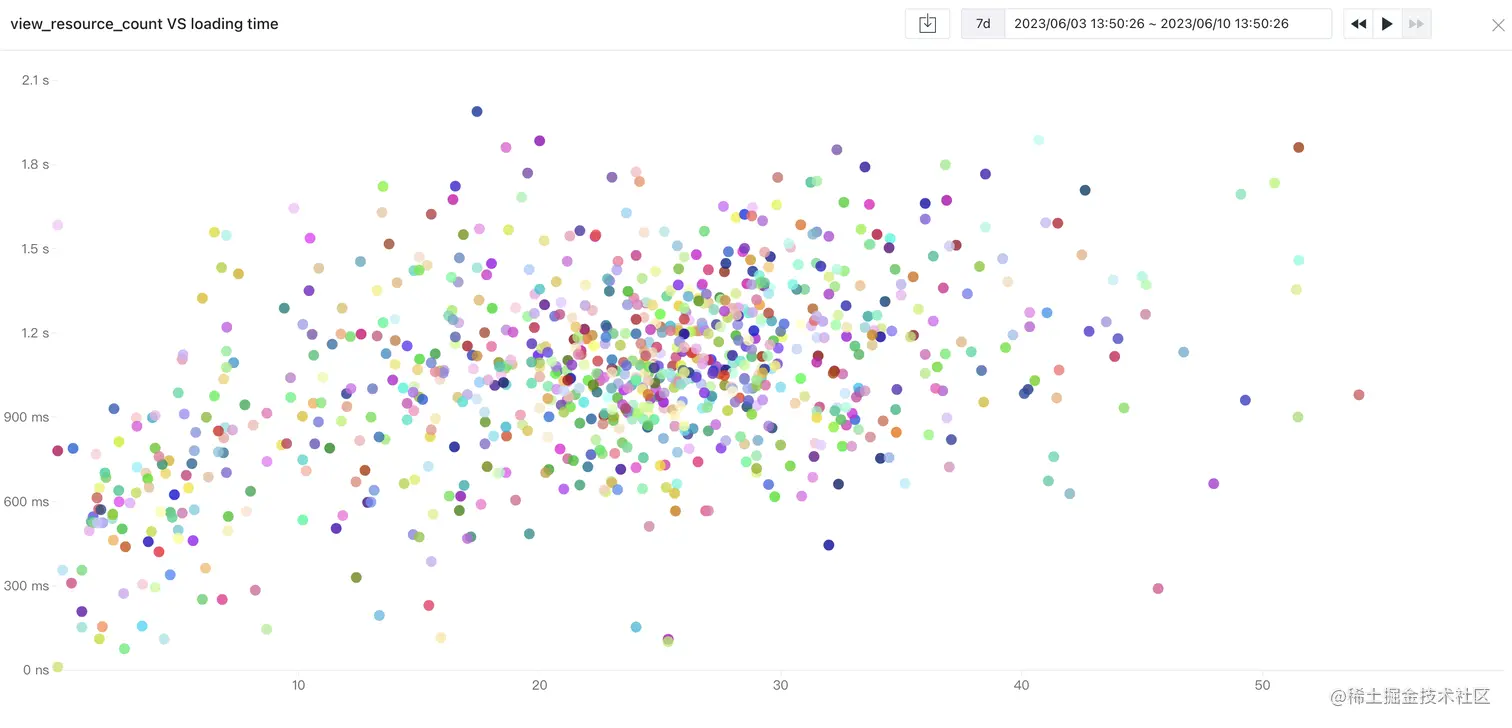
first we can get the scattered chart from guance console for the last 7 days
export that data to csv file from the download button
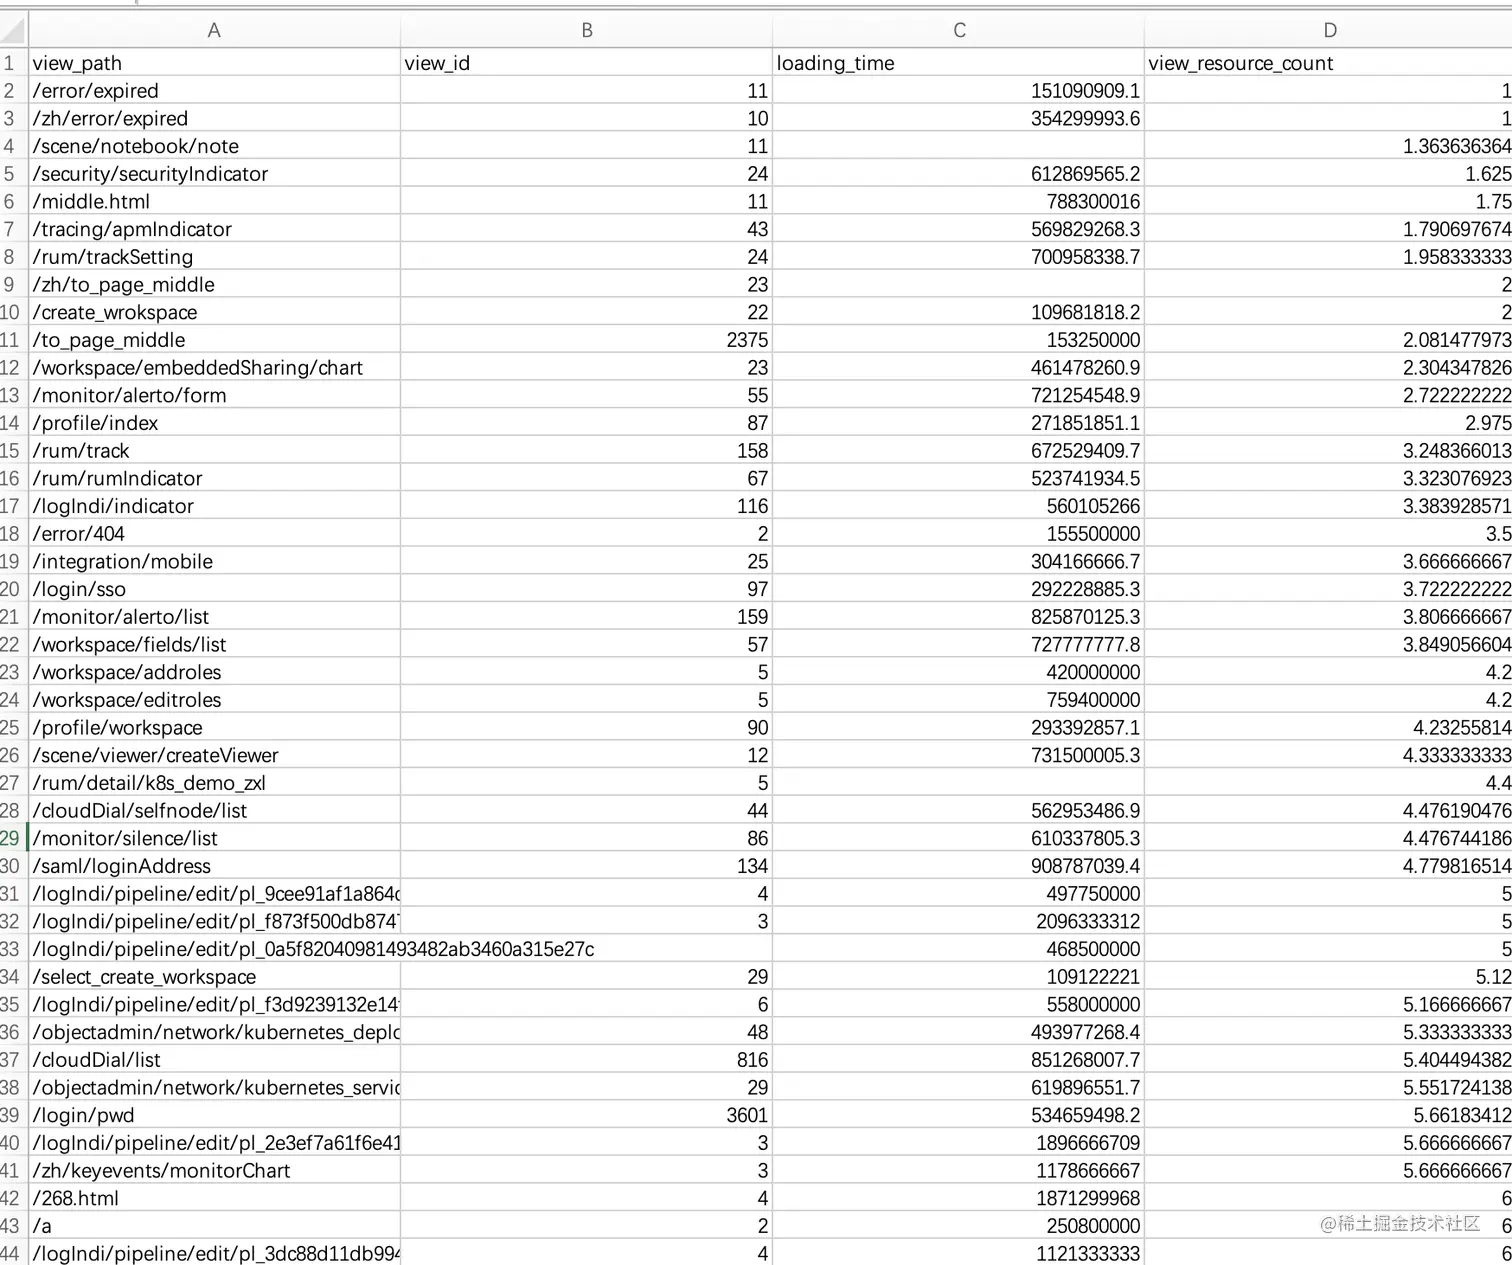
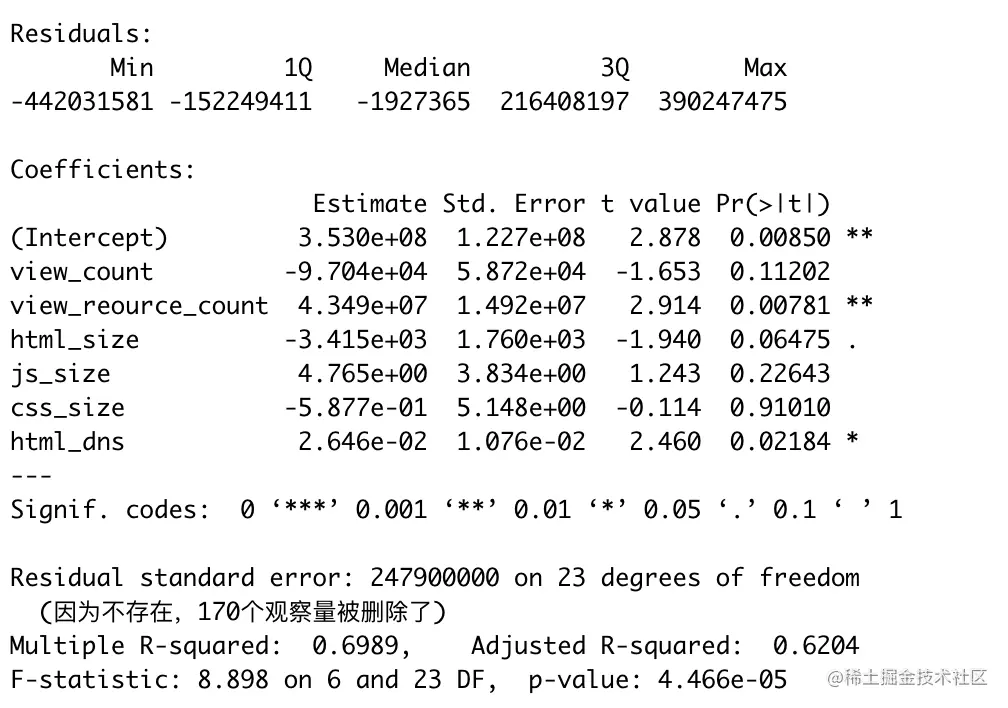
import data to Rstudio for analysis
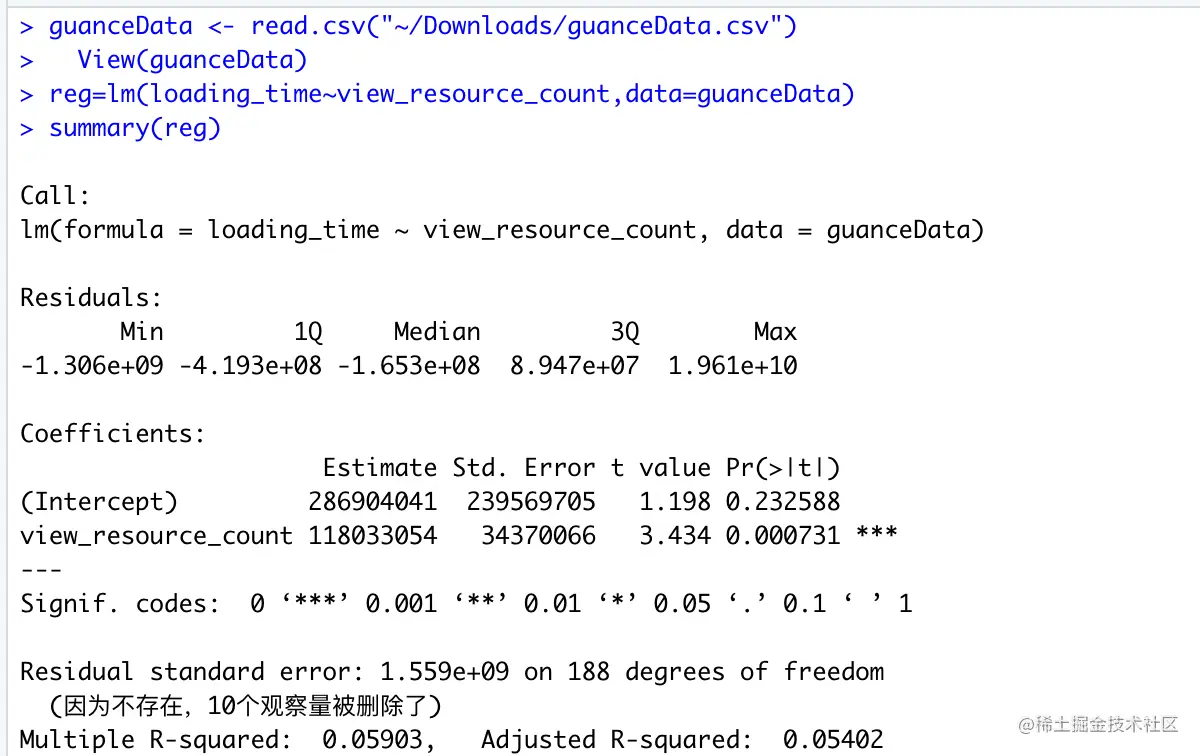
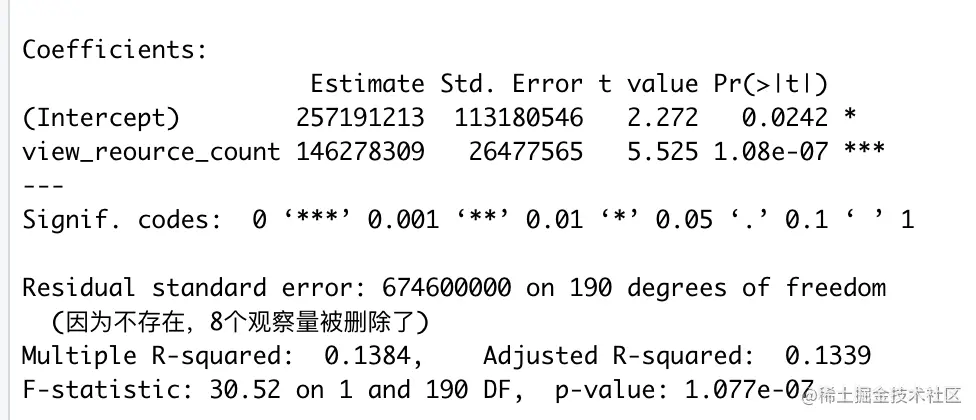
check corralation between view_resource_count and loading time
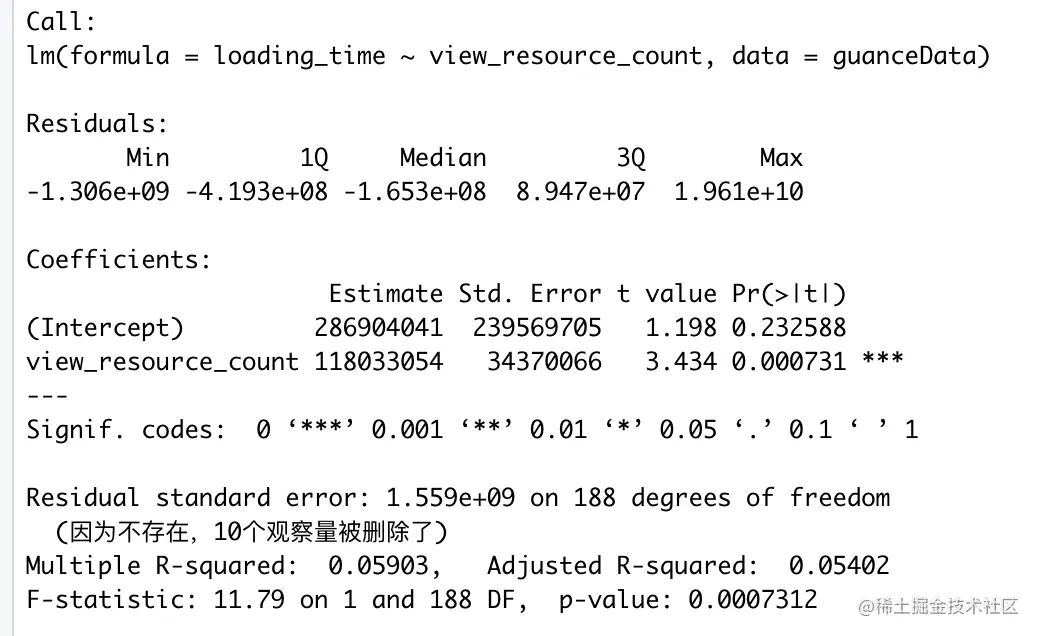
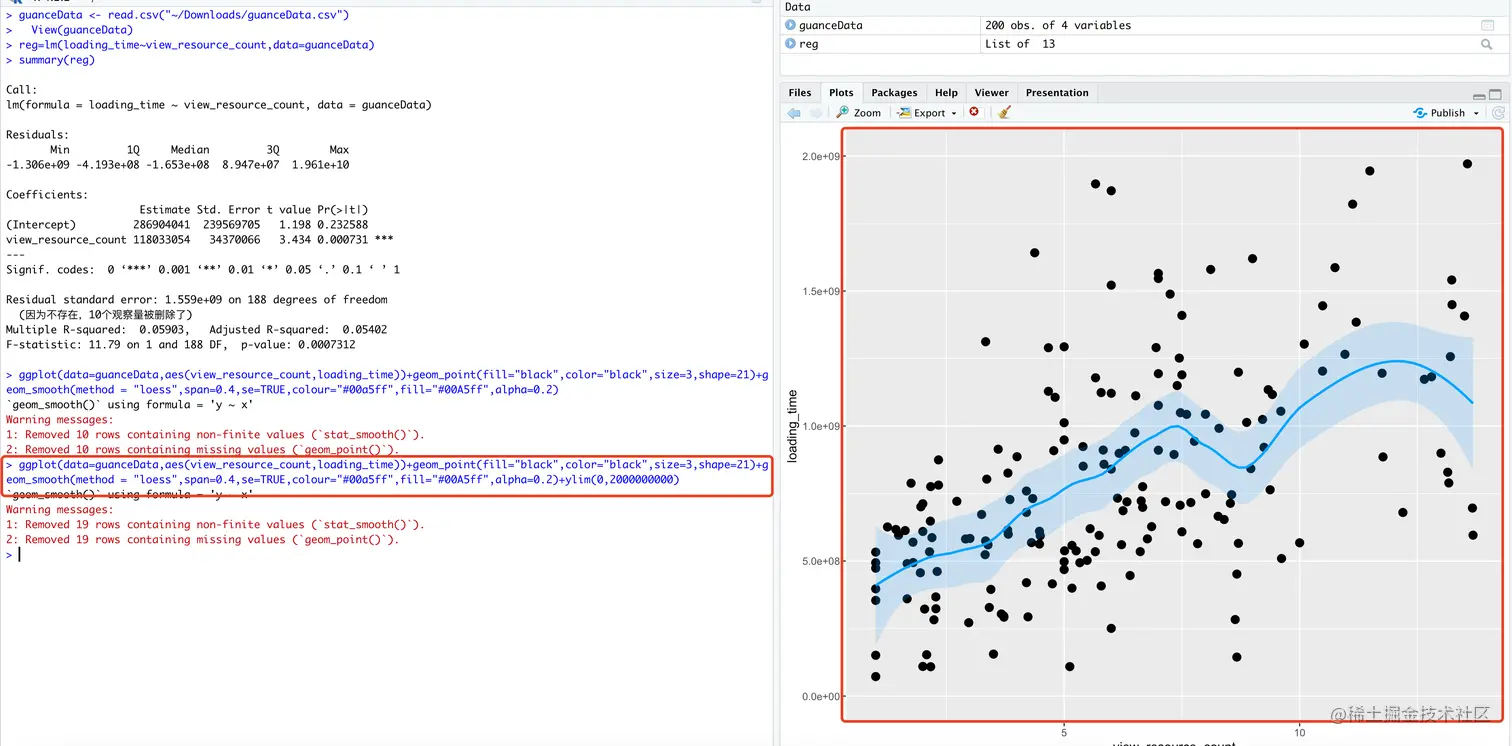
plot for view

adjust y for the better view
priority comes first in reality for resource_count adjustment
using similar metrics for more understanding for the project
using size of html ,css,js
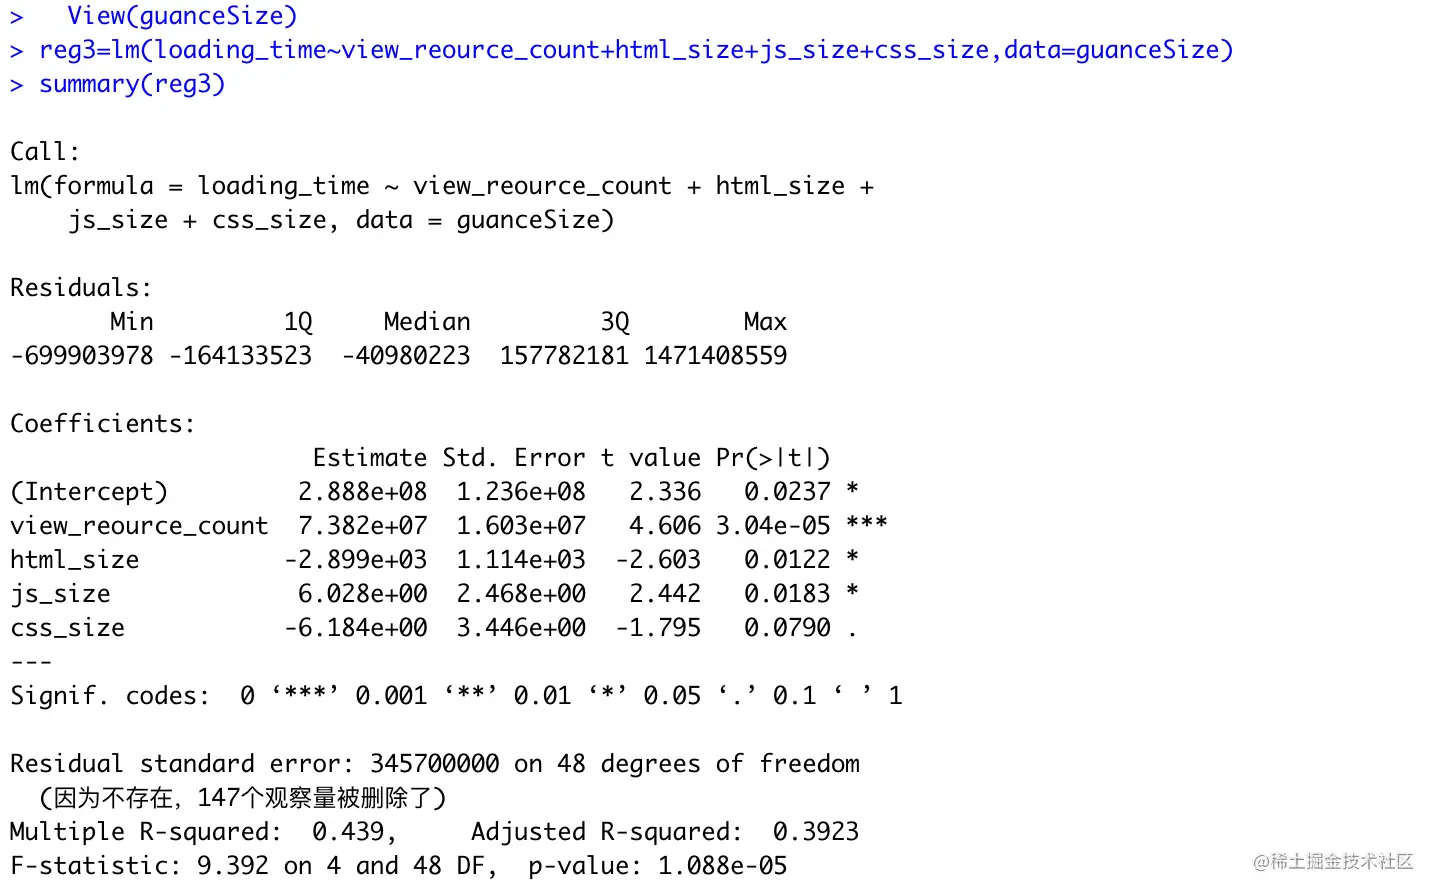
consider html_dns
for specific app