安装和导入:
cnpm install d3 --save-dev
import * as d3 from "d3";
选择器:
d3.select("text")
d3.select("text.title")
d3.select("p[class=name]")
d3.select(".alice").selectAll("[stroke-width='0.7']").attr("stroke-width", "0.4");
动态生成标签方法:
function Draw(dom){
    return function(shape,option){
        const obj=dom.append(shape)
        for(let [key,val] of Object.entries(option)){
            obj.attr(key,val)
        }
    return obj
    }
}
使用方法:
var g =d3.select(newRect.value);
const draw = Draw(g)
draw('g',{
transform:`translate(${x},${y})`,
class:"gRect"
})
根据数据来渲染:
const data = [{x:2,y:50,color:'green'},{x:1,y:1,color:'red'},{x:2,y:2,color:'yellow'},{x:3,y:13,color:'black'},{x:4,y:4,color:'pink'}]
const data1 = [{x:2,y:20,color:'green'},{x:1,y:11,color:'pink'},{x:2,y:2,color:'green'},{x:3,y:13,color:'red'},{x:4,y:5,color:'yellow'}]
this.mainG = d3.select("#mainSvg")
const width = +this.mainG.attr('width')
const height = +this.mainG.attr('height')
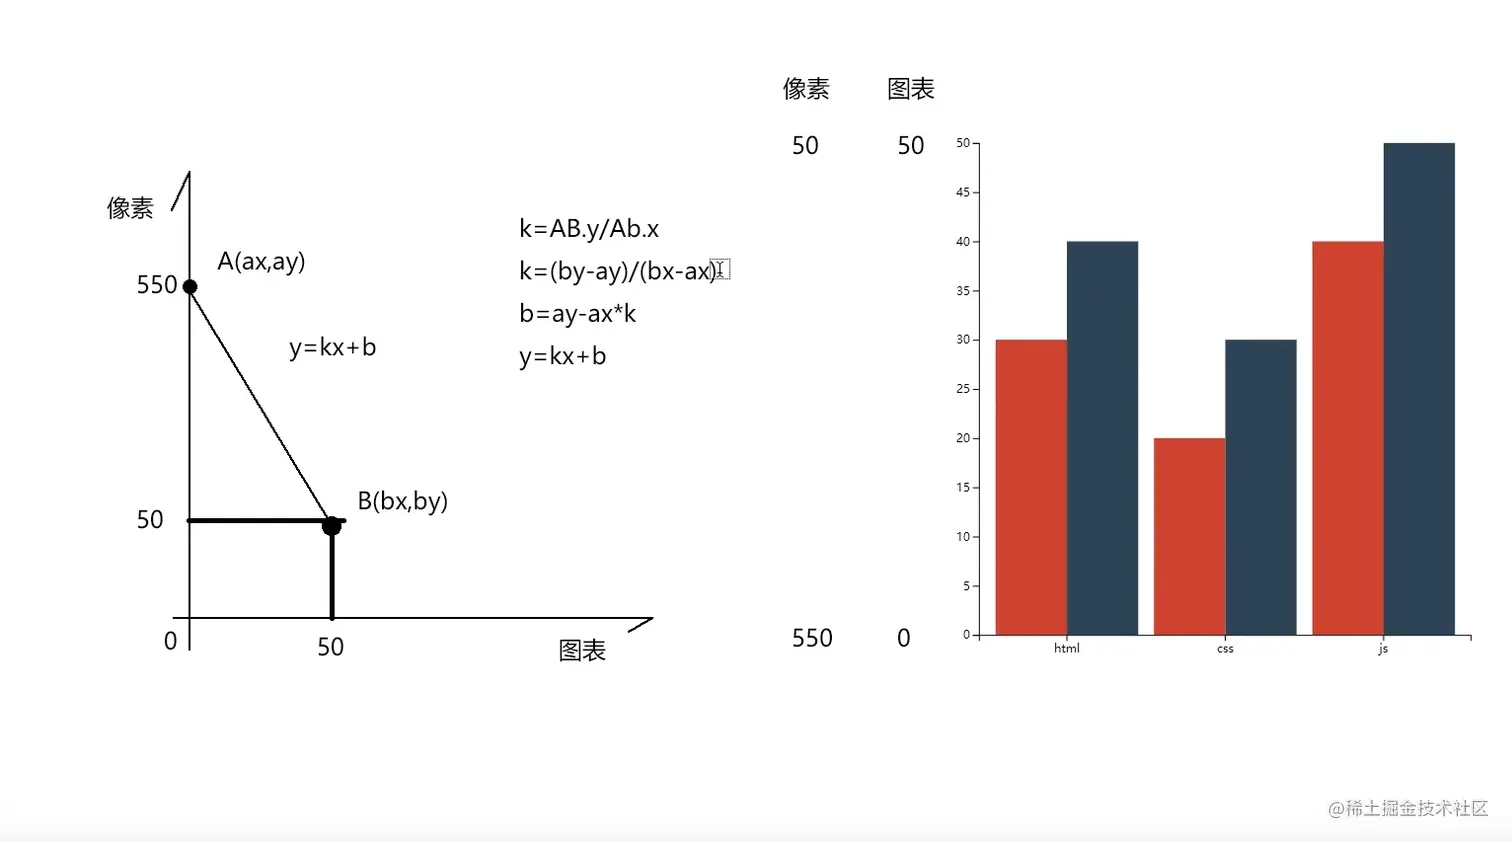
const xScale = d3.scaleLinear().domain([0,d3.max(data,d=> d.x)]).range([0,width]);
const yScale = d3.scaleLinear().domain([0,d3.max(data,d=> d.y)]).range([0,height]);
this.mainG.attr('transform', 'translate(20,20)');
const yAxis = d3.axisLeft(yScale);
const xAxis = d3.axisBottom(xScale);
this.mainG.append('g').call(yAxis).attr('transform', `translate(${width/2},0)`);
this.mainG.append('g').call(xAxis).attr('transform', `translate(0,${height/2})`);
data.forEach(d => {
this.mainG.append('rect')
.attr('width',xScale(d.y))
.attr('height',yScale(d.x))
.attr('fill',d.color)
.attr('y',yScale(d.y))
})
d3.selectAll('rect').data(data1)
.attr('width',d => xScale(d.y))
.attr('height',20)
.attr('fill','red')
.attr('y',d => yScale(d.y))
this.mainG.selectAll('.dataRect').data(data).enter().append('rect')
.attr('class','dataRect')
.attr('width',d=>xScale(d.y))
.attr('height',20)
.attr('fill',d=>(d.color))
.attr('y',d=>yScale(d.y))
this.mainG.selectAll('.dataRect').data(data).exit().remove()
d3.selectAll('rect').data(data1).transition().duration(1000).attr('width',d=>xScale(d.y))
.attr('width',d=>xScale(d.y))
.attr('fill',d=>(d.color))
d3.selectAll('.tick text').attr('font-size','2em');
this.mainG.append('text').text('文本').attr('font-size','2em').attr('transform', `translate(${width/2},0)`).attr('text-anchor', 'middle')
对多边形的操作
const points = [
[200,10],
[300,210],
[170,250],
[123,234],
]
let g = d3.select(a.value)
const draw = Draw(g)
draw('polygon',{
points:points,
fill:"url(#pattern_ele)",
stroke:"red",
'stroke-width':2,
})
const pointTest = [206,158]
draw('circle',{
cx:pointTest[0],
cy:pointTest[1],
r:5,
fill:"black",
})
const bool = d3.polygonContains(points,pointTest)
const hull = d3.polygonArea(points)
const center = d3.polygonCentroid(points)
const len = d3.polygonLength(points)
console.log("面积",hull,"中心",center,"周长",len, "是否在内部",bool)
比例尺:
原理
let f = d3.interpolate(200,600);//函数的输入从0-1,映射到传递进来的参数
f(0.3)//360
let s = d3.scaleOrdinal().domain(\["shagnhai","beijing","wuhan"]).range(\["red","green","blue"])
s("shagnhai")//"red"
画一个饼图
const path = d3.arc().innerRadius(60).outerRadius(260);
svg.selectAl1('path').data(arcData).join('path');
.attr('d',path)
.attr('transform',`translate(${width / 2), ${height / 2})`)
.attr('fill', d => color(d.data.city));
tips:
删除自身元素
var p = body.select("#myid")
p.remove()
选择所有有这个属性的元素:并给他们设置另一个属性
d3.selectAll("[fill-opacity='0.4']").attr("fill-opacity", "0.1")
画笔工具:矩形选区
var g = d3.select(a.value)
g.call(d3.brush().extent( [[0,0], [500,500]]))


