

一、 话不多说,上效果图
- instance 、 主机名两列 经过Value Mapping处理,仅展示指定内容,其他列正常显示
- 整个页面Dashboard分为两个panel,左侧为Table、右侧为Alert list如下
二. 配置TABLE 表盘
1. 创建dashboad
2. 选择Table (曲线图择期在写)
3. 配置标题及描述信息
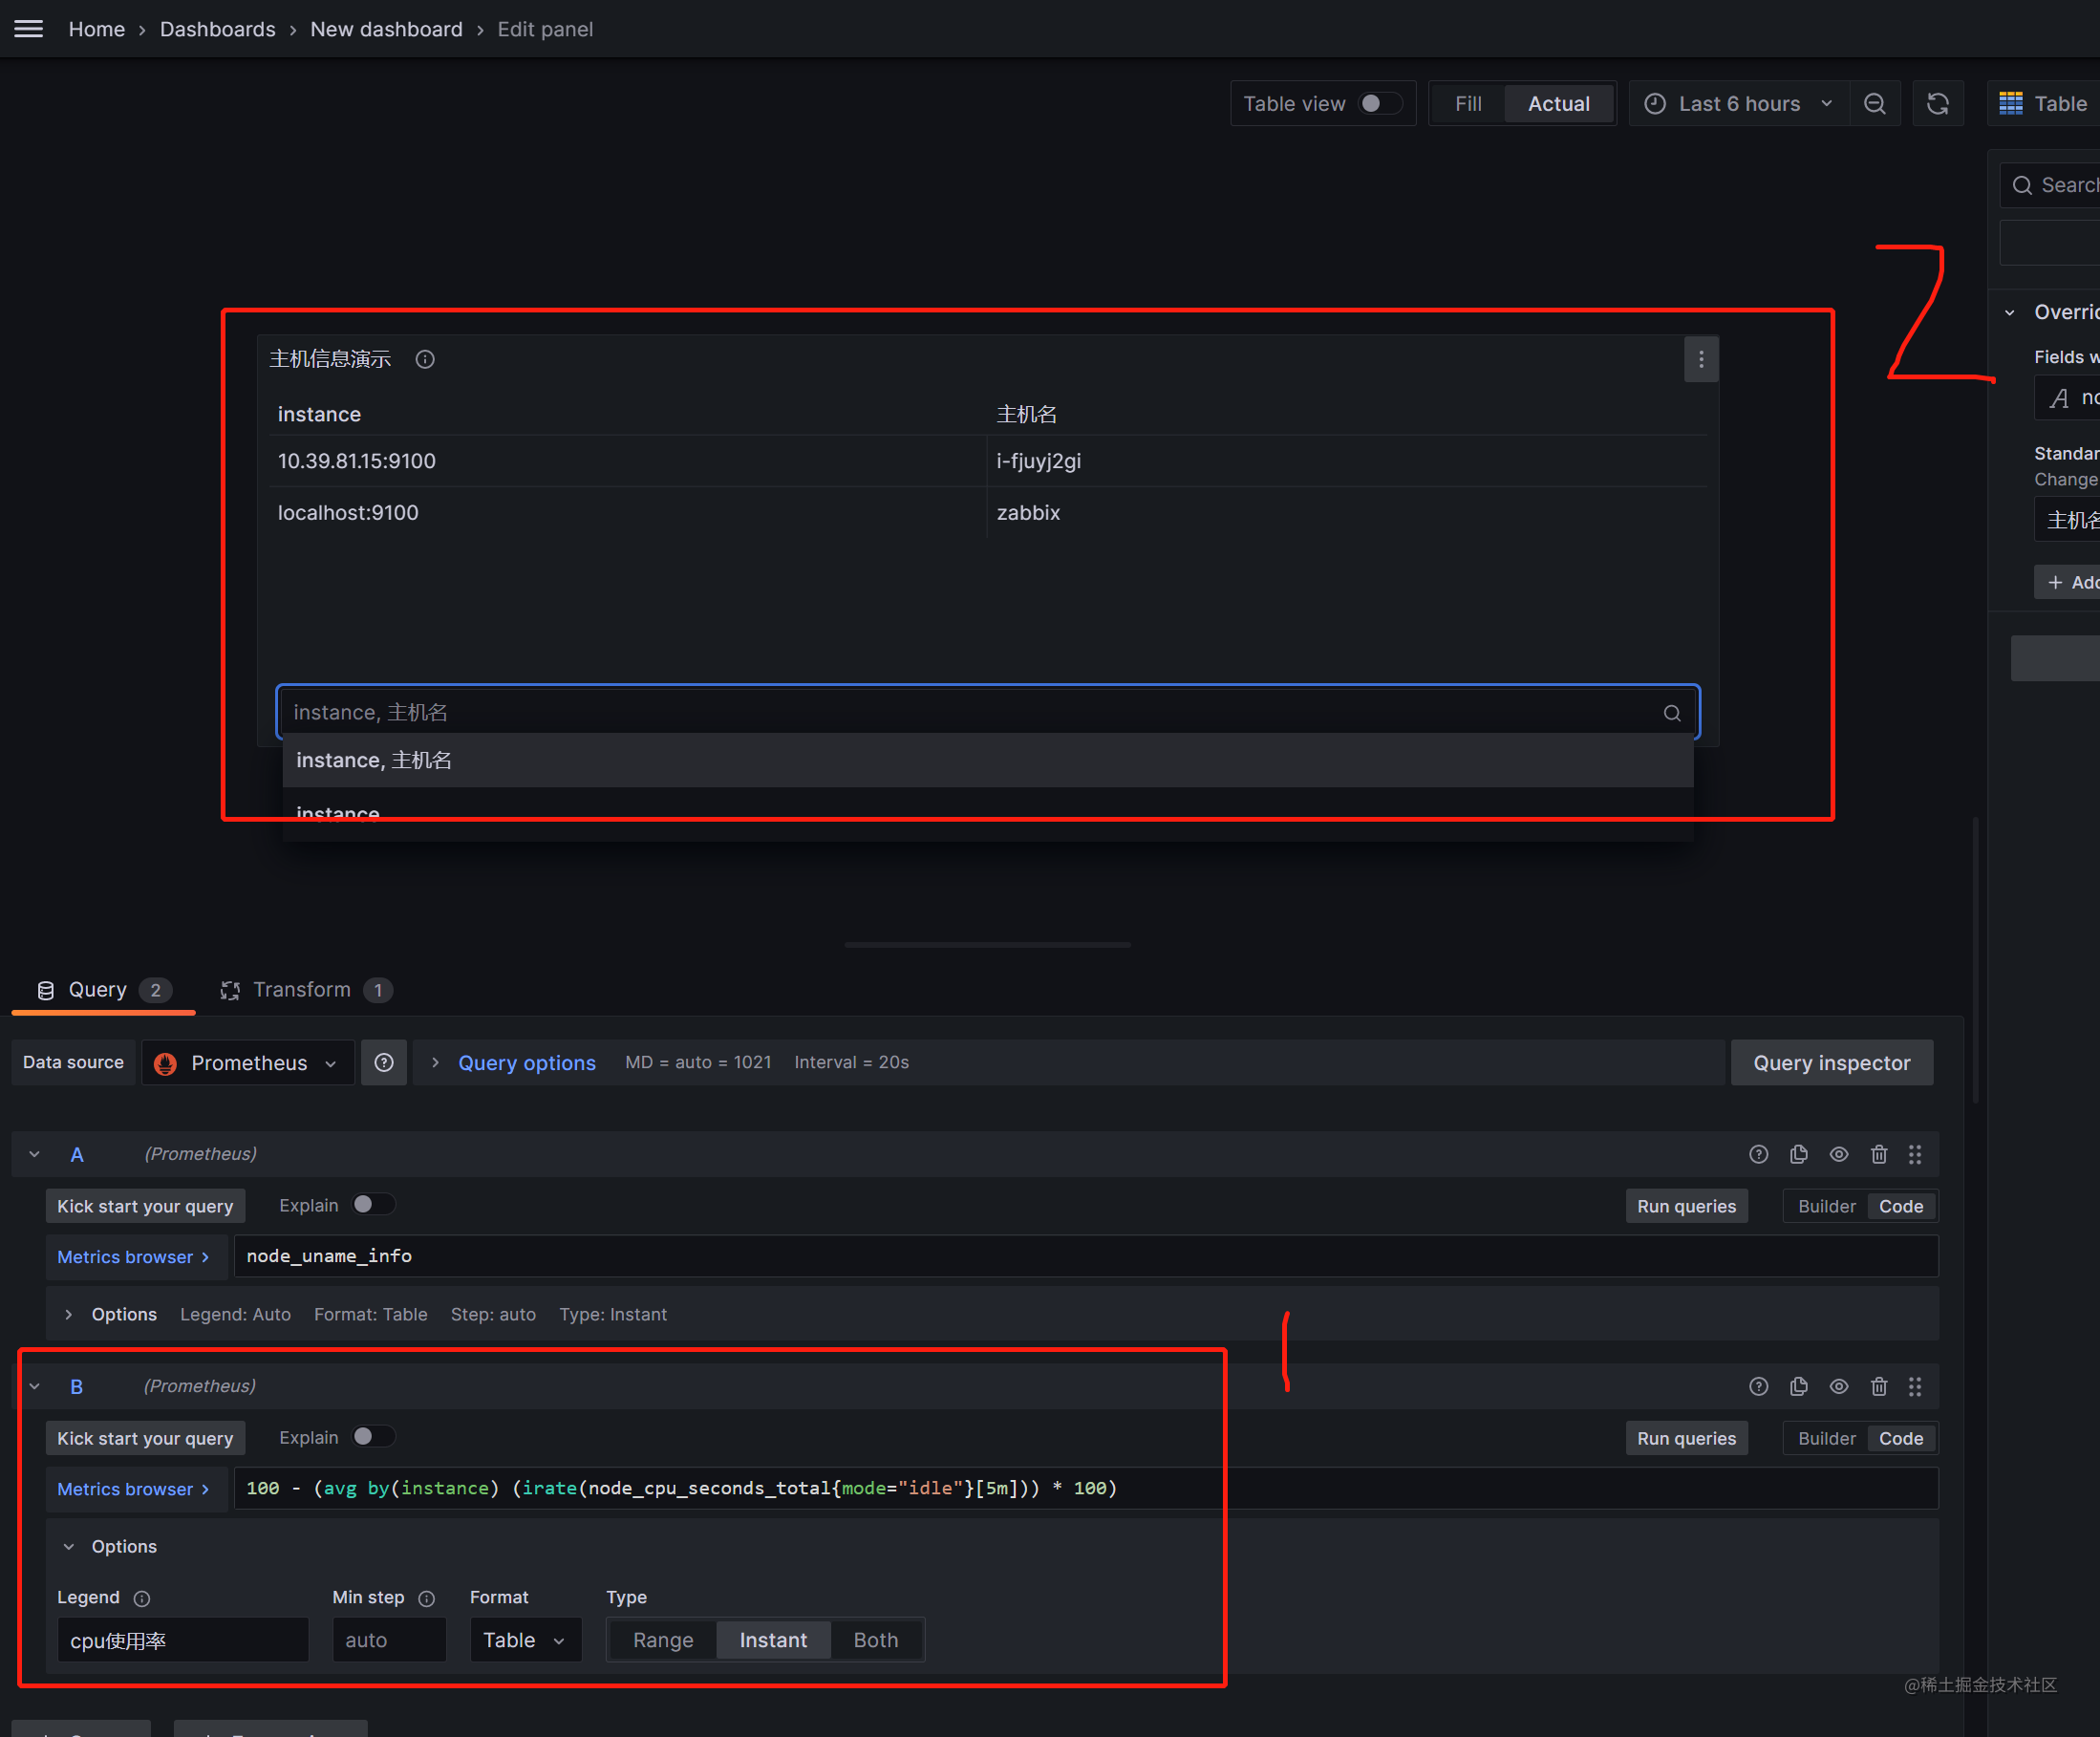
4. 配置metric,显示主机ip和主机名
- 第1部分 显示通过 node_uname_info 查询出的结果,有很多无用新信息,会在后面进行隐藏
- 第2部分 使用prometheus自己的数据源,搭建及配置过程略
- 第3部分 填写prometheus表达式,grafana配置prometheus数据源之后,可直接使用promql进行查询
- 第4部分 当使用Table做仪表盘时,这里Format要选择Table才适配显示
- 第5部分 type选择 instance 参数,instance会获取最后一个数值
5. 目前显示信息有点多 ,我们只需要显示instance、和主机名即可,现在我们隐藏其他的字段
-
根据设置File by name 获取先要显示的字段列表
-
没有更改配置前
-
更改配置只保留instance、nodename字段(鼠标单机字段 取消√号即可隐藏字段)
6. 将表格标题 nodename 重命名为: 主机名
- 选择overview --> Filed with name,根据字段匹配nodename
- 选择 nodename(A 表示我们写表达式的metric)
- 选择Add overwide property 将这一列原有的、默认的属性进行覆盖改写
- 选择display name,并填写value为主机名 显示效果如标记3
7. 配置cpu使用率
-
第一部分:配置cpu表达式、表达式写在文档最后面,注意要选择Table 、instant属性,不然会显示不出查询数据, legand选择custom 自定义,这个字段在table表盘里显示作用不大,legand 主要用在曲线图上
-
第二部分: 显示效果并没有如预期那样,因为我们需要将两个表达式的结果放在表格里的同一行里 因此还需要额外配置
-
- 选择 Transform 选项
-
- 选择Join by Filed
-
- 根据instace 字段将两个metric(node_uanme_info和 ..node_cpu_seconds_total..)的值合并到一行
-
- 使用标记3的地方,将这个配置移动到最上面,因为这些配置从上到下有优先级
-
- 将cpu使用率的值显示到列表上
- 将cpu使用率的值显示到列表上
8. 将Value#B 显示成百分比样式,并重命名: cpu使用率%
-
选择add overwide property,根据需要选择相属性,如图
9. 其他字段类似炮制即可,字段名称都写在第三部分,可供参考
三、 一些特殊配置说明
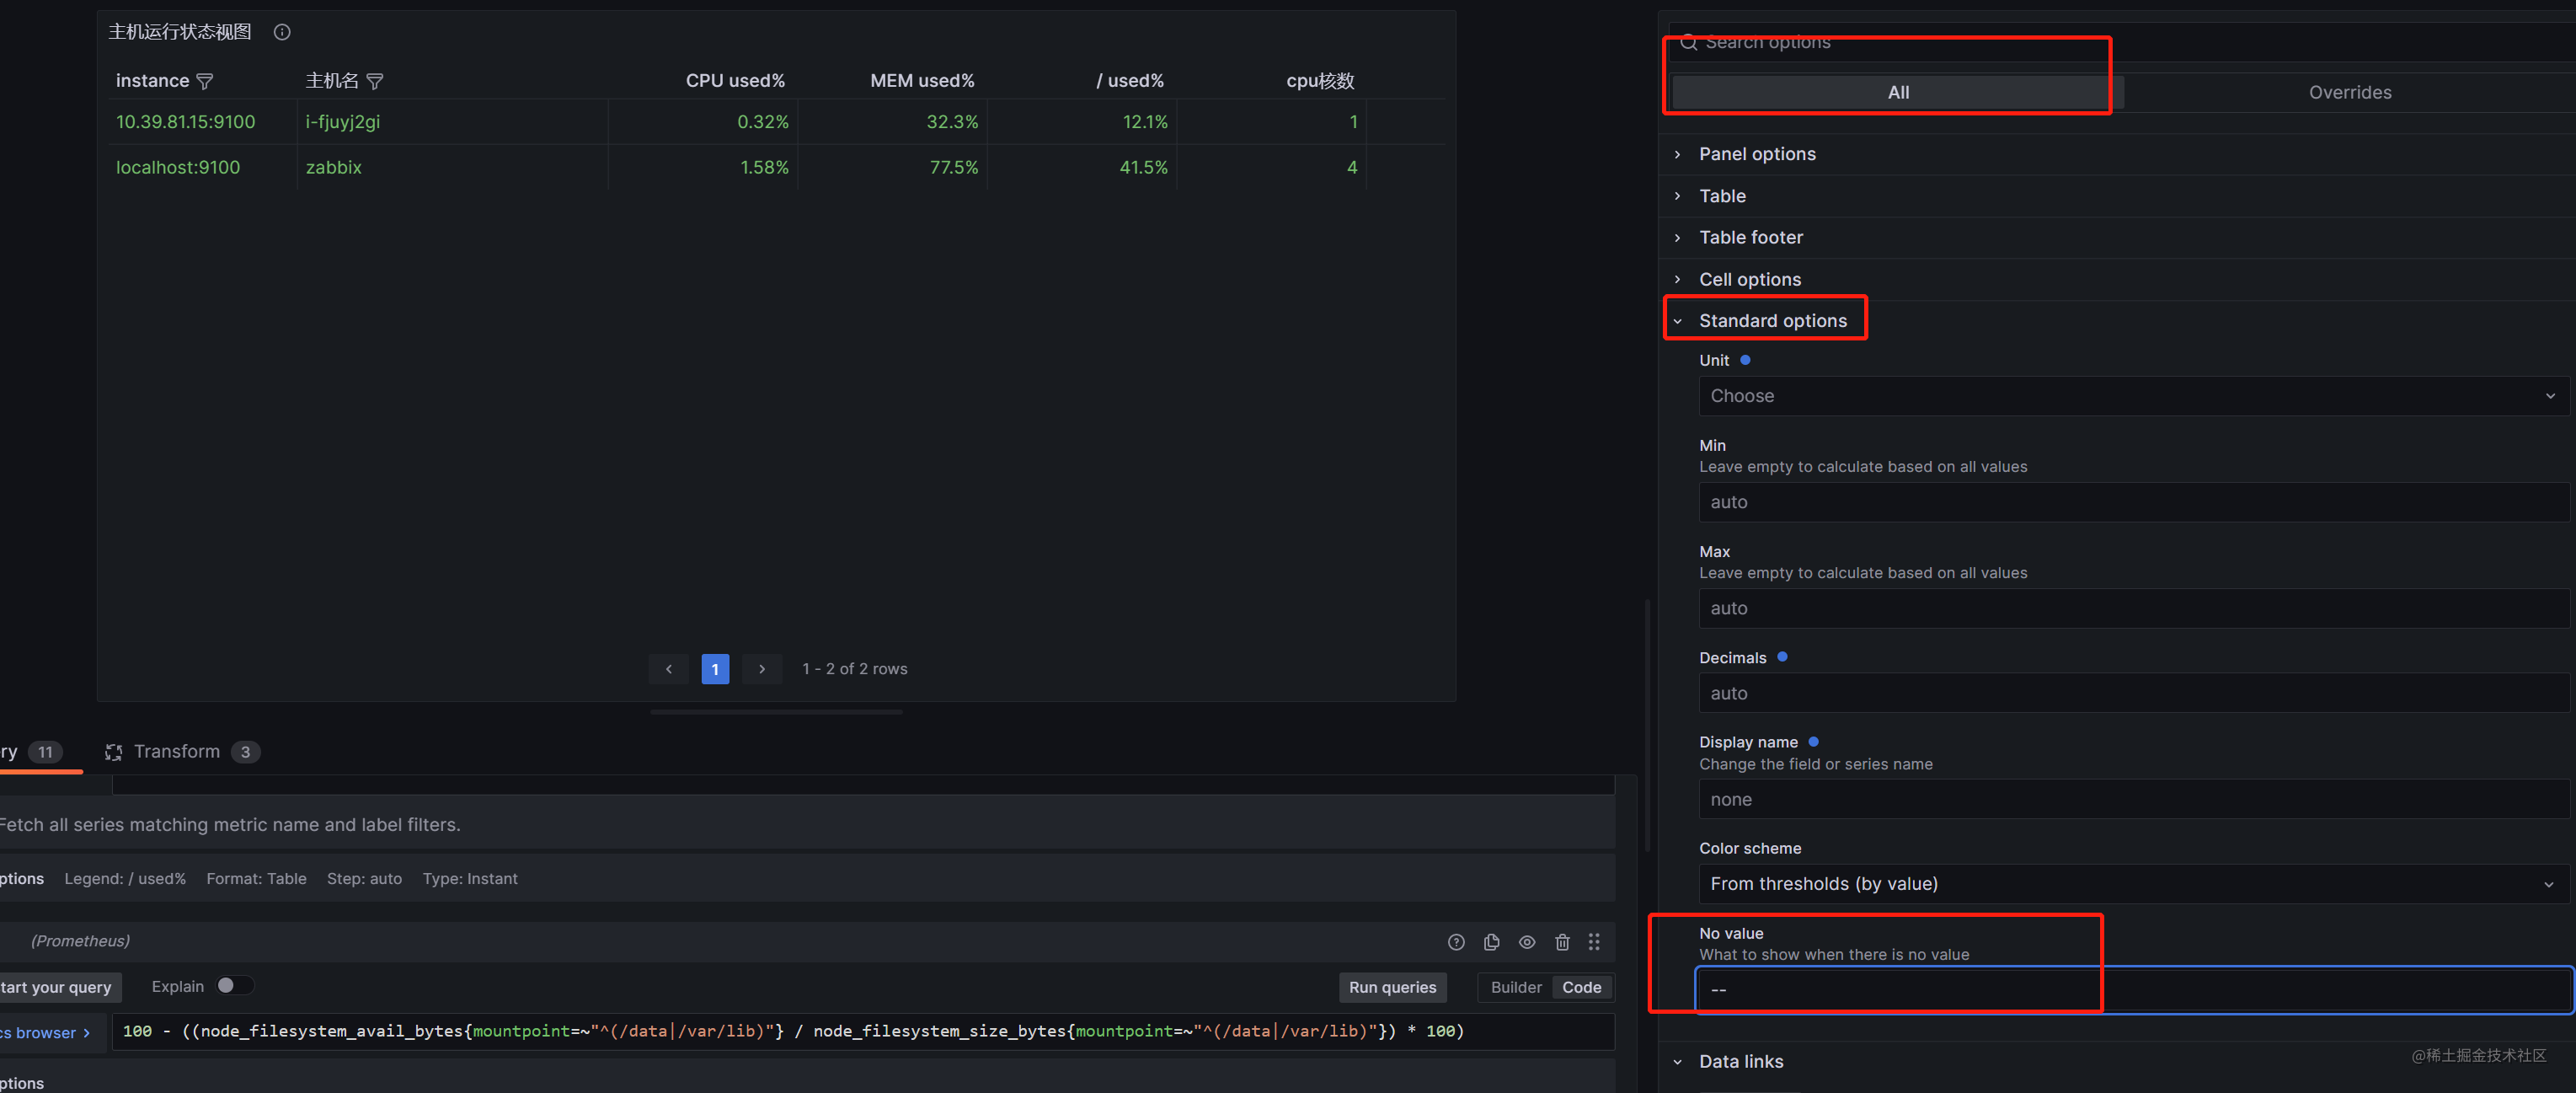
1. 内存大小显示 需要配置Standard optionsDecimals = 0 取出的才最接近
- 没有配置Standard optionsDecimals
- 配置了Standard optionsDecimals = 0
2. 字体颜色设置
- Cell type 默认auto选项 没有颜色
- Cell type设置colord text
- 显示效果如下:
3. 字段超过设定阈值时显示红色,以磁盘/ used% 举例
- 这个根据颜色告警的前提是,配置了第二步字体颜色设置Cell type设置colord text ,否则配置不生效
- 配置Add overwide property > Thresholds > Thresholds
- 选择参数absoulte 参数10, 只要比10大的就显示红色
4. 当查询metric时获取不到值时会显示空白,这样不美观,我们用其他符号代替空白
5. 第二种重命名列名称的方法(第一种在右侧overwides中使用displayname 重新命名)
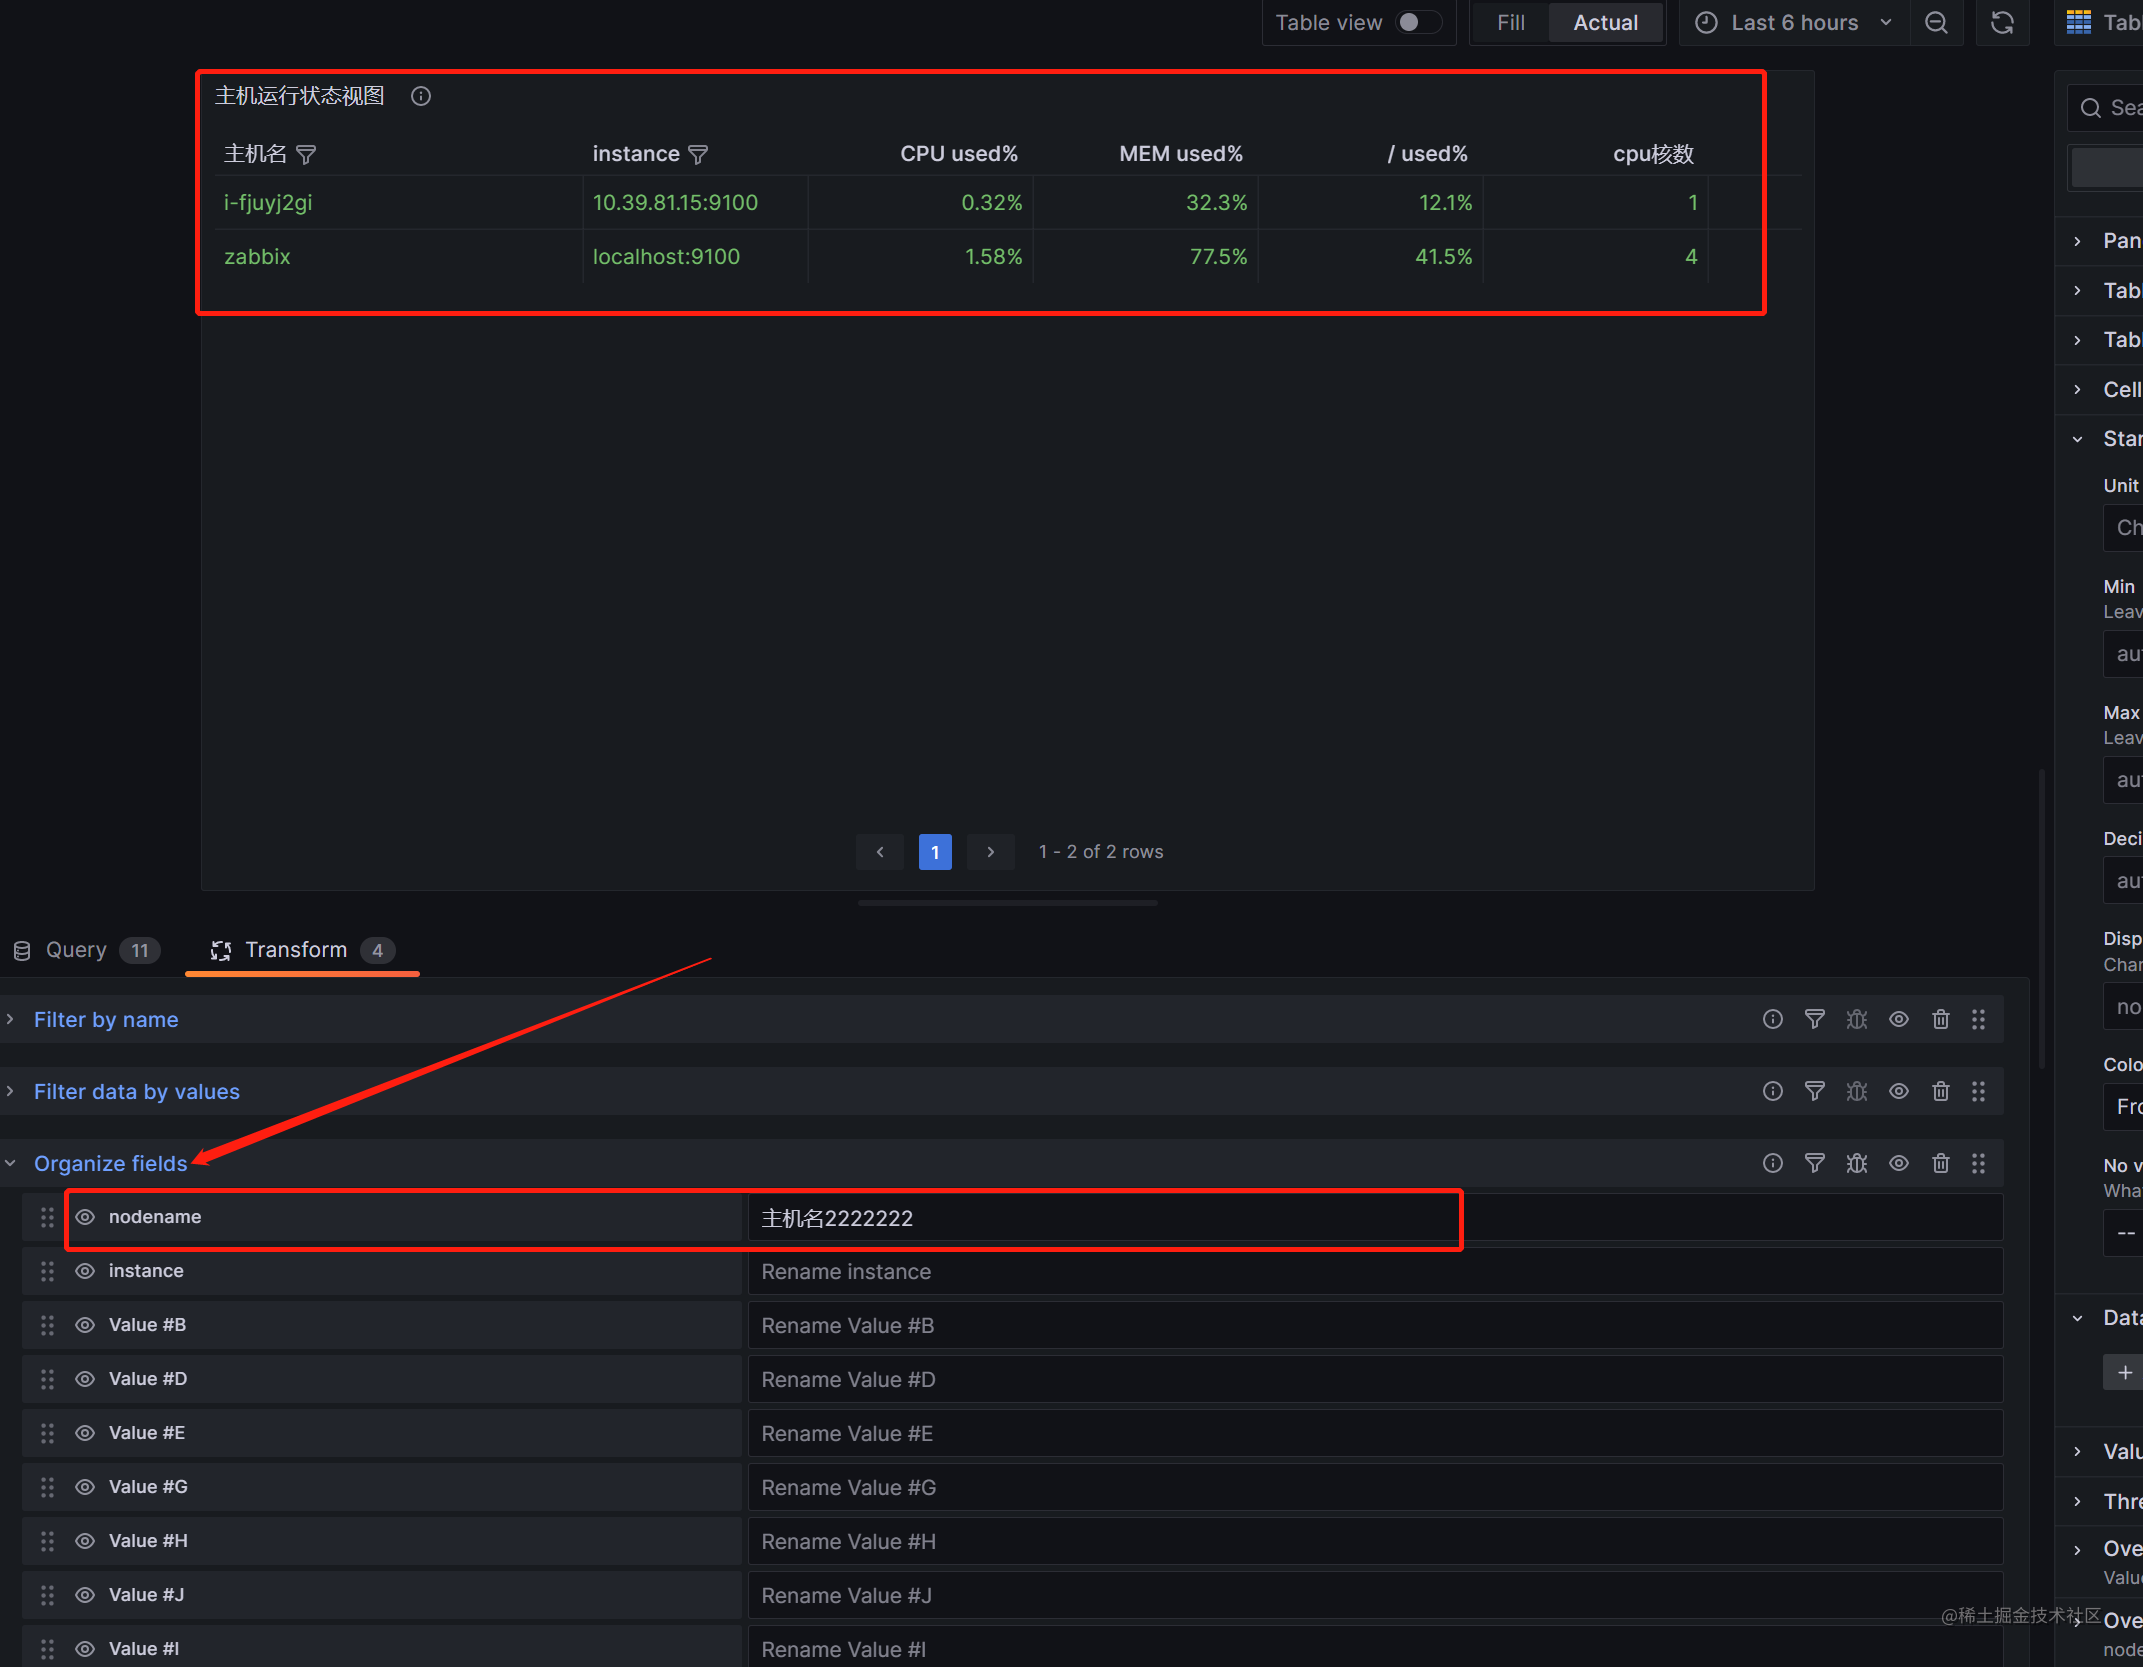
6. 如何调整列的显示顺序
- 将主机名放到第一列,cpu核数放到第二列
修改前:
修改后(拖动标红位置 调整顺序):
7. 查看表格某一列是哪个metric
- 举例: 将cpu那一列拖动到最后,但不知道哪个值
- 选择标记1 table view,可看到cpu(值为1和4)是 Vaulue #G这一列,然后就可以在标记3的位置找到value #G进行拖动
8. 显示的结果有不想使用的内容怎么办,比如数据重复了(可能prometheus配置了两个job,都获取到了同一个主机信息),如下图:
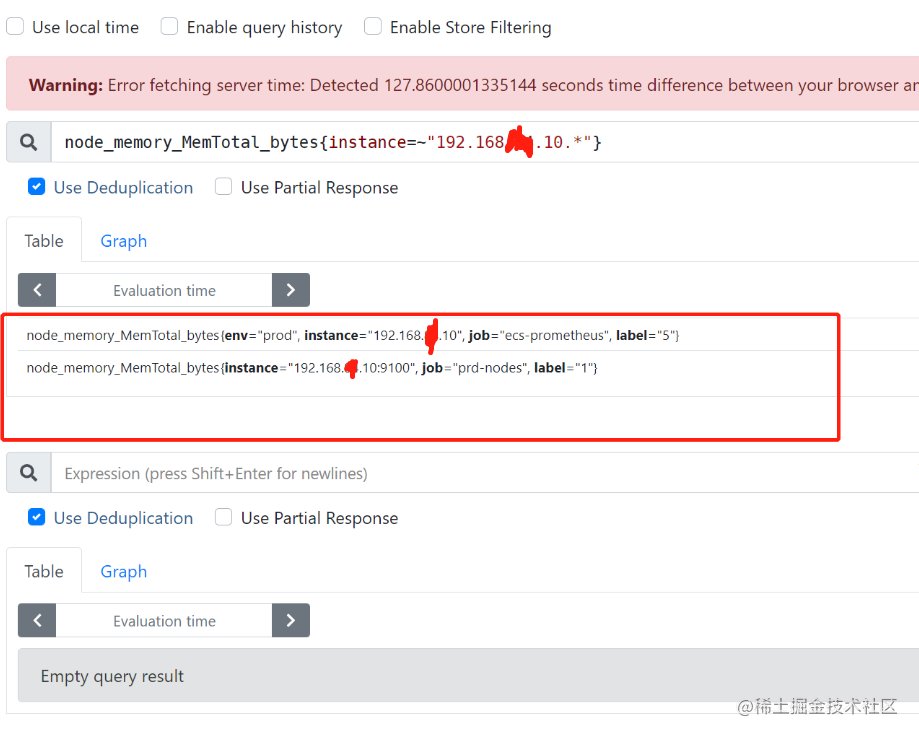
- 说明: 第一个job获取了主机192.168.1.10的内存信息,
第二个job获取了主机192.168.1.10:9100的内存信息,
当我们使用join by filed 根据instance进行合并的时候,由于instance值并不完全相等,这样会出现两行关于192.168.1.10主机的信息 ,这并不是我们想看到的,因为数据重复了
-解决办法:
对数据进行筛选,只显示instace=.*9100 以9100结尾的数据(也可以exclude 排除数据)
- 当想把多个pannel放到一个dashboar的 但有放不下时, 可以使用 row 功能
- add a new row ,然后将pannel拖动到row下面就行
四 metric字段及表达式如下:
node_uname_info显示instance、 主机名100 - (avg by(instance) (irate(node_cpu_seconds_total{mode="idle"}[5m])) * 100)显示cpu使用率(1 - (node_memory_MemAvailable_bytes / (node_memory_MemTotal_bytes)))* 100显示内存使用率100 - ((node_filesystem_avail_bytes{mountpoint="/",device=~"/dev/vda1|/dev/sda1"} / node_filesystem_size_bytes{mountpoint="/",device=~"/dev/vda1|/dev/sda1"}) * 100)显示 /使用率100 - ((node_filesystem_avail_bytes{mountpoint=~"^(/data|/var/lib)"} / node_filesystem_size_bytes{mountpoint=~"^(/data|/var/lib)"}) * 100)挂载点磁盘使用率 6.显示cpu核数
count(node_cpu_seconds_total{mode="system"}) by (instance)
- 显示内存大小
node_memory_MemTotal_bytes
- 显示TCP Establish数量
node_netstat_Tcp_CurrEstab
- 显示TCP time_wait数量
node_netstat_Tcp_CurrEstab
- 显示主机存活
up{instance=~".*9100"}
- 显示启动时间
node_time_seconds - node_boot_time_seconds
五 Dashboard json数据,可直接导入使用
- 表格数据导入时需略微调整,如修改datasource、uuid等,
{
"annotations": {
"list": [
{
"builtIn": 1,
"datasource": {
"type": "grafana",
"uid": "-- Grafana --"
},
"enable": true,
"hide": true,
"iconColor": "rgba(0, 211, 255, 1)",
"name": "Annotations & Alerts",
"target": {
"limit": 100,
"matchAny": false,
"tags": [],
"type": "dashboard"
},
"type": "dashboard"
}
]
},
"description": "查看主机运行状态及配置(author liangmingb)",
"editable": true,
"fiscalYearStartMonth": 0,
"graphTooltip": 0,
"id": 1,
"links": [],
"liveNow": false,
"panels": [
{
"datasource": {
"type": "prometheus",
"uid": "e3ce7ecd-309b-4da0-b260-a7914240b105"
},
"description": "查看主机运行状态及预警信息",
"fieldConfig": {
"defaults": {
"color": {
"mode": "thresholds"
},
"custom": {
"align": "auto",
"cellOptions": {
"type": "color-text"
},
"filterable": false,
"inspect": false
},
"mappings": [
{
"options": {
"null": {
"index": 0,
"text": "无"
}
},
"type": "value"
}
],
"noValue": "--",
"thresholds": {
"mode": "absolute",
"steps": [
{
"color": "green",
"value": null
}
]
}
},
"overrides": [
{
"matcher": {
"id": "byName",
"options": "Value #C"
},
"properties": [
{
"id": "unit",
"value": "s"
},
{
"id": "displayName",
"value": "启动时间"
},
{
"id": "custom.align",
"value": "center"
}
]
},
{
"matcher": {
"id": "byName",
"options": "nodename"
},
"properties": [
{
"id": "displayName",
"value": "主机名"
},
{
"id": "unit",
"value": "string"
}
]
},
{
"matcher": {
"id": "byName",
"options": "Value #B"
},
"properties": [
{
"id": "displayName",
"value": "CPU used%"
},
{
"id": "unit",
"value": "percent"
},
{
"id": "thresholds",
"value": {
"mode": "absolute",
"steps": [
{
"color": "green",
"value": null
},
{
"color": "red",
"value": 80
}
]
}
},
{
"id": "decimals",
"value": 2
}
]
},
{
"matcher": {
"id": "byName",
"options": "Value #D"
},
"properties": [
{
"id": "displayName",
"value": "MEM used%"
},
{
"id": "unit",
"value": "percent"
},
{
"id": "thresholds",
"value": {
"mode": "absolute",
"steps": [
{
"color": "green",
"value": null
},
{
"color": "red",
"value": 90
}
]
}
}
]
},
{
"matcher": {
"id": "byName",
"options": "Value #E"
},
"properties": [
{
"id": "displayName",
"value": "/ used%"
},
{
"id": "unit",
"value": "percent"
},
{
"id": "thresholds",
"value": {
"mode": "absolute",
"steps": [
{
"color": "green",
"value": null
},
{
"color": "red",
"value": 80
}
]
}
}
]
},
{
"matcher": {
"id": "byName",
"options": "Value #G"
},
"properties": [
{
"id": "displayName",
"value": "cpu核数"
}
]
},
{
"matcher": {
"id": "byName",
"options": "Value #H"
},
"properties": [
{
"id": "displayName",
"value": "内存大小"
},
{
"id": "unit",
"value": "bytes"
},
{
"id": "decimals",
"value": 0
}
]
},
{
"matcher": {
"id": "byName",
"options": "Value #I"
},
"properties": [
{
"id": "displayName",
"value": "tcp_time_wait"
},
{
"id": "thresholds",
"value": {
"mode": "absolute",
"steps": [
{
"color": "green",
"value": null
},
{
"color": "red",
"value": 1000
}
]
}
}
]
},
{
"matcher": {
"id": "byName",
"options": "Value #J"
},
"properties": [
{
"id": "displayName",
"value": "tcp连接数"
}
]
},
{
"matcher": {
"id": "byName",
"options": "Value #F"
},
"properties": [
{
"id": "displayName",
"value": "挂载磁盘 %"
},
{
"id": "unit",
"value": "percent"
},
{
"id": "thresholds",
"value": {
"mode": "percentage",
"steps": [
{
"color": "green",
"value": null
},
{
"color": "red",
"value": 80
}
]
}
}
]
},
{
"matcher": {
"id": "byName",
"options": "nodename"
},
"properties": [
{
"id": "custom.filterable",
"value": true
},
{
"id": "custom.width",
"value": 246
}
]
},
{
"matcher": {
"id": "byName",
"options": "instance"
},
"properties": [
{
"id": "custom.filterable",
"value": true
}
]
},
{
"matcher": {
"id": "byName",
"options": "Value #K"
},
"properties": [
{
"id": "displayName",
"value": "主机存活"
},
{
"id": "thresholds",
"value": {
"mode": "absolute",
"steps": [
{
"color": "green",
"value": null
},
{
"color": "red",
"value": 0
},
{
"color": "green",
"value": 1
}
]
}
},
{
"id": "mappings",
"value": [
{
"options": {
"0": {
"index": 1,
"text": "down"
},
"1": {
"index": 0,
"text": "up"
}
},
"type": "value"
}
]
}
]
}
]
},
"gridPos": {
"h": 33,
"w": 24,
"x": 0,
"y": 0
},
"id": 3,
"options": {
"cellHeight": "sm",
"footer": {
"countRows": false,
"enablePagination": true,
"fields": "",
"reducer": [
"sum"
],
"show": false
},
"frameIndex": 5,
"showHeader": true,
"sortBy": []
},
"pluginVersion": "9.5.2",
"targets": [
{
"datasource": {
"type": "prometheus",
"uid": "e3ce7ecd-309b-4da0-b260-a7914240b105"
},
"editorMode": "code",
"exemplar": false,
"expr": "node_uname_info",
"format": "table",
"instant": true,
"legendFormat": "主机信息",
"range": false,
"refId": "A"
},
{
"datasource": {
"type": "prometheus",
"uid": "e3ce7ecd-309b-4da0-b260-a7914240b105"
},
"editorMode": "code",
"exemplar": false,
"expr": "100 - (avg by(instance) (irate(node_cpu_seconds_total{mode=\"idle\"}[5m])) * 100)",
"format": "table",
"hide": false,
"instant": true,
"legendFormat": "cpu使用率",
"range": false,
"refId": "B"
},
{
"datasource": {
"type": "prometheus",
"uid": "e3ce7ecd-309b-4da0-b260-a7914240b105"
},
"editorMode": "code",
"exemplar": false,
"expr": "(1 - (node_memory_MemAvailable_bytes / (node_memory_MemTotal_bytes)))* 100",
"format": "table",
"hide": false,
"instant": true,
"legendFormat": "内存使用率",
"range": false,
"refId": "D"
},
{
"datasource": {
"type": "prometheus",
"uid": "e3ce7ecd-309b-4da0-b260-a7914240b105"
},
"editorMode": "code",
"exemplar": false,
"expr": "100 - ((node_filesystem_avail_bytes{mountpoint=\"/\",device=~\"/dev/vda1|/dev/sda1\"} / node_filesystem_size_bytes{mountpoint=\"/\",device=~\"/dev/vda1|/dev/sda1\"}) * 100)\r\n",
"format": "table",
"hide": false,
"instant": true,
"legendFormat": "/ used%",
"range": false,
"refId": "E"
},
{
"datasource": {
"type": "prometheus",
"uid": "e3ce7ecd-309b-4da0-b260-a7914240b105"
},
"editorMode": "code",
"exemplar": false,
"expr": "100 - ((node_filesystem_avail_bytes{mountpoint=~\"^(/data|/var/lib)\"} / node_filesystem_size_bytes{mountpoint=~\"^(/data|/var/lib)\"}) * 100)",
"format": "table",
"hide": false,
"instant": true,
"legendFormat": "挂载点{{mountpoint}} used%",
"range": false,
"refId": "F"
},
{
"datasource": {
"type": "prometheus",
"uid": "e3ce7ecd-309b-4da0-b260-a7914240b105"
},
"editorMode": "code",
"exemplar": false,
"expr": "count(node_cpu_seconds_total{mode=\"system\"}) by (instance)",
"format": "table",
"hide": false,
"instant": true,
"legendFormat": "{{label_name}}",
"range": false,
"refId": "G"
},
{
"datasource": {
"type": "prometheus",
"uid": "e3ce7ecd-309b-4da0-b260-a7914240b105"
},
"editorMode": "code",
"exemplar": false,
"expr": "node_memory_MemTotal_bytes",
"format": "table",
"hide": false,
"instant": true,
"legendFormat": "内存大小",
"range": false,
"refId": "H"
},
{
"datasource": {
"type": "prometheus",
"uid": "e3ce7ecd-309b-4da0-b260-a7914240b105"
},
"editorMode": "code",
"exemplar": false,
"expr": "node_netstat_Tcp_CurrEstab",
"format": "table",
"hide": false,
"instant": true,
"legendFormat": "连接数",
"range": false,
"refId": "J"
},
{
"datasource": {
"type": "prometheus",
"uid": "e3ce7ecd-309b-4da0-b260-a7914240b105"
},
"editorMode": "code",
"exemplar": false,
"expr": "node_sockstat_TCP_tw",
"format": "table",
"hide": false,
"instant": true,
"legendFormat": "tcp_time_wait",
"range": false,
"refId": "I"
},
{
"datasource": {
"type": "prometheus",
"uid": "e3ce7ecd-309b-4da0-b260-a7914240b105"
},
"editorMode": "code",
"exemplar": false,
"expr": "up{instance=~\".*9100\"}",
"format": "table",
"hide": false,
"instant": true,
"legendFormat": "__auto",
"range": false,
"refId": "K"
},
{
"datasource": {
"type": "prometheus",
"uid": "e3ce7ecd-309b-4da0-b260-a7914240b105"
},
"editorMode": "code",
"exemplar": false,
"expr": "node_time_seconds - node_boot_time_seconds",
"format": "table",
"hide": false,
"instant": true,
"legendFormat": "启动时间",
"range": false,
"refId": "C"
}
],
"title": "主机运行状态视图",
"transformations": [
{
"id": "joinByField",
"options": {
"byField": "instance",
"mode": "outer"
}
},
{
"id": "filterFieldsByName",
"options": {
"include": {
"names": [
"instance",
"nodename",
"Value #B",
"Value #D",
"Value #F",
"Value #G",
"Value #H",
"Value #J",
"Value #I",
"Value #K",
"Value #C",
"Value #E"
]
}
}
},
{
"id": "filterByValue",
"options": {
"filters": [
{
"config": {
"id": "regex",
"options": {
"value": ".*9100"
}
},
"fieldName": "instance"
}
],
"match": "all",
"type": "include"
}
}
],
"type": "table"
}
],
"refresh": "",
"schemaVersion": 38,
"style": "dark",
"tags": [],
"templating": {
"list": []
},
"time": {
"from": "now-6h",
"to": "now"
},
"timepicker": {},
"timezone": "",
"title": "主机信息表new",
"uid": "cbde36c4-615d-4434-a668-7a11c4d8bb10",
"version": 37,
"weekStart": ""
}
