代码如下
``` <script setup>
import { onMounted, ref } from 'vue'
import * as echarts from 'echarts';
import { orderDistributeStatic } from '../static.js'
// 初始化列表
const initial = () => {
  const myChart = echarts.init(document.getElementById('order-distribute-chart'))
  const data = orderDistributeStatic
  data.sort(function (a, b) {
    return a.value - b.value
  })

  // 订单分布echarts图表数据
  const barOption = {
    tooltip: {
      borderColor: '#EBEEF5',
      borderWidth: 1,
      padding: [5, 16, 5, 14],
      trigger: 'axis',
      backgroundColor: 'rgba(255,255,255,0.96)',
      formatter: (params) => {
        return (
          '<span style="color:#818693;font-size:12px;margin-right:25px;margin-bottom:4px;display:inline-block">省份:</span>' +
          '<span style="color:#20232A;font-size:12px;display:inline-block">' + params[0].name + '</span>' + '<br />' + ('<span style="color:#818693;font-size:12px;margin-bottom:4px;display:inline-block">订单总量:</span>' + '<span style="color:#20232A;font-size:12px;display:inline-block;float:right">' + params[0].data + '笔' + '</span>')
        )
      }
    },
    xAxis: {
      type: 'value',
      axisLine: {
        show: false
      },
      axisTick: {
        show: false
      },
      axisLabel: {
        margin: 17
      },
      splitLine: {
        lineStyle: {
          color: '#EBEEF5'
        }
      }
    },
    grid: {
      left: '3%',
      right: '4%',
      bottom: '0%',
      height: '100%',
      containLabel: true
    },
    yAxis: {
      type: 'category',
      axisLabel: {
        // rotate: 30,
        interval: 0,
        fontSize: 11,
        color: '#20232A'
      },
      axisLine: {
        lineStyle: {
          color: '#EBEEF5'
        }
      },
      axisTick: {
        show: false
      },
      data: data.map(function (item) {
        return item.name
      })
    },
    animationDurationUpdate: 1000,
    series: {
      type: 'bar',
      id: 'population',
      data: data.map(function (item) {
        return item.value
      }),
      universalTransition: true,
      barWidth: 5,
      itemStyle: {
        color: '#E15536'
      }
    }
  }
  myChart.setOption(barOption)
  // 当窗口或者大小发生改变时执行resize,重新绘制图表
  window.addEventListener('resize', function () {
    myChart.resize()
  })
}
onMounted(() => {
  initial()
})


</script>

<template>
  <div id="order-distribute-chart">

  </div>
</template>

<style lang="scss" scoped>
#line-manage-chart {
  height: 400px;
}

#order-distribute-chart {
  height: 480px;
}
</style>
用到的数据 import { orderDistributeStatic } from '../static.js'
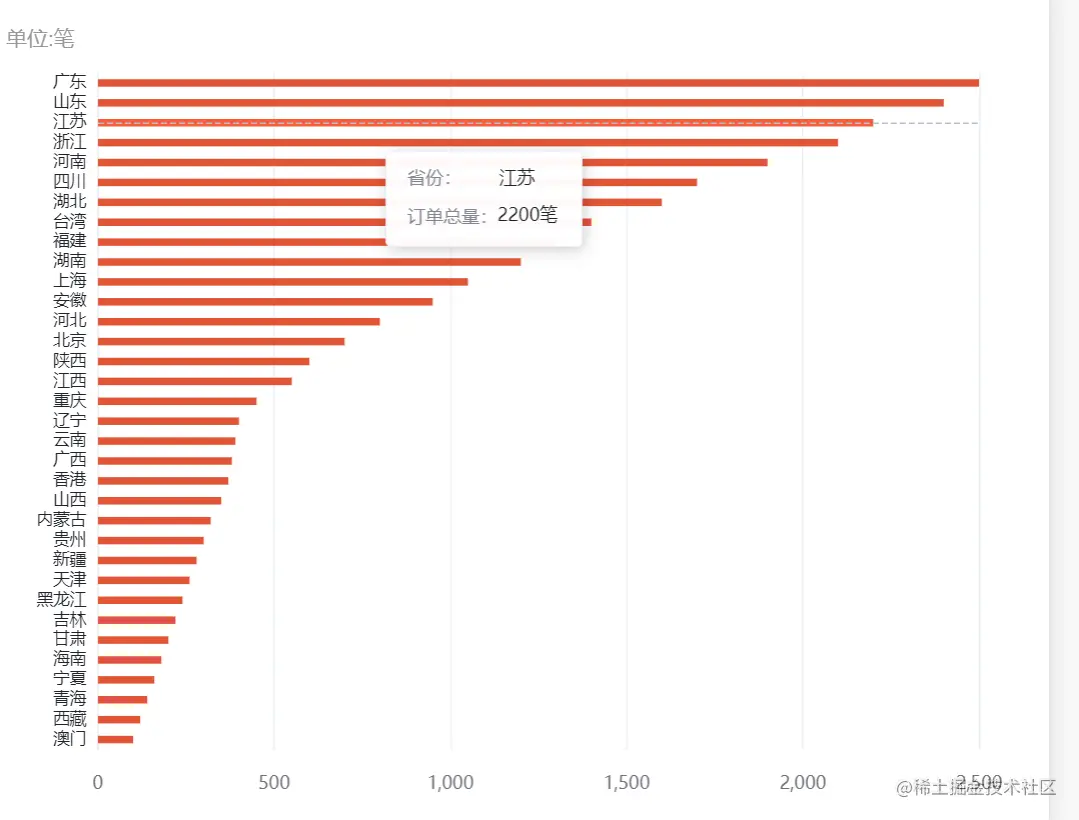
``` // 订单分布数据
export const orderDistributeStatic = [
  { name: '广东', value: 2500 },
  { name: '山东', value: 2400 },
  { name: '江苏', value: 2200 },
  { name: '浙江', value: 2100 },
  { name: '河南', value: 1900 },
  { name: '四川', value: 1700 },
  { name: '湖北', value: 1600 },
  { name: '台湾', value: 1400 },
  { name: '福建', value: 1300 },
  { name: '湖南', value: 1200 },
  { name: '上海', value: 1050 },
  { name: '安徽', value: 950 },
  { name: '河北', value: 800 },
  { name: '北京', value: 700 },
  { name: '陕西', value: 600 },
  { name: '江西', value: 550 },
  { name: '重庆', value: 450 },
  { name: '辽宁', value: 400 },
  { name: '云南', value: 390 },
  { name: '广西', value: 380 },
  { name: '香港', value: 370 },
  { name: '山西', value: 350 },
  { name: '内蒙古', value: 320 },
  { name: '贵州', value: 300 },
  { name: '新疆', value: 280 },
  { name: '天津', value: 260 },
  { name: '黑龙江', value: 240 },
  { name: '吉林', value: 220 },
  { name: '甘肃', value: 200 },
  { name: '海南', value: 180 },
  { name: '宁夏', value: 160 },
  { name: '青海', value: 140 },
  { name: '西藏', value: 120 },
  { name: '澳门', value: 100 }
]


