一、下载echarts
npm install echarts@5.3.3
二、main.js全局引入
import * as echarts from "echarts"
Vue.prototype.$echarts = echarts
三、新建ChartExample.vue测试
<template>
  <div id="main" style="height: 400px; width: 400px"></div>
</template>

<script>
export default {
  name: "ChartExample",
  data() {
    return {
      option: {
        series: [
          {
            type: "gauge",
            progress: {
              show: true,
              width: 18,
            },
            axisLine: {
              lineStyle: {
                width: 18,
              },
            },
            axisTick: {
              show: false,
            },
            splitLine: {
              length: 15,
              lineStyle: {
                width: 2,
                color: "#999",
              },
            },
            axisLabel: {
              distance: 25,
              color: "#999",
              fontSize: 20,
            },
            anchor: {
              show: true,
              showAbove: true,
              size: 25,
              itemStyle: {
                borderWidth: 10,
              },
            },
            title: {
              show: false,
            },
            detail: {
              valueAnimation: true,
              fontSize: 80,
              offsetCenter: [0, "70%"],
            },
            data: [
              {
                value: 70,
              },
            ],
          },
        ],
      },
    };
  },
  methods: {
    initChart() {
      let chartDom = document.getElementById("main");
      let myChart = this.$echarts.init(chartDom);
      myChart.setOption(this.option);
    },
  },
  mounted() {
    this.initChart();
  },
};
</script>
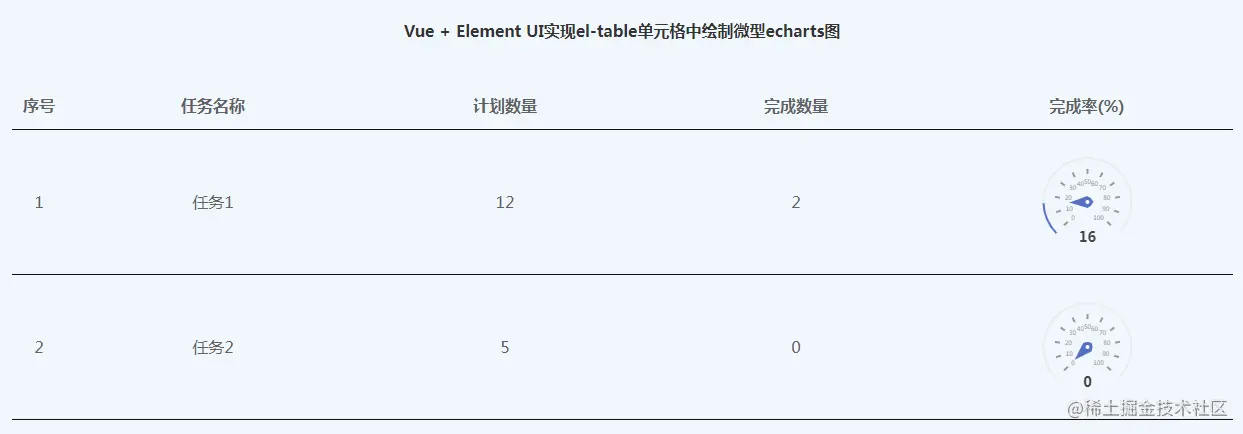
四、el-table单元格中绘制echarts图
<template>
<el-container>
<el-header>
<span style="line-height: 60px"
><strong
>Vue + Element UI实现el-table单元格中绘制微型echarts图</strong
></span
>
</el-header>
<el-main>
<el-table
:data="taskList"
style="width: 100%"
:header-cell-style="{
background: '#f2f7fc',
color: '#606266',
fontSize: '16px',
borderBottom: '1px solid #111111',
}"
:row-style="{
background: '#f2f7fc',
color: '#606266',
fontSize: '16px',
}"
>
<el-table-column
type="index"
label="序号"
align="center"
width="55"
></el-table-column>
<el-table-column
v-for="(item, index) in columns"
:key="index + '-column'"
:prop="item.prop"
:label="item.label"
align="center"
:show-overflow-tooltip="false"
></el-table-column>
<el-table-column label="完成率(%)" align="center">
<template slot-scope="scope">
{{ drawEcharts(scope.row, scope.$index) }}
<div
:id="`chart` + scope.$index"
style="min-height: 120px; min-width: 120px"
></div>
</template>
</el-table-column>
</el-table>
</el-main>
</el-container>
</template>
<script>
export default {
name: "ChartExample",
data() {
return {
taskList: [
{
taskNo: "任务1",
planNum: 12,
finishNum: 2,
},
{
taskNo: "任务2",
planNum: 5,
finishNum: 0,
},
],
columns: [
{
prop: "taskNo",
label: "任务名称",
},
{
prop: "planNum",
label: "计划数量",
},
{
prop: "finishNum",
label: "完成数量",
},
],
};
},
methods: {
drawEcharts(row, index) {
let percentageValue = parseInt((row.finishNum / row.planNum) * 100);
let option = {
series: [
{
type: "gauge",
progress: {
show: true,
width: 2,
},
axisLine: {
lineStyle: {
width: 2,
},
},
axisTick: {
show: false,
},
splitLine: {
length: 5,
lineStyle: {
width: 2,
color: "#999",
},
},
axisLabel: {
distance: 7,
color: "#999",
fontSize: 6,
},
anchor: {
show: true,
showAbove: true,
size: 7,
itemStyle: {
borderWidth: 3,
},
},
pointer: {
length: "40%",
},
title: {
show: false,
},
detail: {
valueAnimation: false,
fontSize: 14,
offsetCenter: [0, "80%"],
},
data: [
{
value: percentageValue,
},
],
},
],
};
let chartId = "chart" + index;
this.$nextTick(() => {
this.$echarts.dispose(document.getElementById(chartId));
let myChart = this.$echarts.init(document.getElementById(chartId));
myChart.setOption(option);
myChart.resize();
});
},
},
};
</script>
<style scoped>
.el-container {
margin: 0 auto;
height: 100%;
width: 100%;
background-color: #f2f7fc;
padding: 1.5% 1.5% 1.5% 1.5%;
}
/deep/.el-table td,
.building-top .el-table th.is-leaf {
border-bottom: 0.5px solid #111111;
}
/deep/.el-table::before {
border-bottom: 0.5px solid #111111;
}
</style>
五、效果图
六、参考资料
www.zhangshengrong.com/p/AvN6YDWna…
echarts.apache.org/examples/zh…


