这是我参与「第五届青训营 」伴学笔记创作活动的第 1 天
这里是GO编程规范,性能优化,pprof的实战使用,pprof工作原理等
Brief Introduction
- 如何编写更简洁清晰的代码
- 常用Go语言程序优化手段
- 熟悉Go程序性能分析工具
- 了解工程中性能优化的原则和流程
高质量编程
代码正确可靠,简单清晰,就是高质量
- 高质量例如:
- 边界条件处理
- 一场情况处理
- 可维护性
简介
- 简单性
- 消除“多余的复杂性”,简单清晰
- 不理解的代码无法修复改进
- 可读性
- 代码写给人看的,而不是机器
- 编写可维护的代码第一步保证代码可读
- 生产力
- 团队整体工作效率非常重要
规范
- 例如:
- 代码格式
- 注释
- 命名规范
- 控制流程
- 错误和异常处理
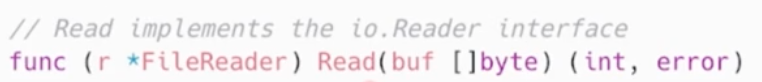
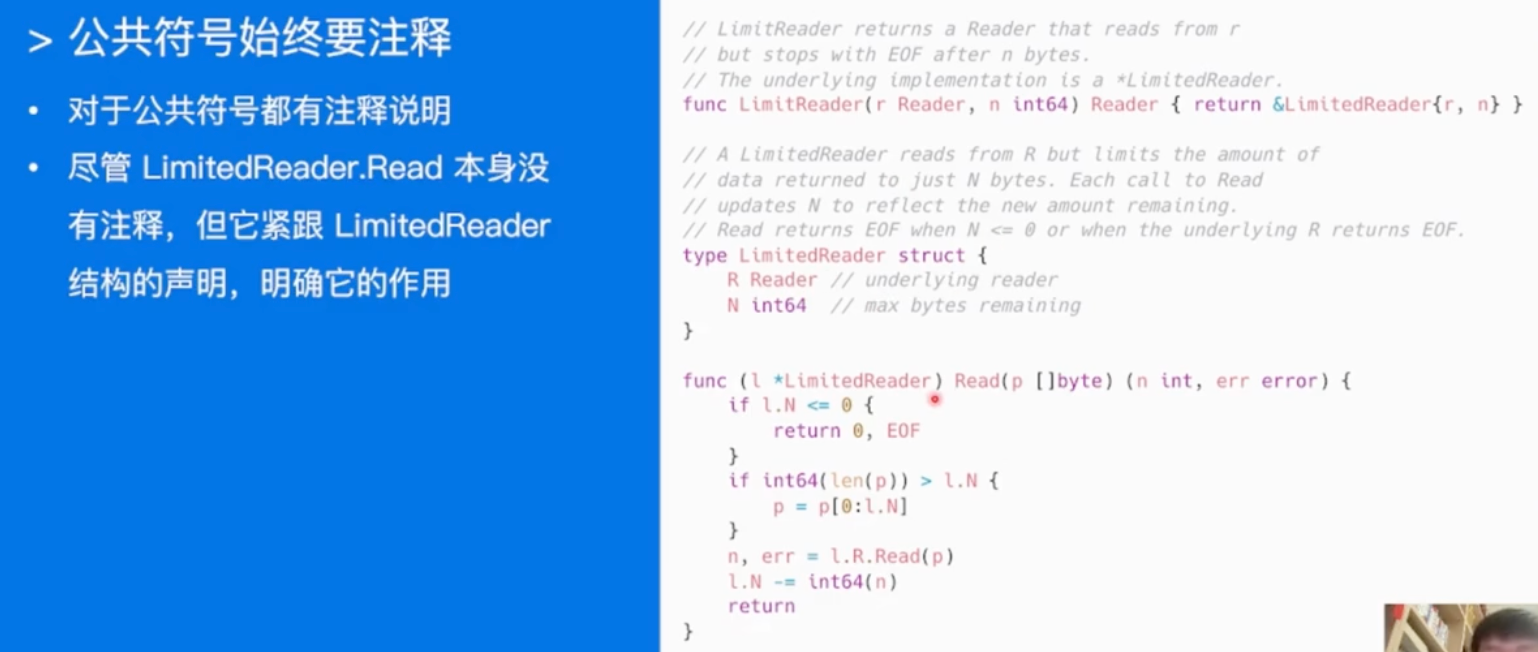
不需要注释实现接口的方法,例如:
代码格式
Goland中gofmth饿goimports工具
Gofmt:自动格式化Go语言代码为官方统一风格。
Go imports:依赖包管理,自动增删依赖的包的引用,将依赖包按照字母排序并分类。
- Goland上配置好,保存文件的时候,自动就会进行处理好。(配置见References)
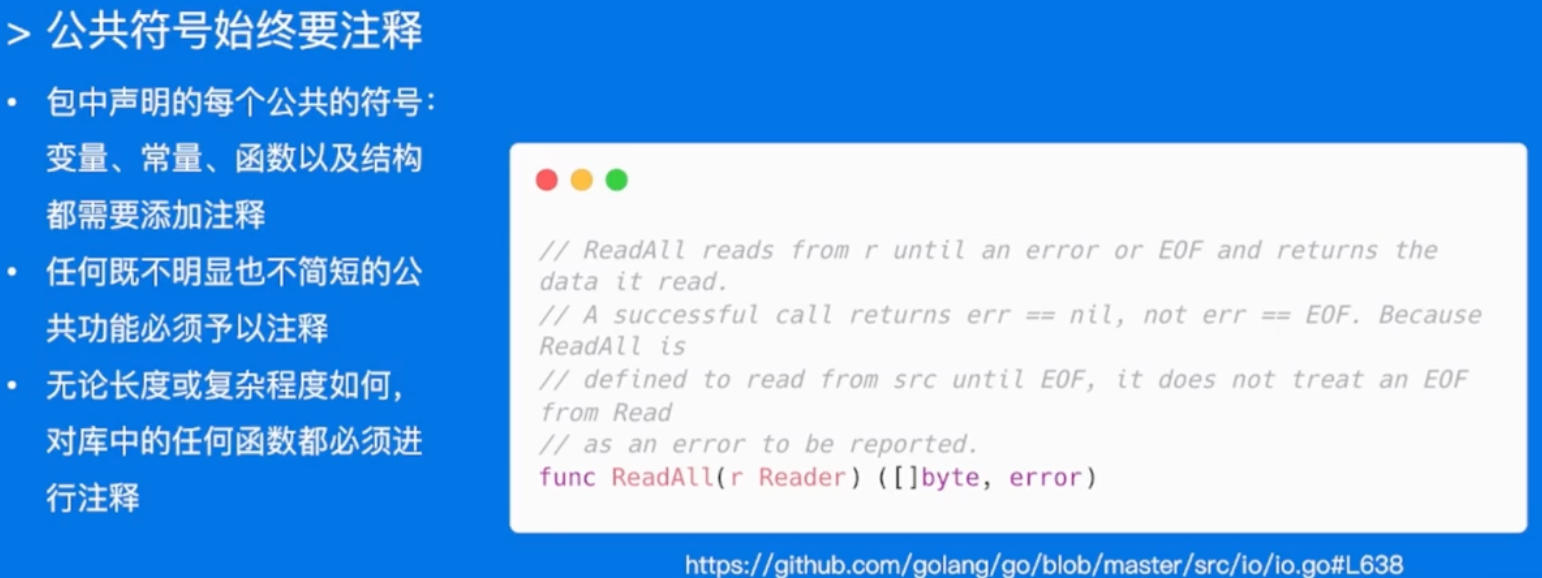
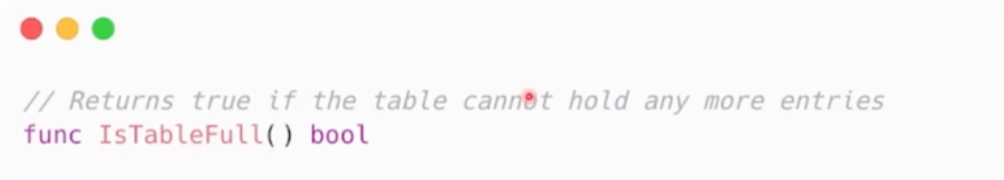
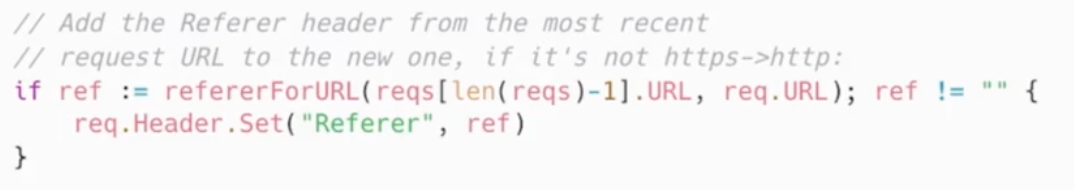
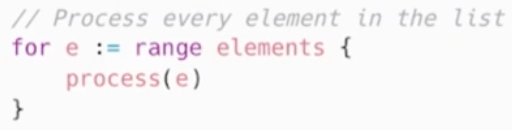
注释
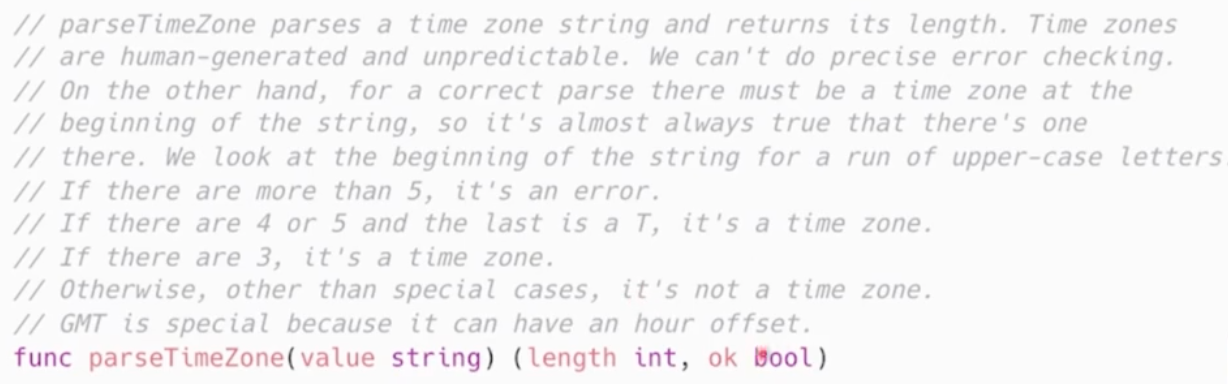
- 注释应该做的:
- 代码作用
- 如何做的
- 实现的原因
- 什么情况会出错
下面的例子中,都是第一个好,第二个坏,自己体会!!!
- 代码作用
- 如何做的
- 实现的原因
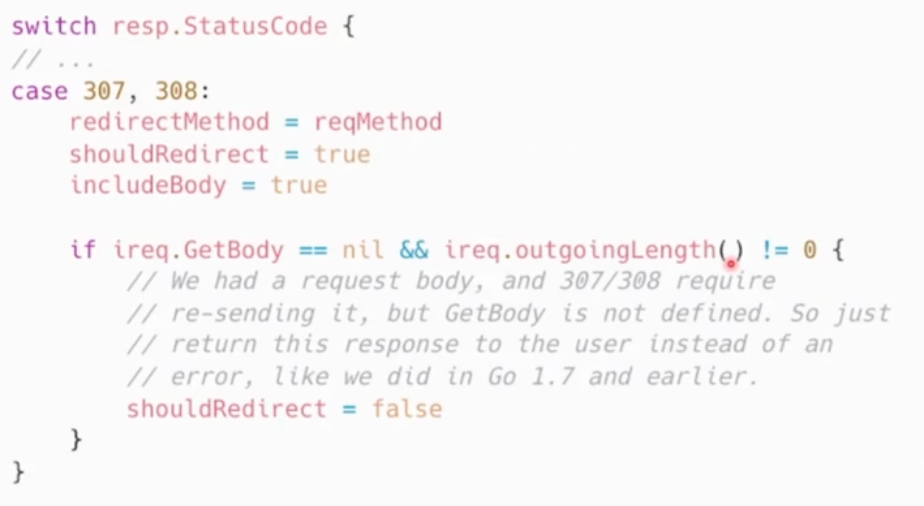
- 什么情况会出错
- 小结:
- 代码是最好的注释(注释和代码可能对不上)
- 注释和代码互补,提供代码提供不了的上下文信息
命名规范
-
var
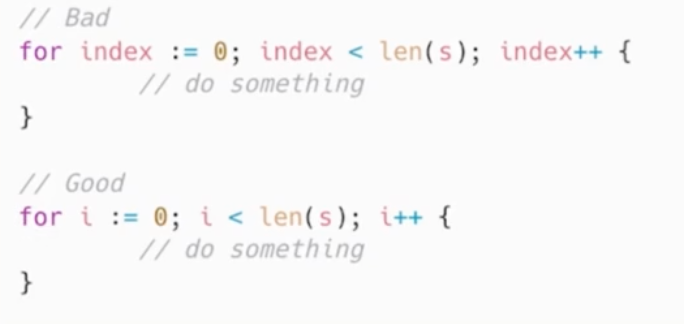
- 简单胜于冗长
- 缩略词:
- 需要导出:ServerHTTP, XMLHTTPRequest
- 不需要导出:xmlHTTPRequest
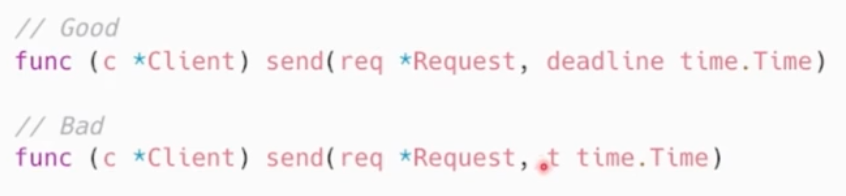
- 变量距离被使用的地方越远,则需要携带越多的上下文信息
-
function
- 不携带包名上下文信息,包名和函数名总是成对出现的
- 短
- foo包返回类型Foo时,可省略类型信息而不导致歧义
- foo包返回T(Not Foo)时,可以加入类型信息
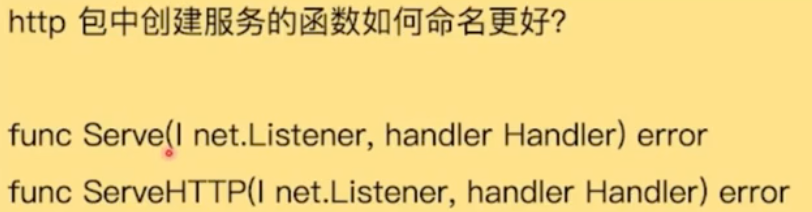
调用的时候:http.Serve(),可能就不需要serveHttp就好了昂
-
package
- 小写字母组成,不要大写&下划线
- 简短&包含一定上下文信息,例如schema等
- 不要与标准库同名,例如sync or strings

-
核心:
- 降低阅读和理解代码的成本
- 重点考虑上下文信息,设计简洁清晰的名称
good naming is like a good joke. If you have to explain it, it's not funny.
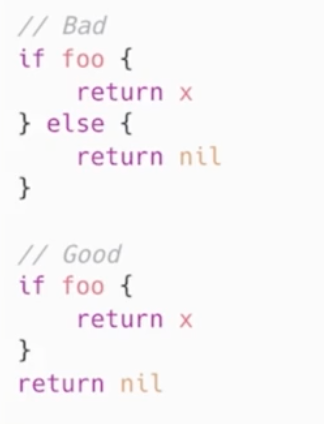
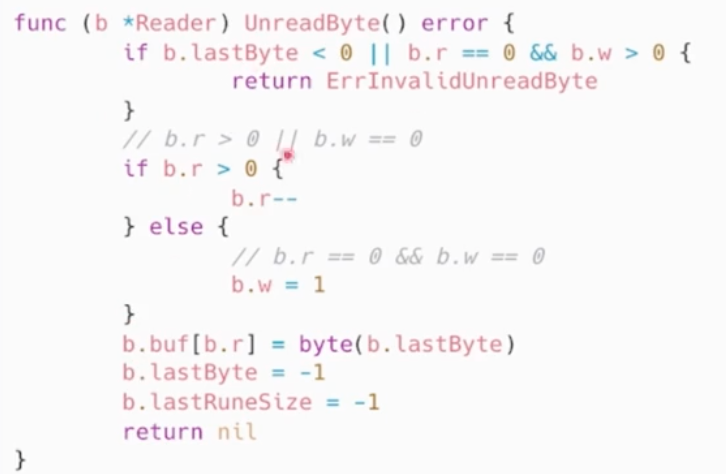
控制流程
- 避免嵌套,保持正常流程清晰
两个分支都包含else,可以把冗余的else去掉
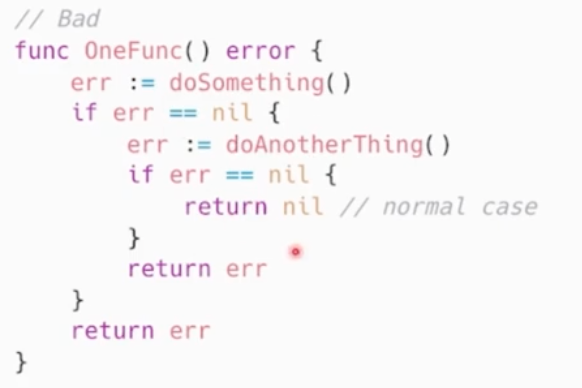
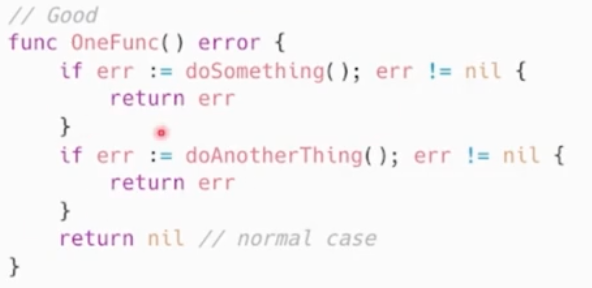
- 保持正常代码为最小路径:
优先处理错误情况/特殊情况,尽早返回或者继续循环来减少嵌套。
- 小结:

错误和异常处理
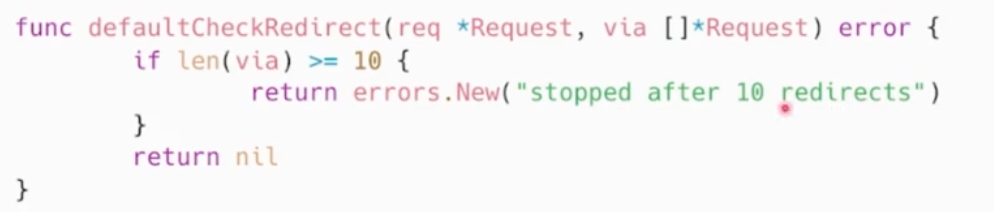
- 简单错误
只出现一次,不需要别的地方捕获
优先使用errors.New来创建匿名变量来直接表示简单错误
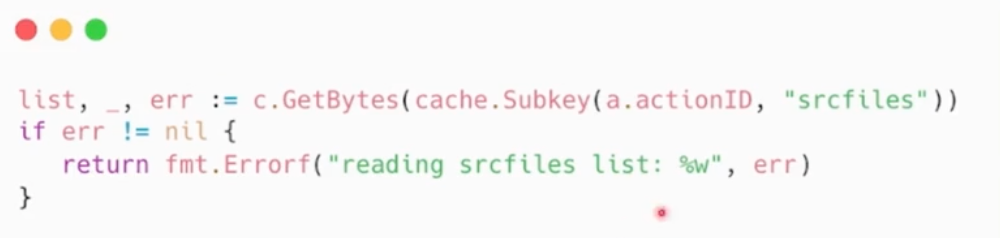
如果有格式化的需求,使用fmt.Errorf
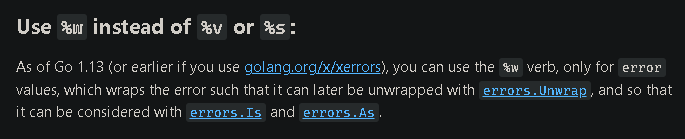
- 错误的Wrap和Unwrap

- 错误判定
errors.Is

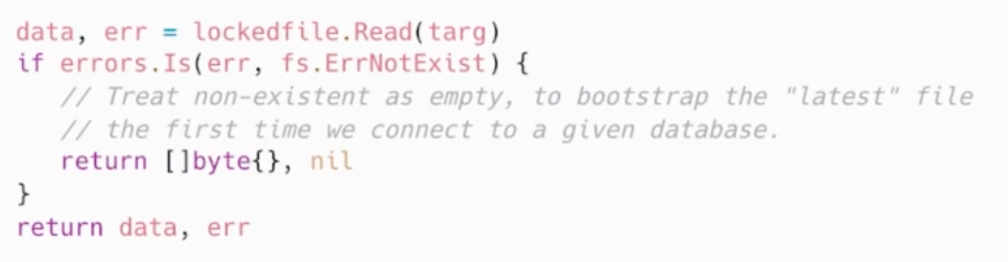
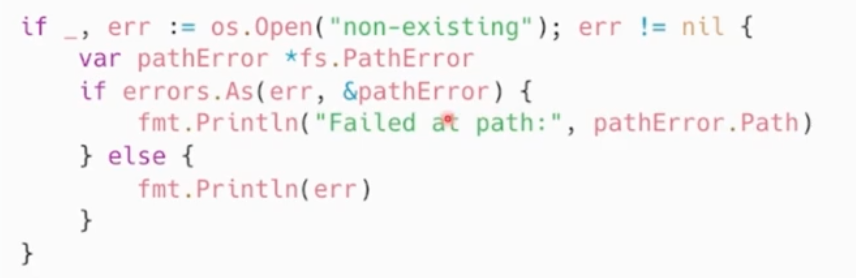
- 错误判定
errors.As:错误链上捕获特定种类的错误,使用errors.As
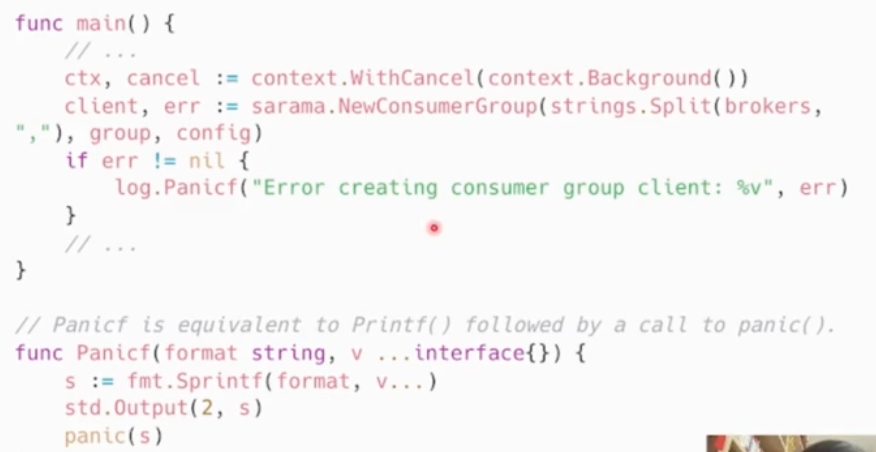
- panic

- Recover

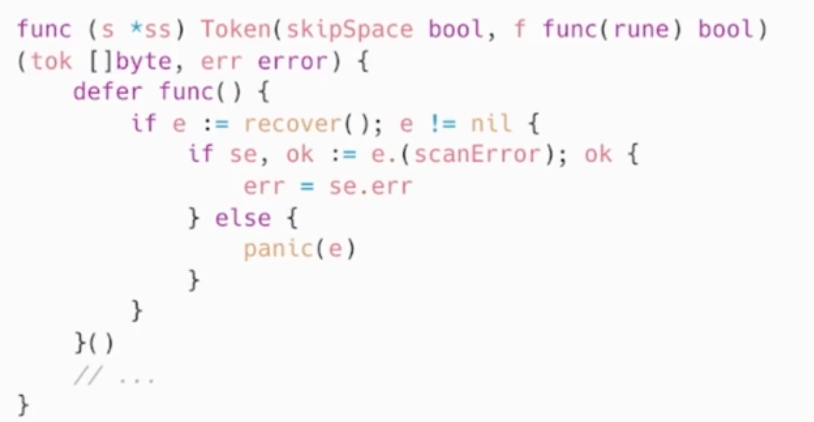
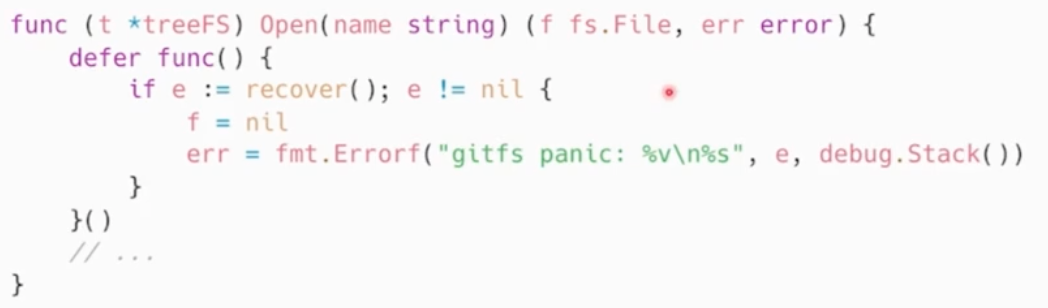
如果需要更多的上下文信息,可以 recover 后在 log 中记录当前的调用栈
- 小结:

// good
time.Now()
// bad
time.NowTime()

// good
time.parseDuration()
// bad
time.parse()
- Defer:
Defer是把操作压栈了,后进先出
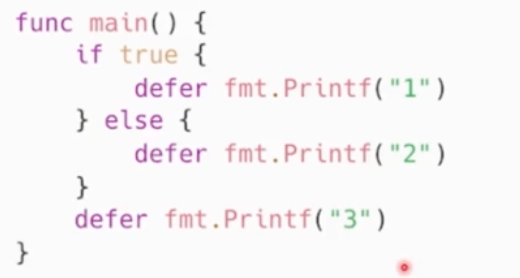
最终输出:31
性能优化建议
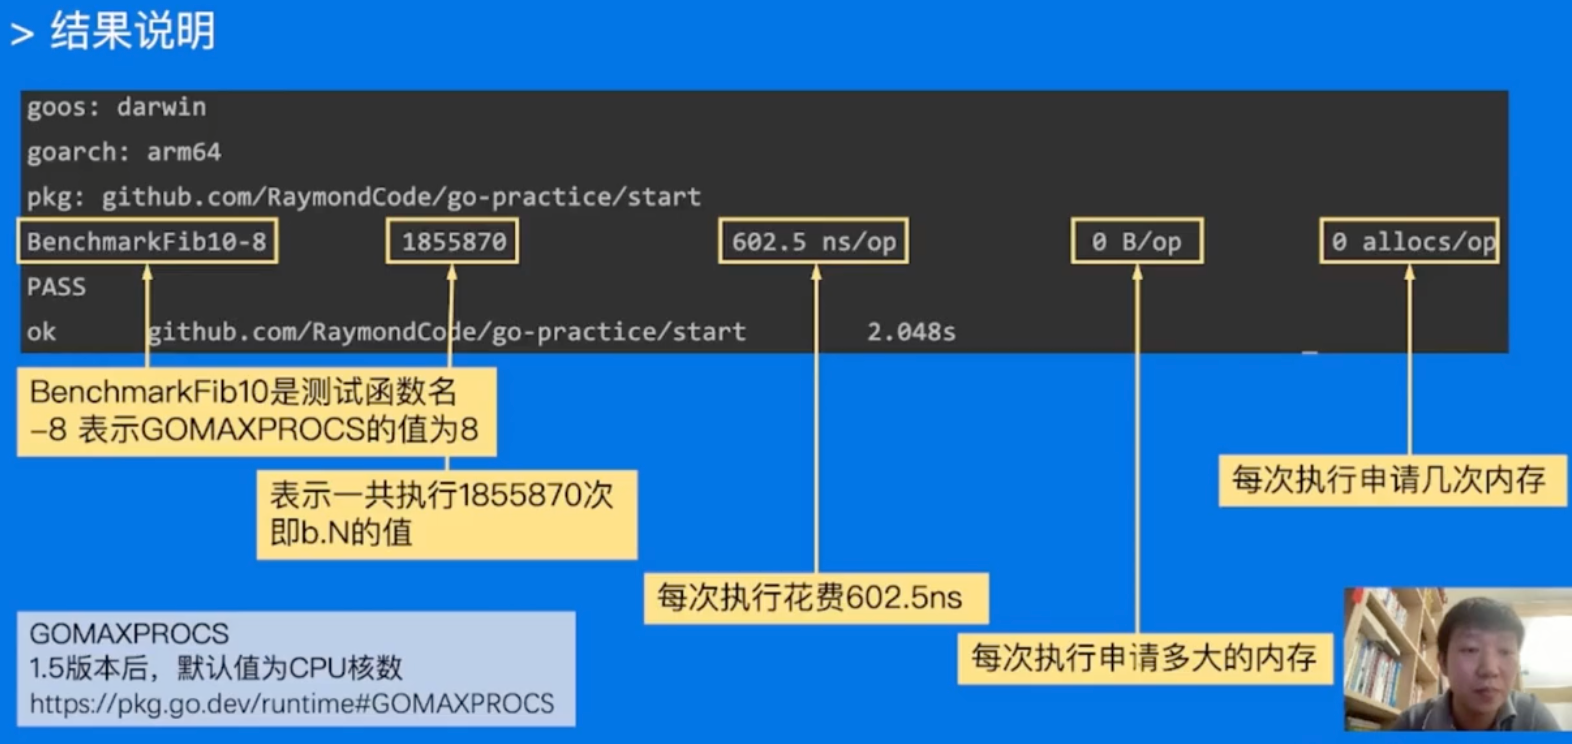
Benchmark
-
如何使用
-
性能表现需要实际数据衡量
-
Go语言自带提供了支持基准性能测试的benchmark工具
-
go test -bench=. -benchmem
-
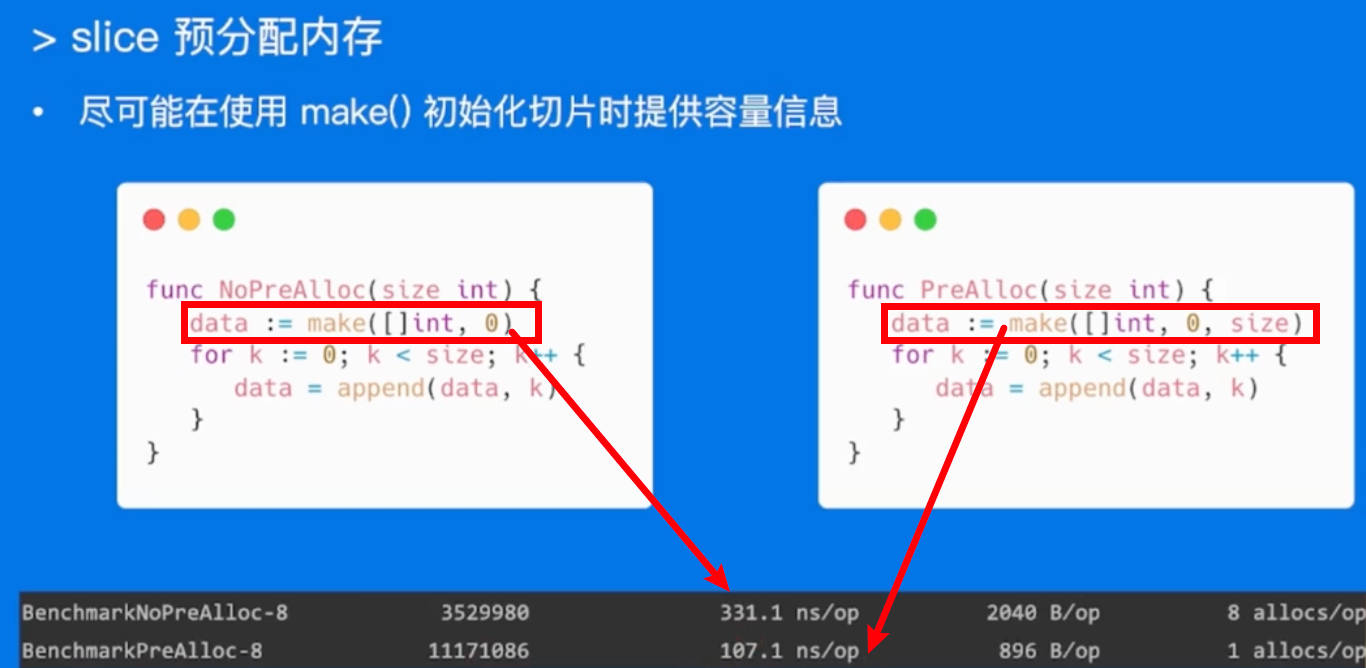
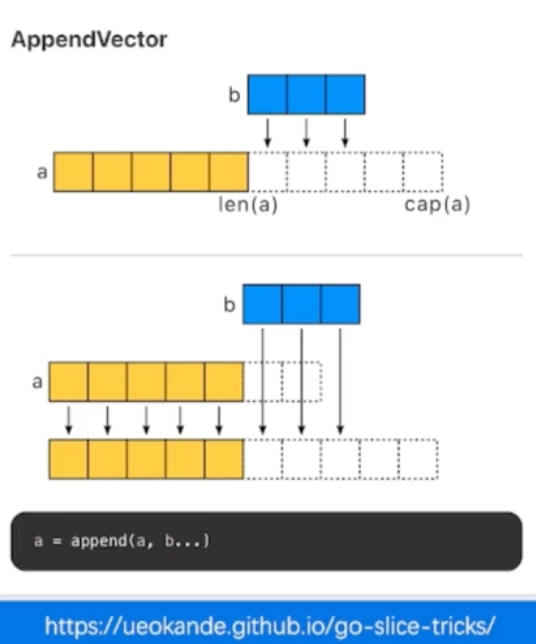
Slice
预先分配内存
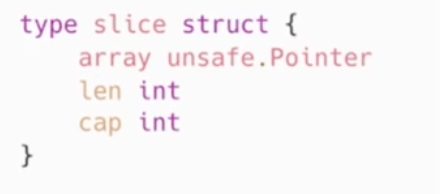
slice本质是一个数组片段的描述:
数组指针
片段长度
片段容量
切片草足并不复制指向的元素
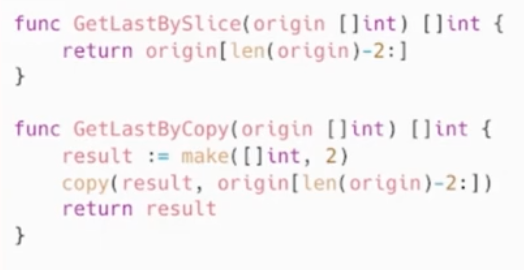
创建一个新的切片,会复用原来切片的底层数组
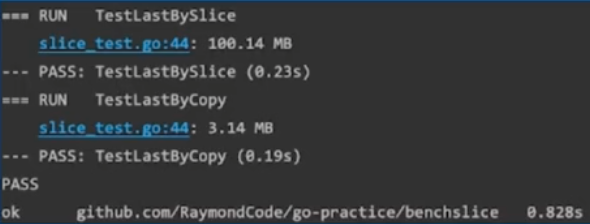
大陷阱:大内存未释放

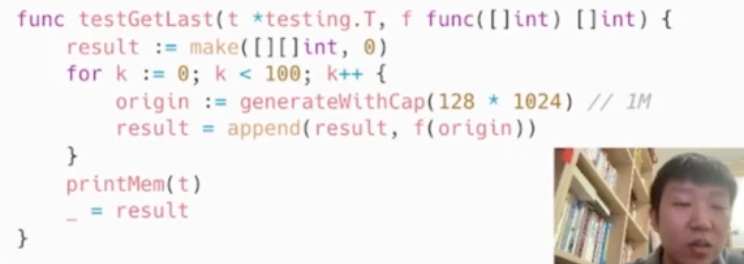
go test -run=. -v
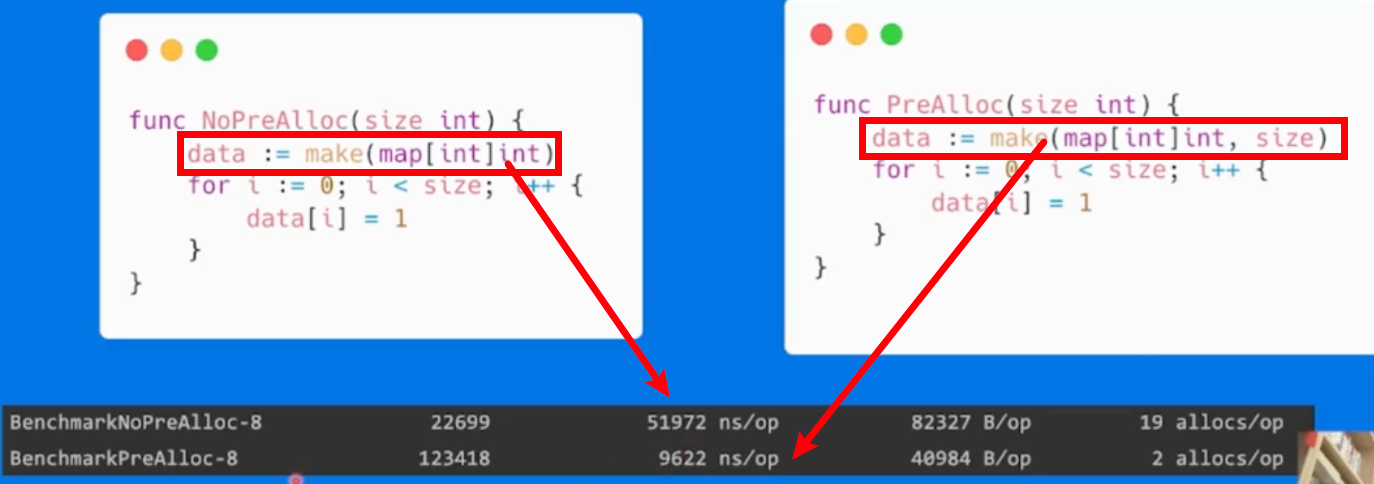
map
预先分配内存

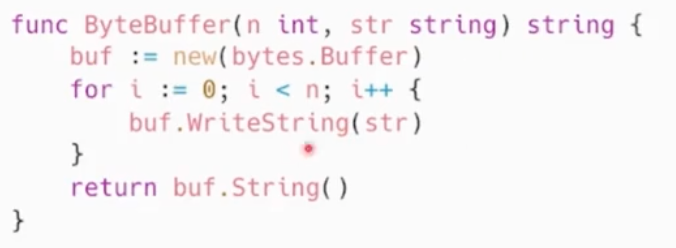
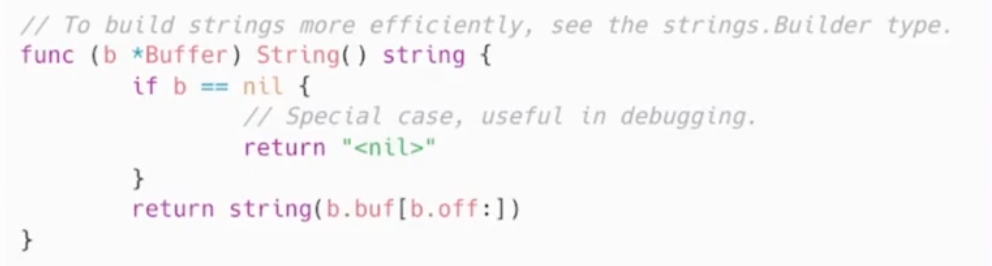
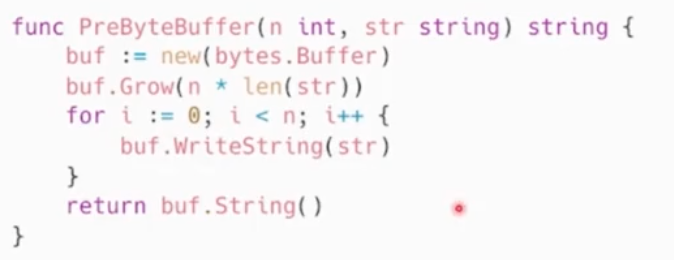
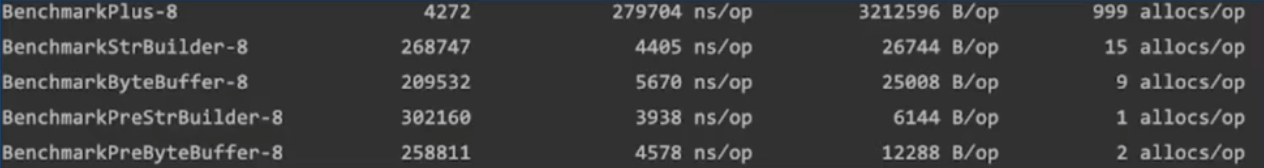
字符串处理
多类型对比
- 使用类型:
s += strvar builder strings.Builder; builder.WriteString(str);buf := new[bytes.Buffer]; buf.WriteString(str);
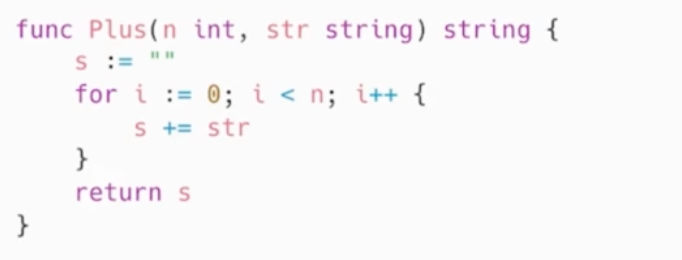
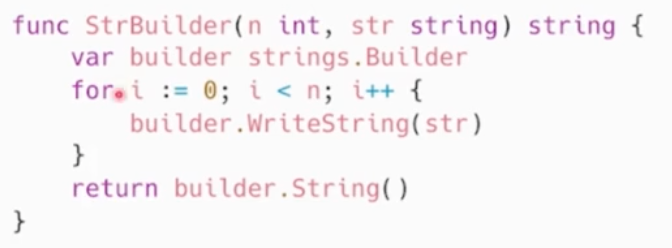

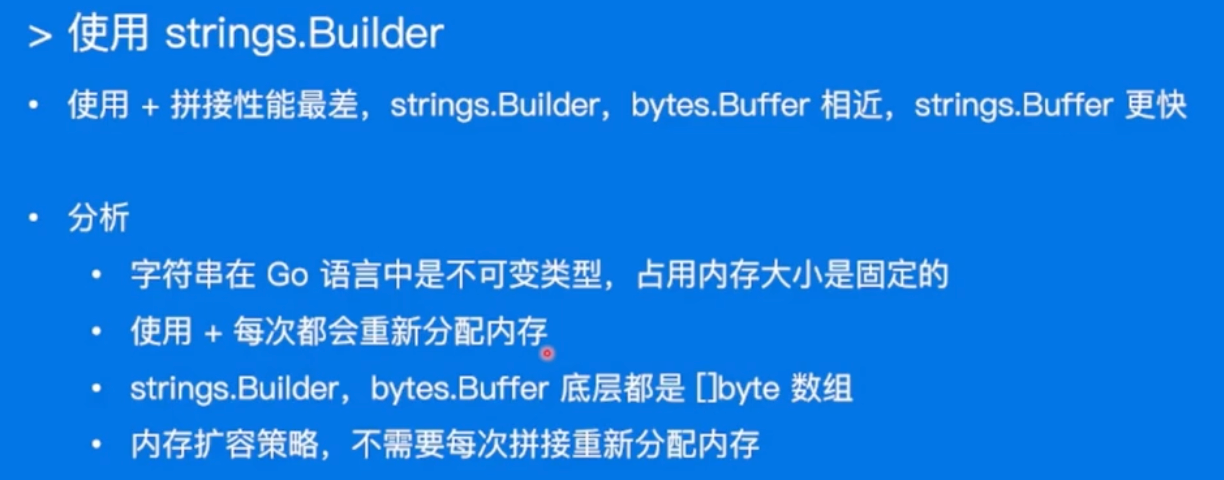
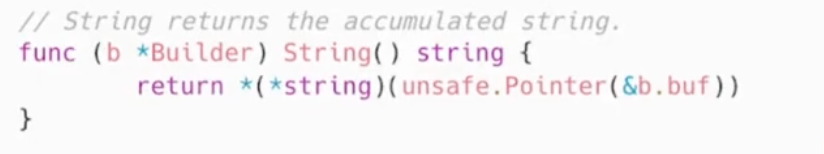
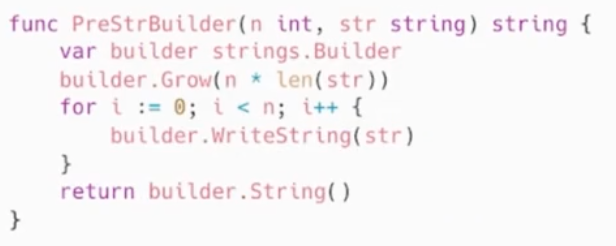
使用strings.Builder

预分配
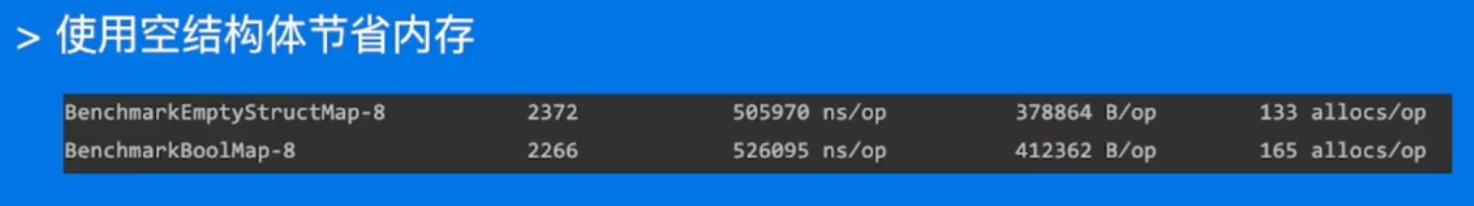
空结构体

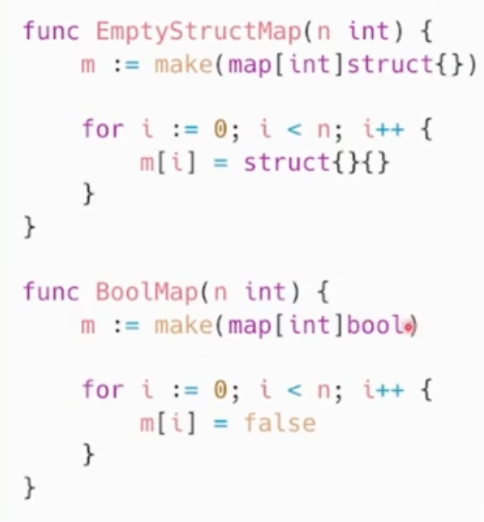
- 使用场景:
- 实现Set,可以用map来代替。
- Set因为只用到map的key,用map来代替昂,value就是空结构体就行。
- 即使将map的value设置为bool,也会多占一个字节空间
一个开源实现:github.com/deckarep/go…
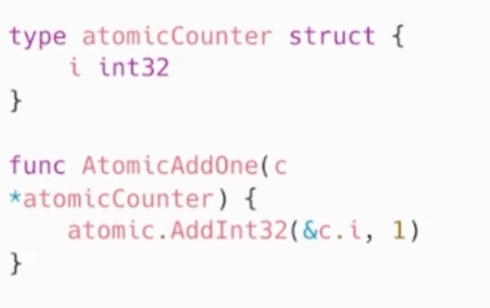
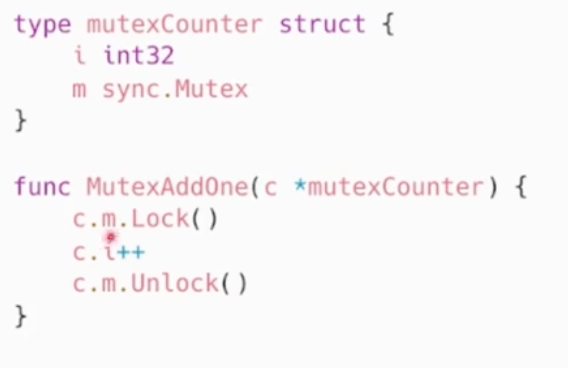
atomic包


性能调优实战
原则:
- 依靠数据而不是猜测
- 定位最大瓶颈而不是细枝末节
- 不要过早优化
- 不要过度优化
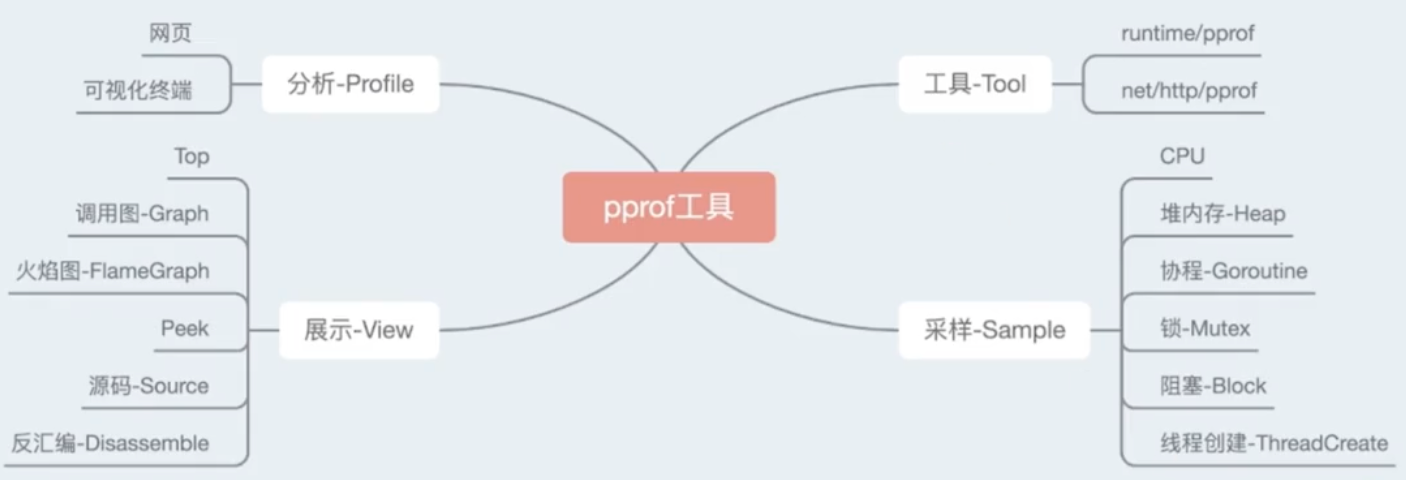
pprof
希望耗费了多少CPU, Memory
pprof可视化和分析性能分析数据的工具
排查实战-CPU
Github link: github.com/wolfogre/go…
项目提前有一些bomb,会占用1CPU核心和超过1GB的内存
服务拉下来,直接
go run起来就可以
- 打开服务的6060端口:
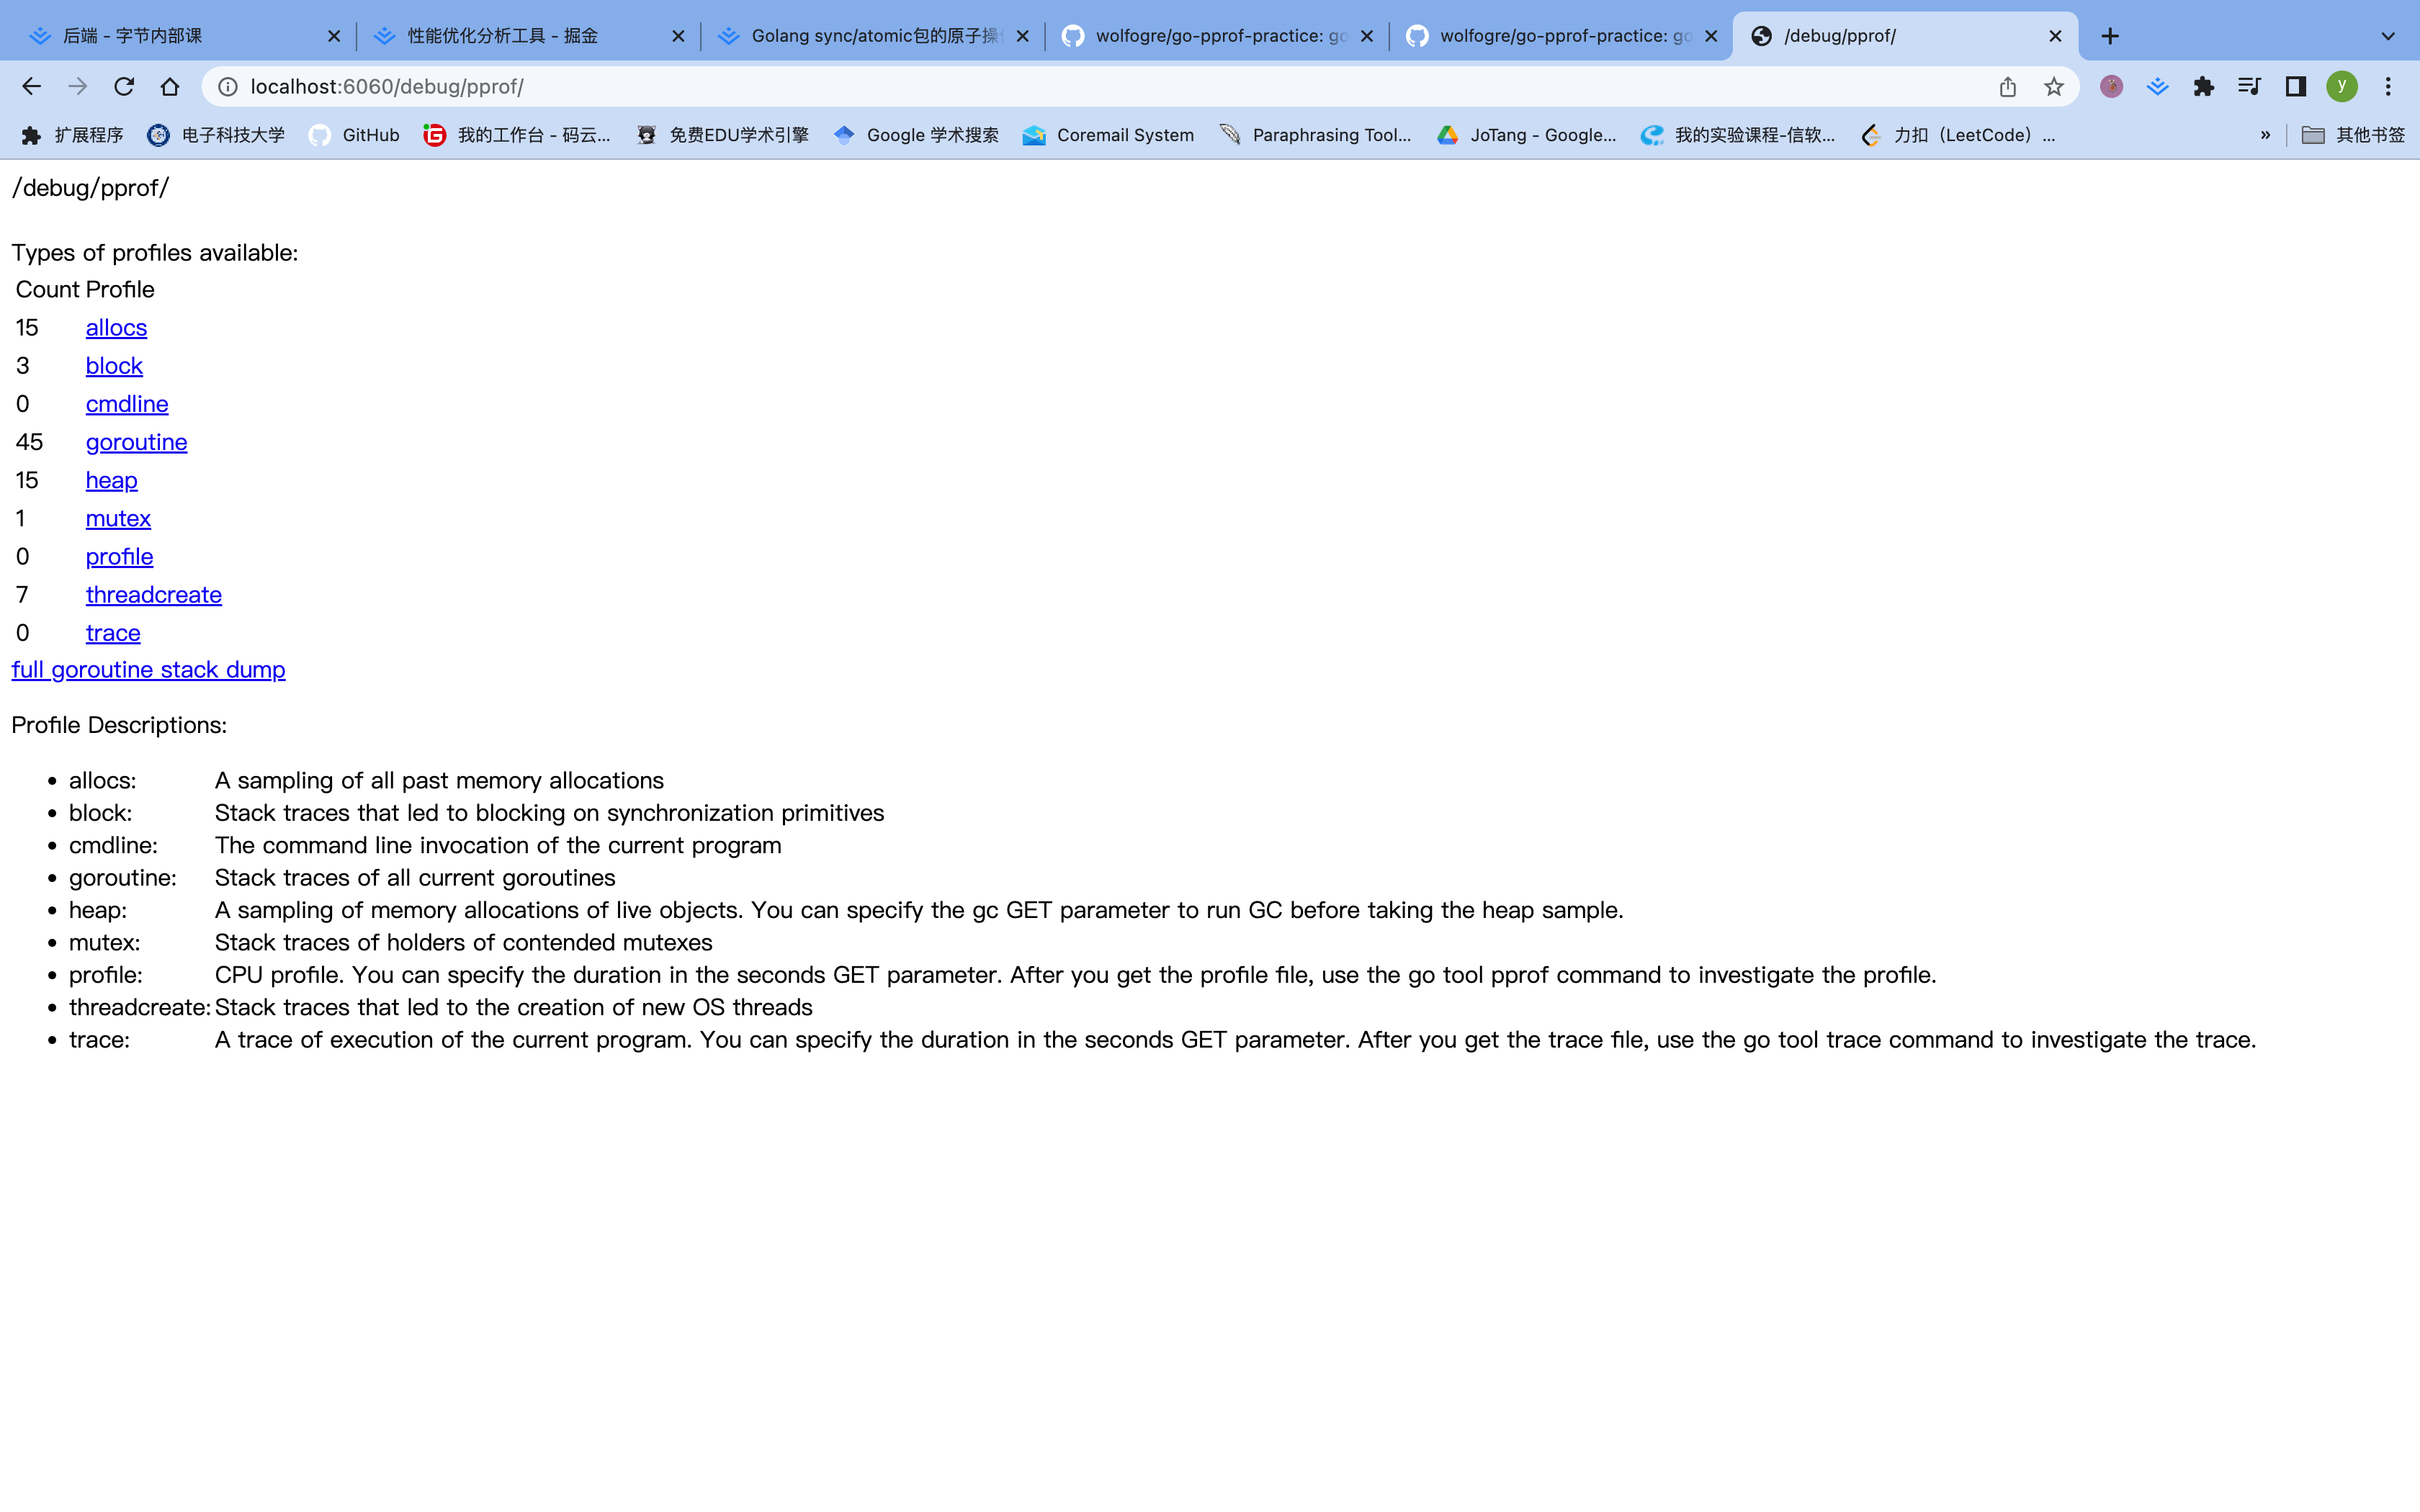
上面就展示了很多的性能选项,可以看出来昂,这里有一些分析的实战。
命令行工具直接采样
启动采样工具
- 启动采样工具:
go tool pprof "http://localhost:6060/debug/pprof/profile?seconds=10"
alex ~/my_code/go/Bytedance/go-pprof-practice [master] $ go tool pprof "http://localhost:6060/debug/pprof/profile?seconds=10"
Fetching profile over HTTP from http://localhost:6060/debug/pprof/profile?seconds=10
Saved profile in /Users/alex/pprof/pprof.samples.cpu.001.pb.gz
Type: cpu
Time: Jan 15, 2023 at 11:19am (CST)
Duration: 10.18s, Total samples = 4.58s (44.97%)
Entering interactive mode (type "help" for commands, "o" for options)
(pprof)
topN命令
- 查看占用资源最多的函数
topN,或者直接输入top也可以,结果为:
(pprof) top
Showing nodes accounting for 4570ms, 99.78% of 4580ms total
Dropped 11 nodes (cum <= 22.90ms)
      flat  flat%   sum%        cum   cum%
    4360ms 95.20% 95.20%     4570ms 99.78%  github.com/wolfogre/go-pprof-practice/animal/felidae/tiger.(*Tiger).Eat
     210ms  4.59% 99.78%      210ms  4.59%  runtime.asyncPreempt
         0     0% 99.78%     4570ms 99.78%  github.com/wolfogre/go-pprof-practice/animal/felidae/tiger.(*Tiger).Live
         0     0% 99.78%     4580ms   100%  main.main
         0     0% 99.78%     4580ms   100%  runtime.main

可以看到tiger.Eat()耗费了最多的时间昂!!!
- 上方数据的一些问题:
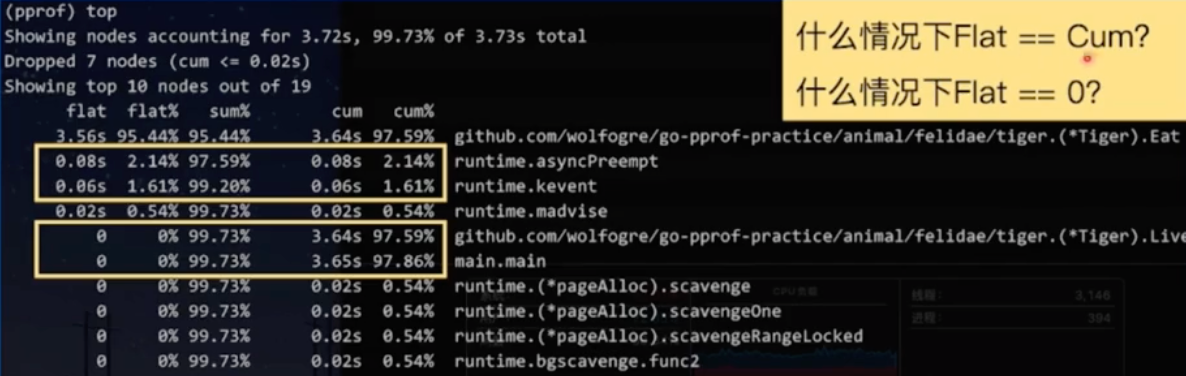
Flat == Cum: 函数中没有调用其他函数
Flat == 0: 函数中只有其他函数的调用
list命令
- list命令,根据正则表达式查找代码行
list Eat:查找实际的代码中,对应的Eat函数的内容
(pprof) list Eat
Total: 4.58s
ROUTINE ======================== github.com/wolfogre/go-pprof-practice/animal/felidae/tiger.(*Tiger).Eat in /Users/alex/my_code/go/Bytedance/go-pprof-practice/animal/felidae/tiger/tiger.go
     4.36s      4.57s (flat, cum) 99.78% of Total
         .          .     19:}
         .          .     20:
         .          .     21:func (t *Tiger) Eat() {
         .          .     22:   log.Println(t.Name(), "eat")
         .          .     23:   loop := 10000000000
     4.36s      4.57s     24:   for i := 0; i < loop; i++ {
         .          .     25:           // do nothing
         .          .     26:   }
         .          .     27:}
         .          .     28:
         .          .     29:func (t *Tiger) Drink() {
find a bomb!!!
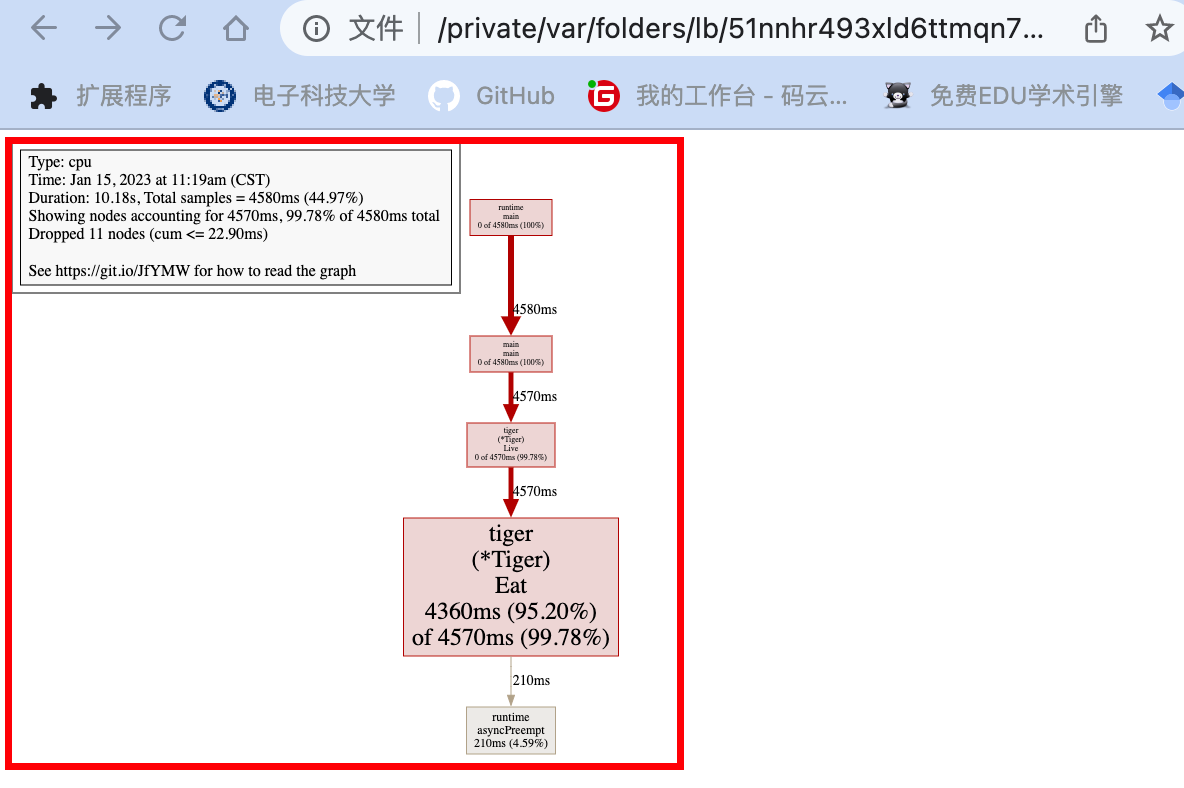
web命令
web,调用关系可视化
(pprof) web
fix the bug
- 把对应的loop给注释掉就ok啦!!!
排查实战-内存
命令行工具直接采样
go tool pprof -http=:8080 "http://localhost:6060/debug/pprof/heap",这种方式可以直接可视化结果昂,端口为8080。
alex ~/my_code/go/Bytedance/go-pprof-practice [master] $ go tool pprof -http=:8080 "http://localhost:6060/debug/pprof/heap"
Fetching profile over HTTP from http://localhost:6060/debug/pprof/heap
Saved profile in /Users/alex/pprof/pprof.alloc_objects.alloc_space.inuse_objects.inuse_space.001.pb.gz
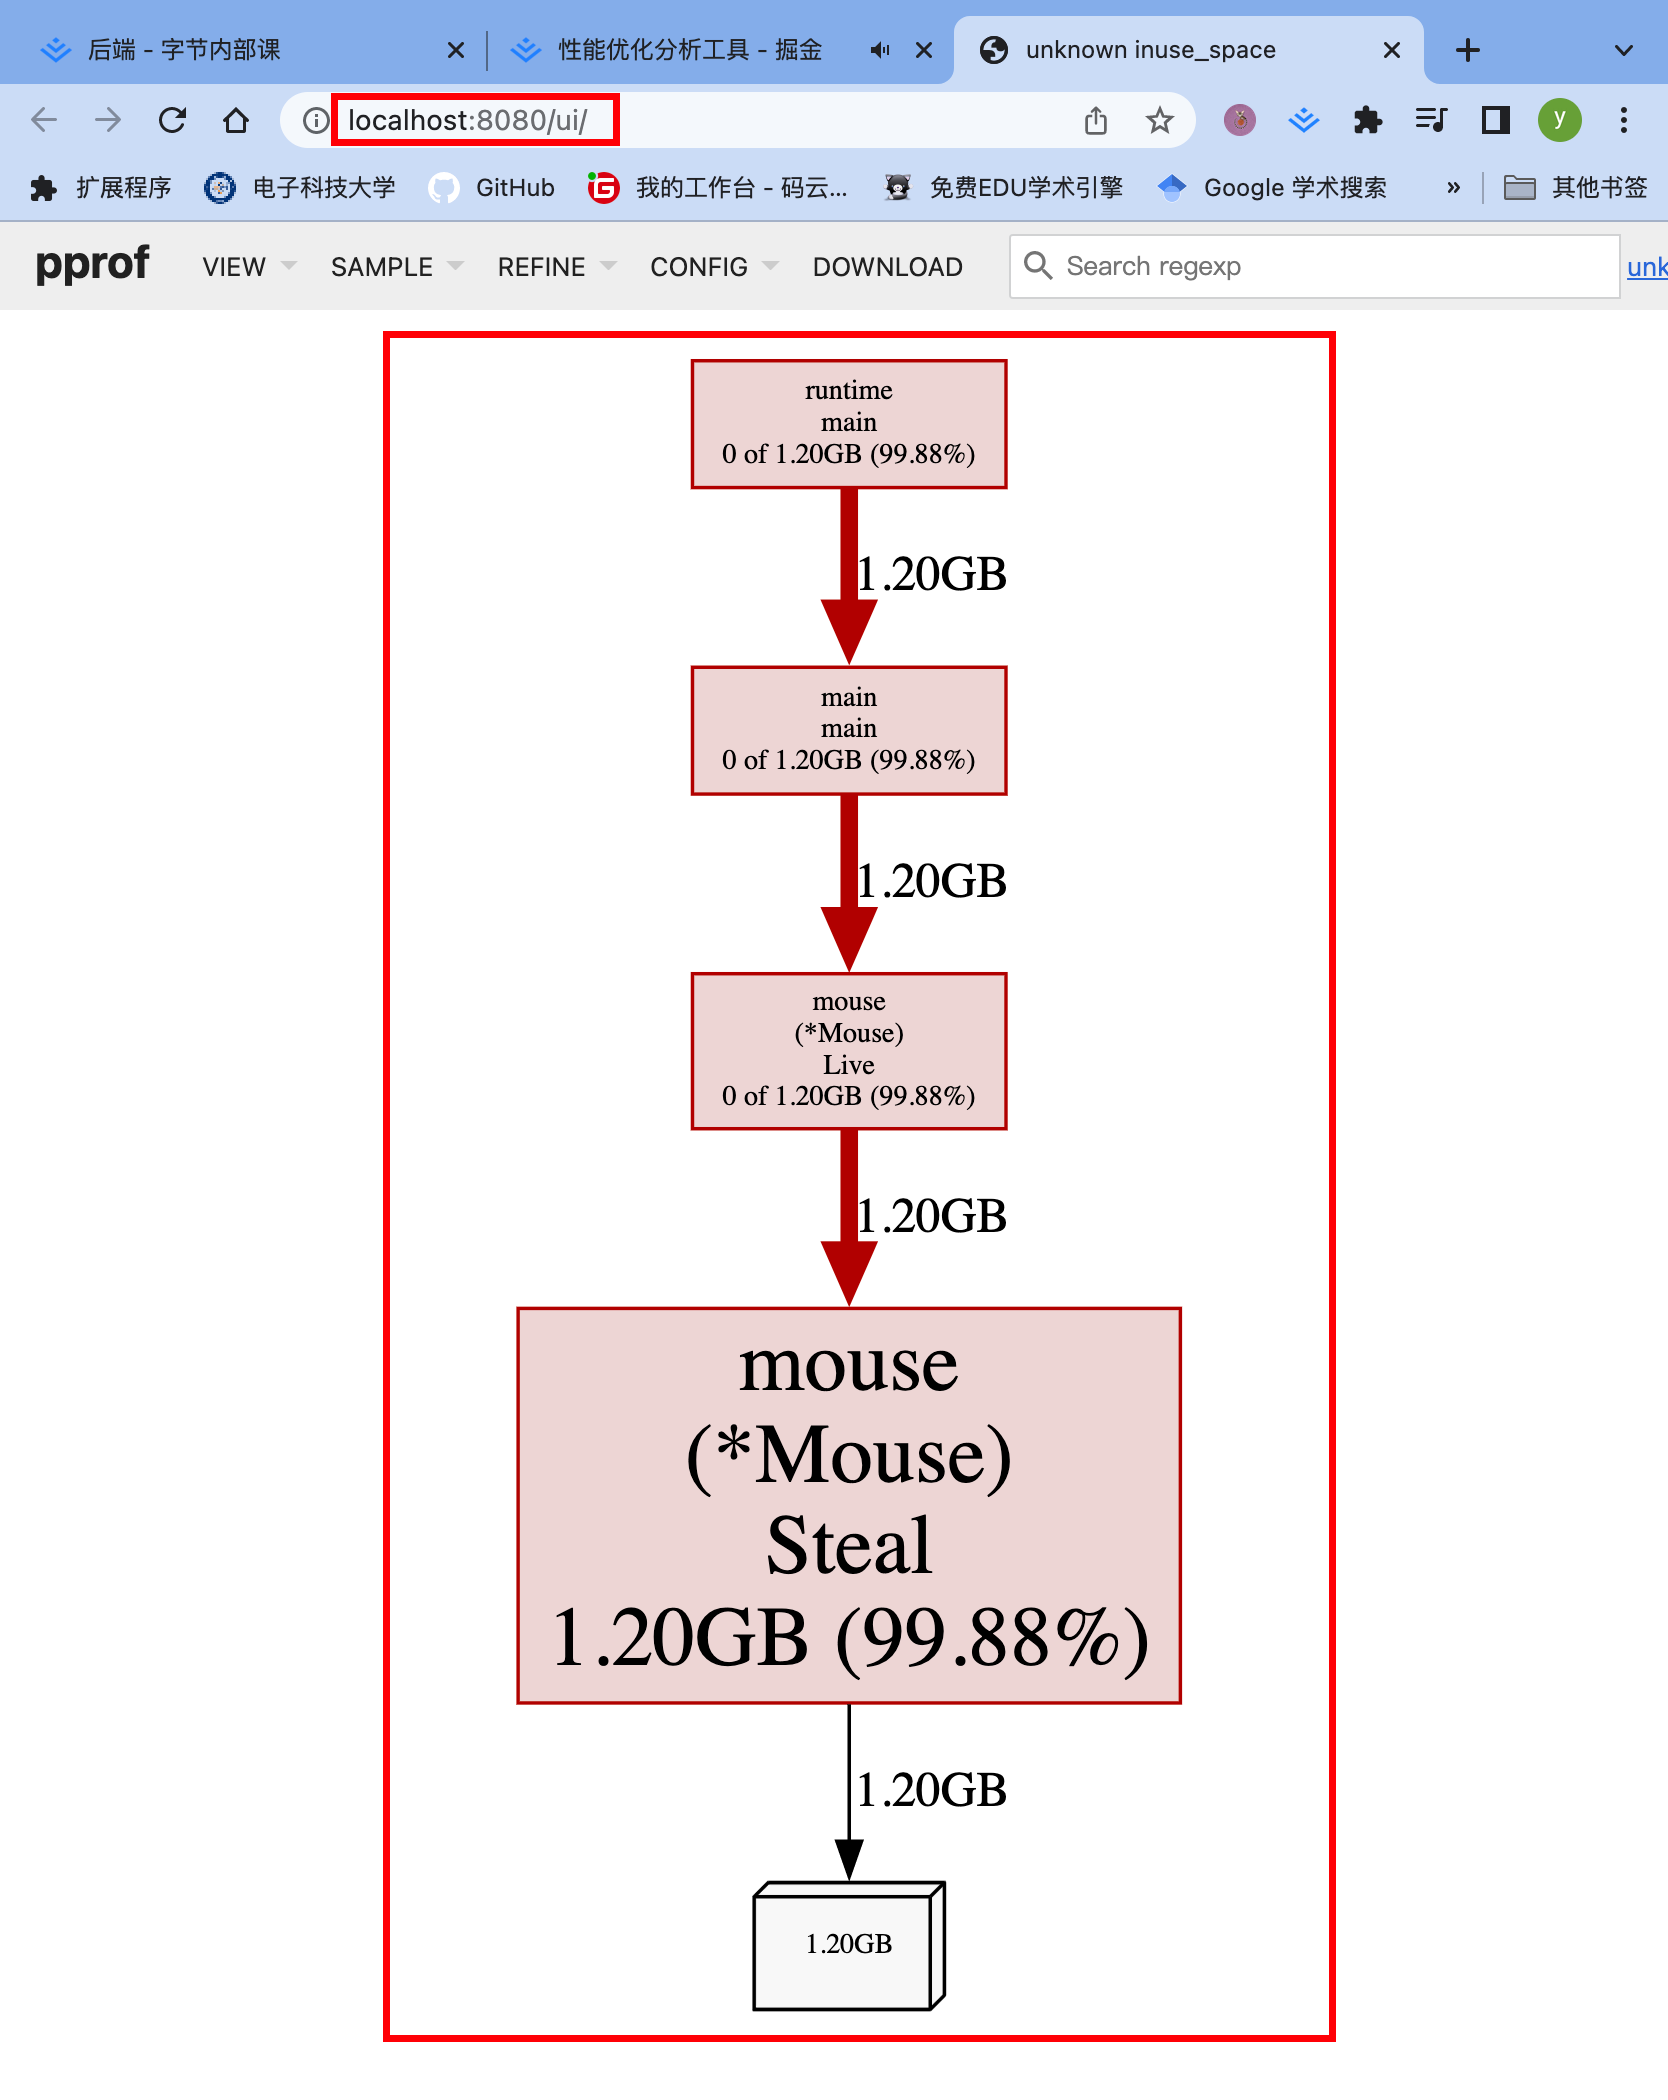
页面讲解
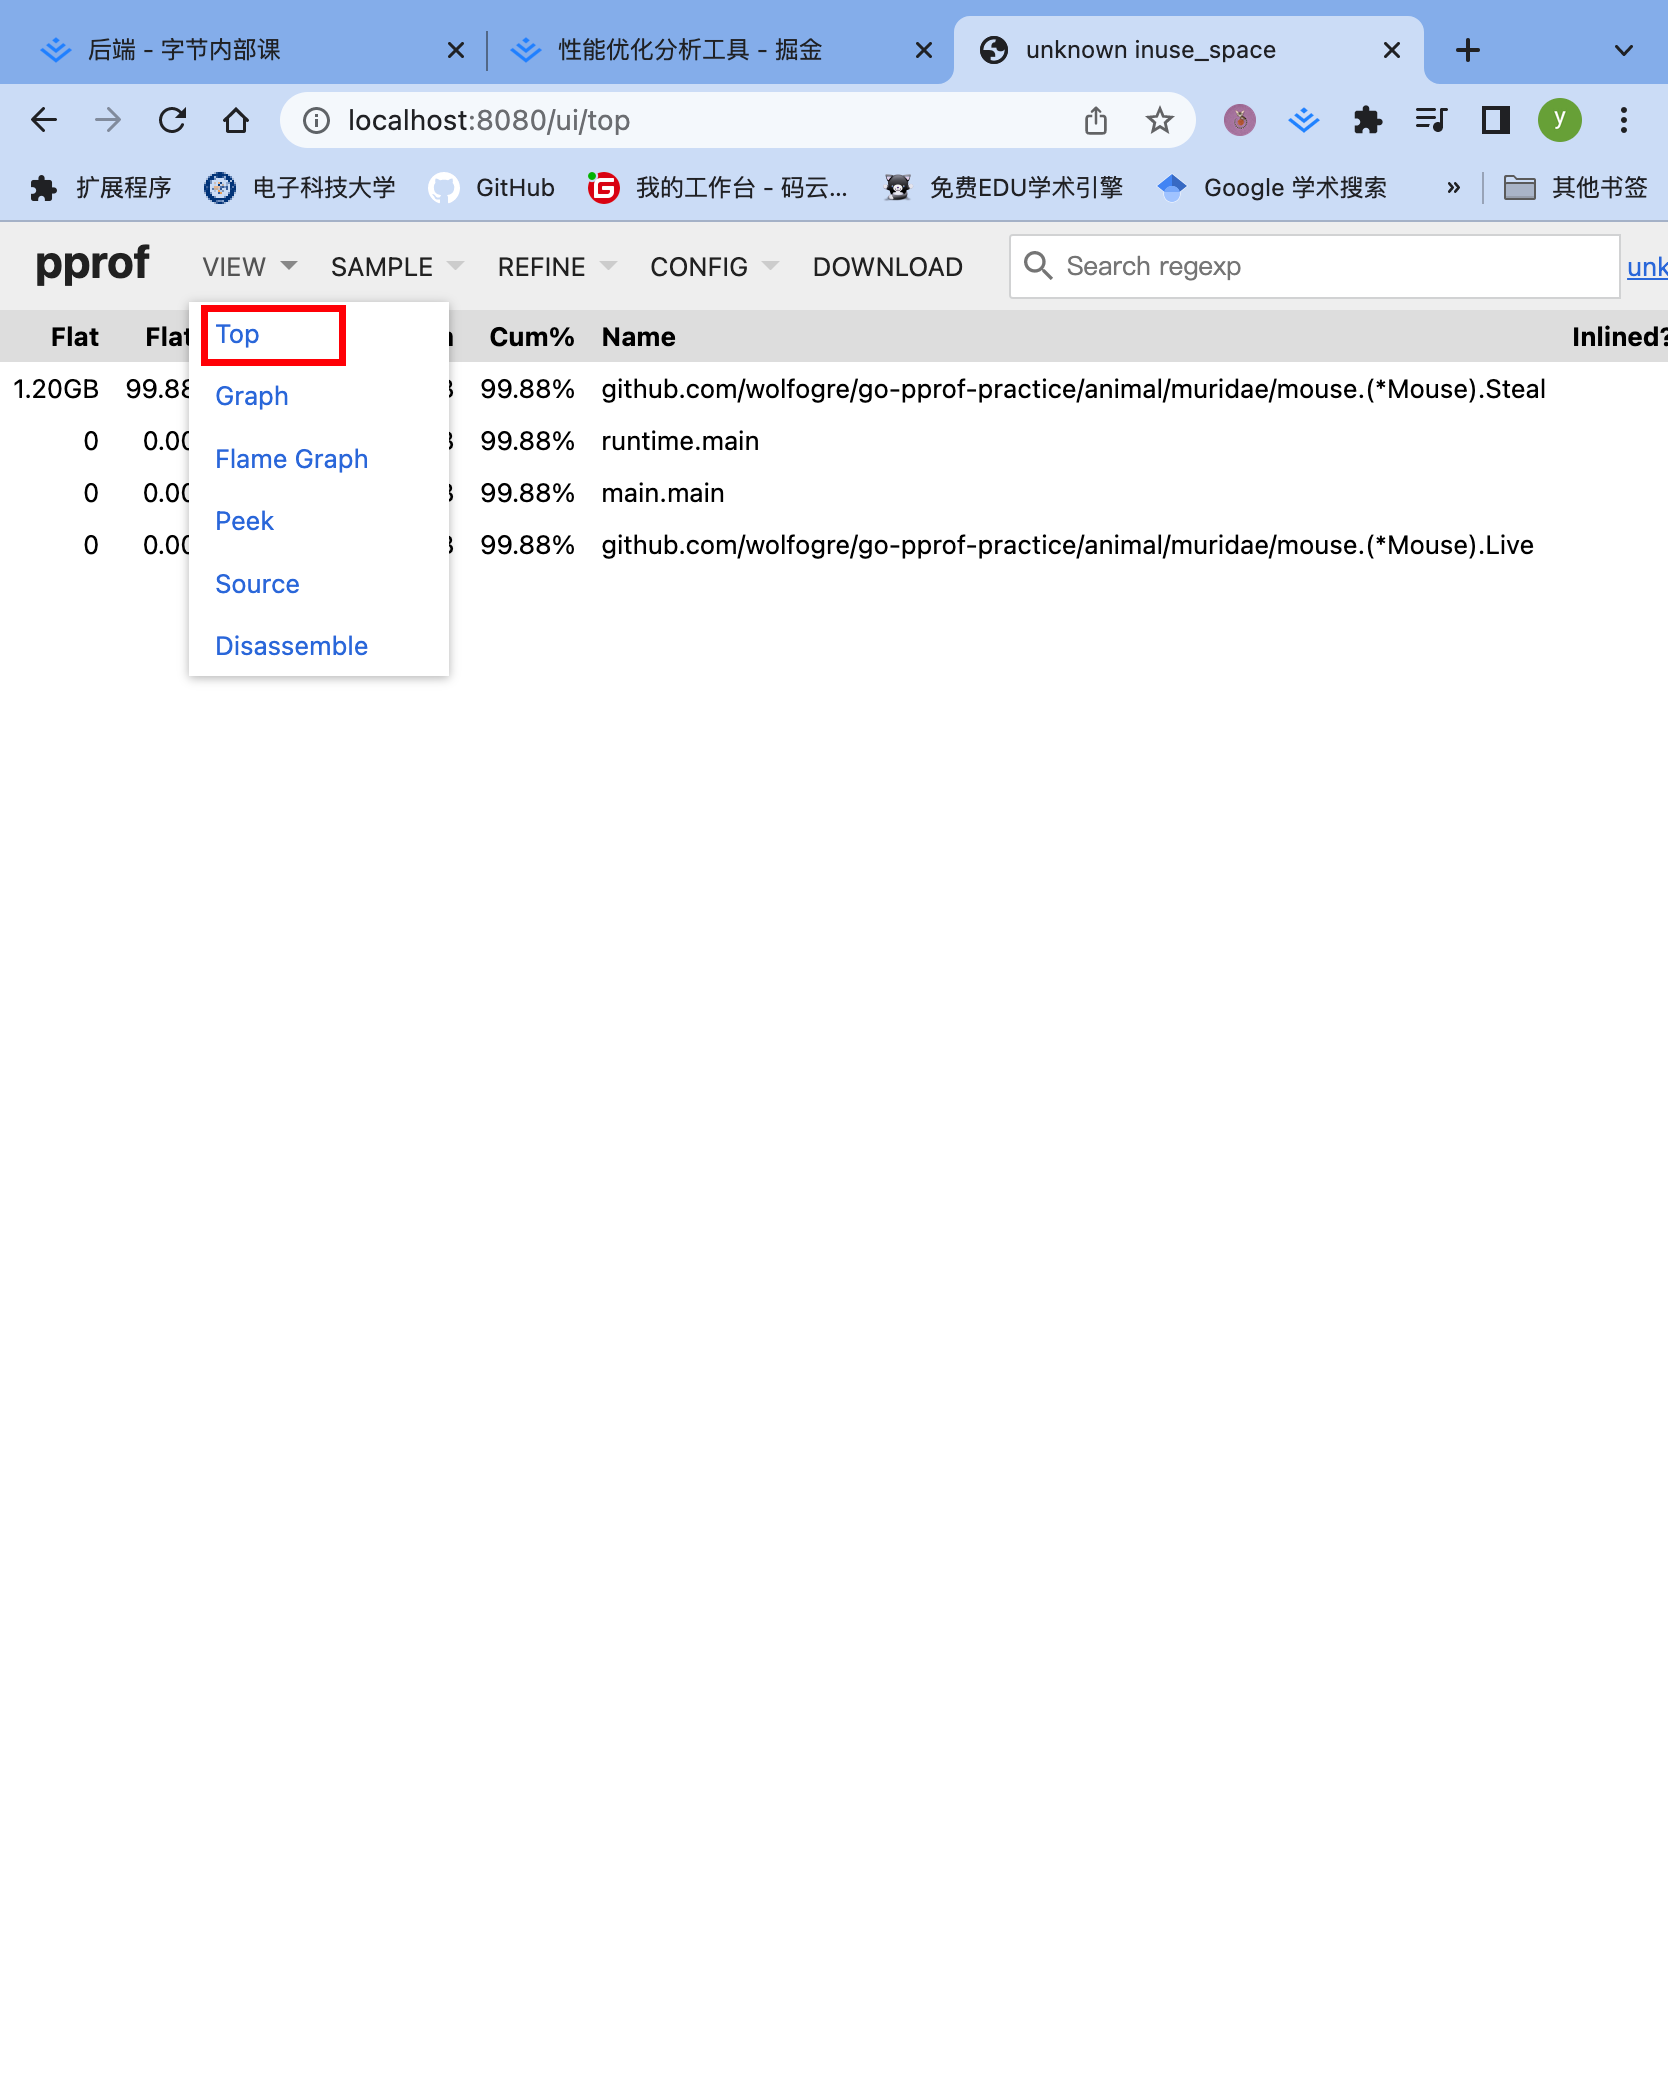
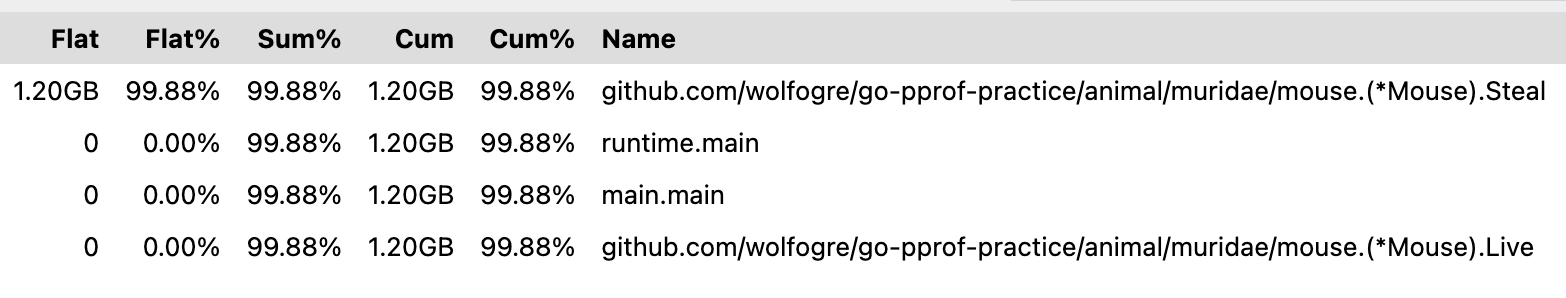
top的结果就类似于上面CPU的结果,一样样的昂!!!
还有好多什么,调用图,🔥图啊之类的。哪个舒服看哪个,能找到问题就行昂!!!
- 所以上面类似的昂!!!(也可以改为http提供服务!!!)
alex ~/my_code/go/Bytedance/go-pprof-practice [master] $ go tool pprof -http=:8080 "http://localhost:6060/debug/pprof/profile?seconds=10"
Fetching profile over HTTP from http://localhost:6060/debug/pprof/profile?seconds=10
Saved profile in /Users/alex/pprof/pprof.samples.cpu.004.pb.gz
Serving web UI on http://localhost:8080
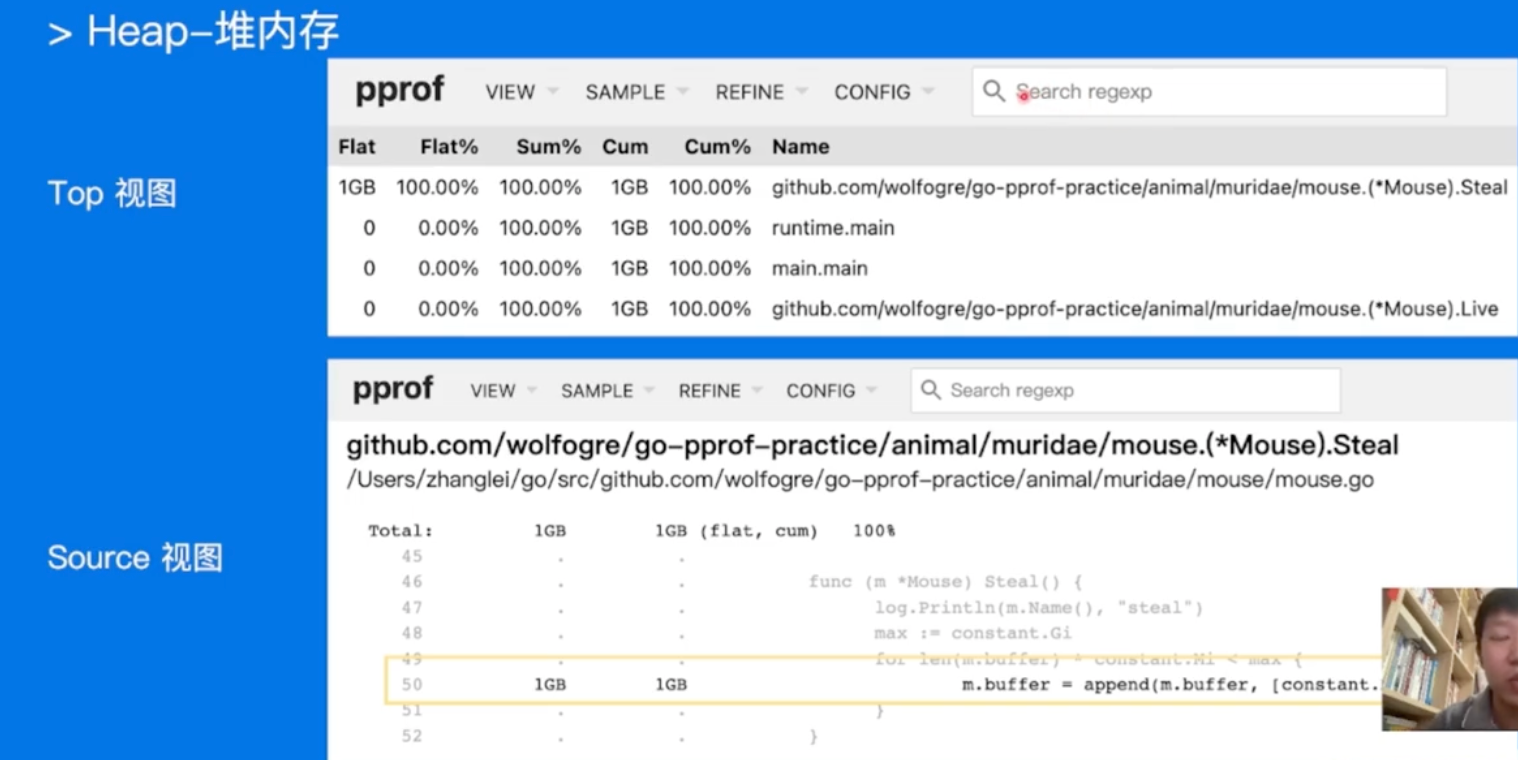
fix the bug
把对应的内存分配的loop注释掉就ok了昂!!!
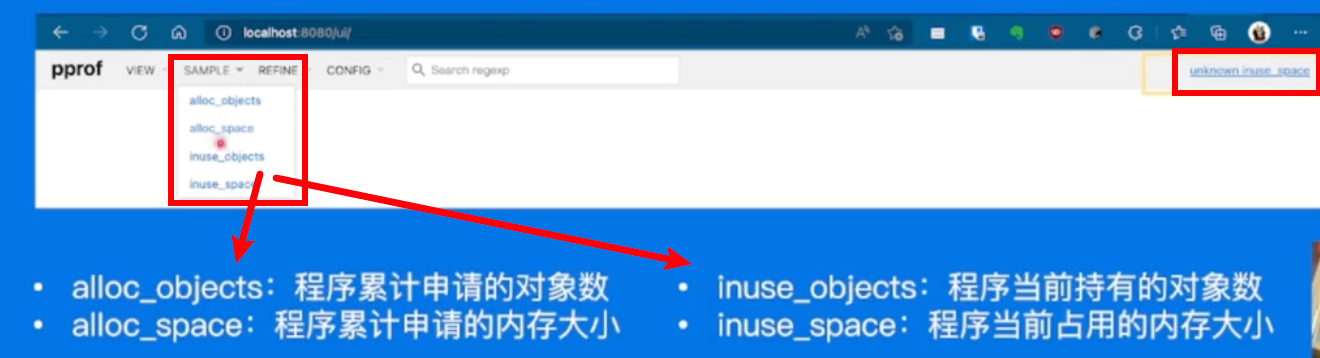
其他的内存问题
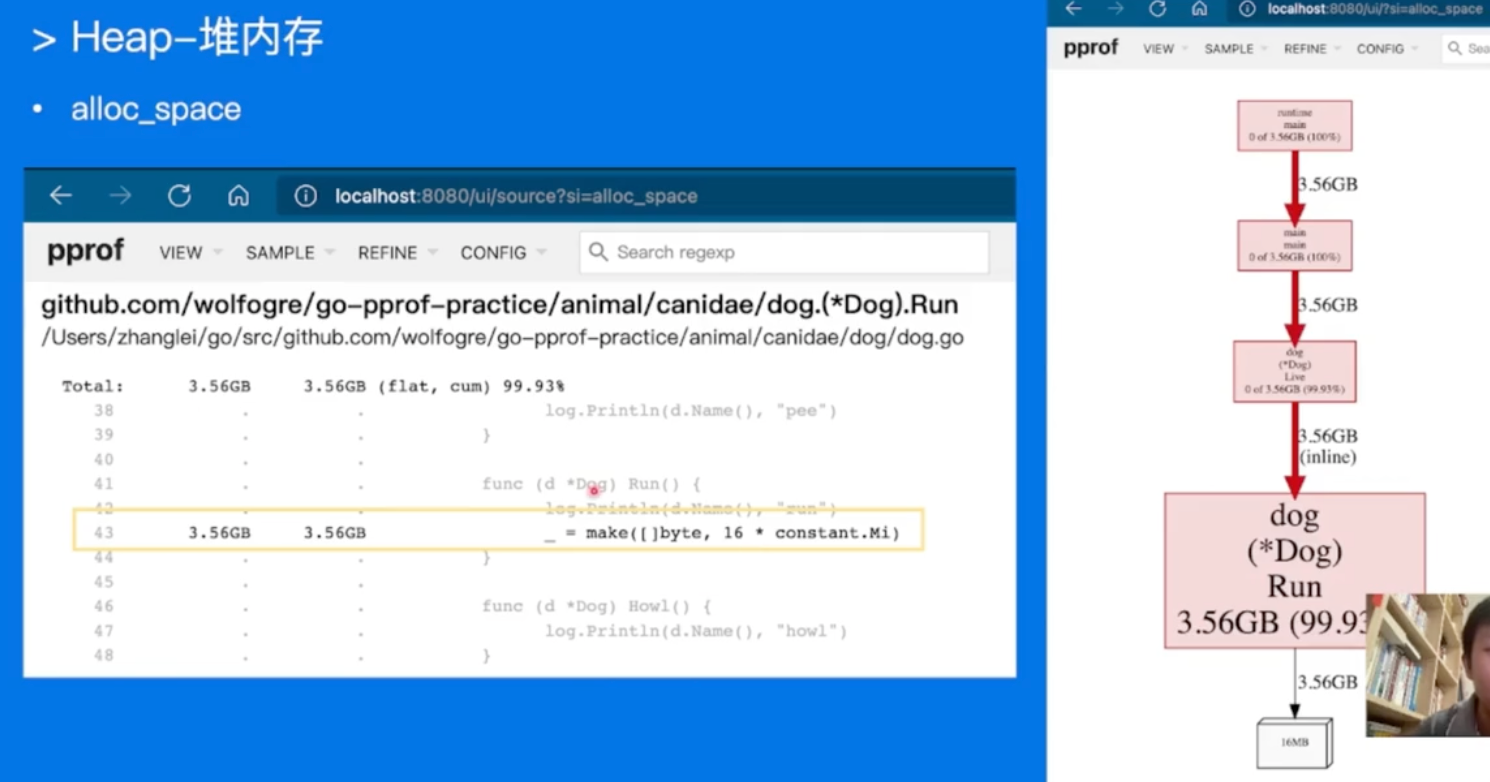
切换到alloc_space,累计申请大小查看,发现大问题!!!
这个更恶心,申请了内存,不用,直接gc了,但是一直在申请。。。
一样的,找到问题的代码,解决掉就行!!!
内存排查实战-协程
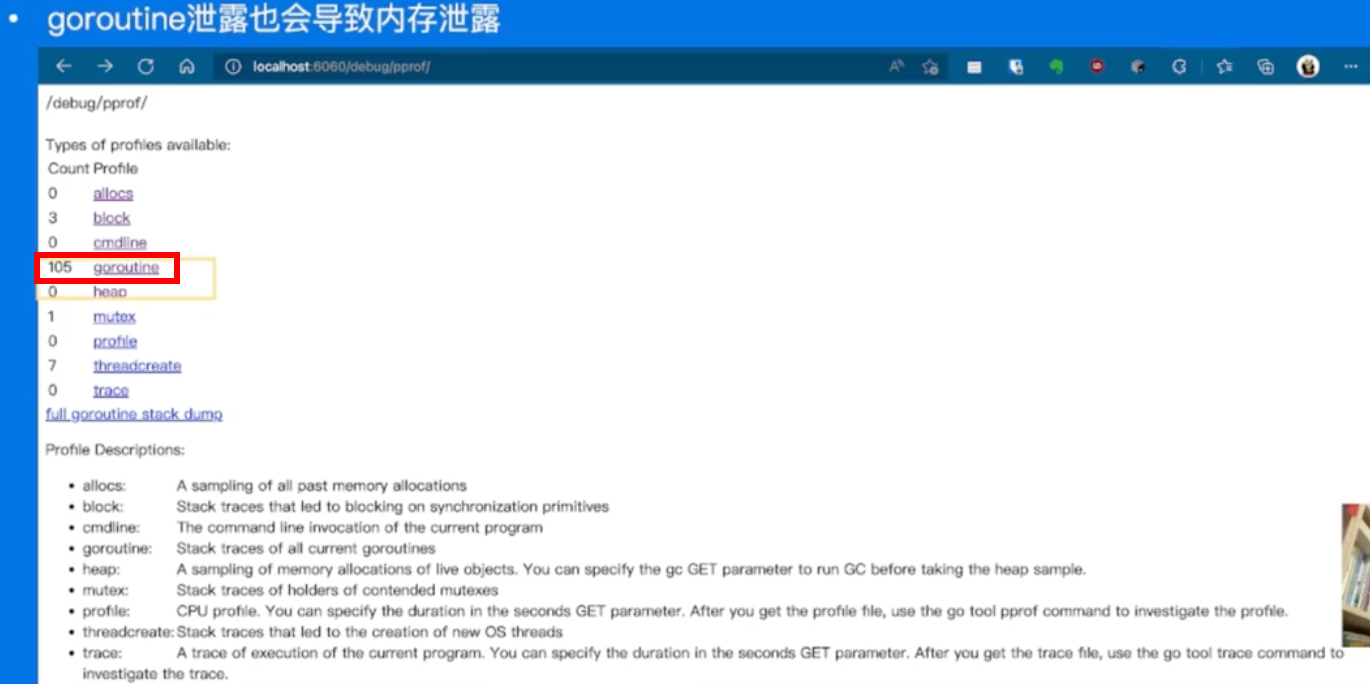
105个goroutine有点太多了。
命令行工具直接采样
alex ~/my_code/go/Bytedance/go-pprof-practice [master] $ go tool pprof -http=:8080 "http://localhost:6060/debug/pprof/goroutine"
Fetching profile over HTTP from http://localhost:6060/debug/pprof/goroutine
Saved profile in /Users/alex/pprof/pprof.goroutine.001.pb.gz
Serving web UI on http://localhost:8080
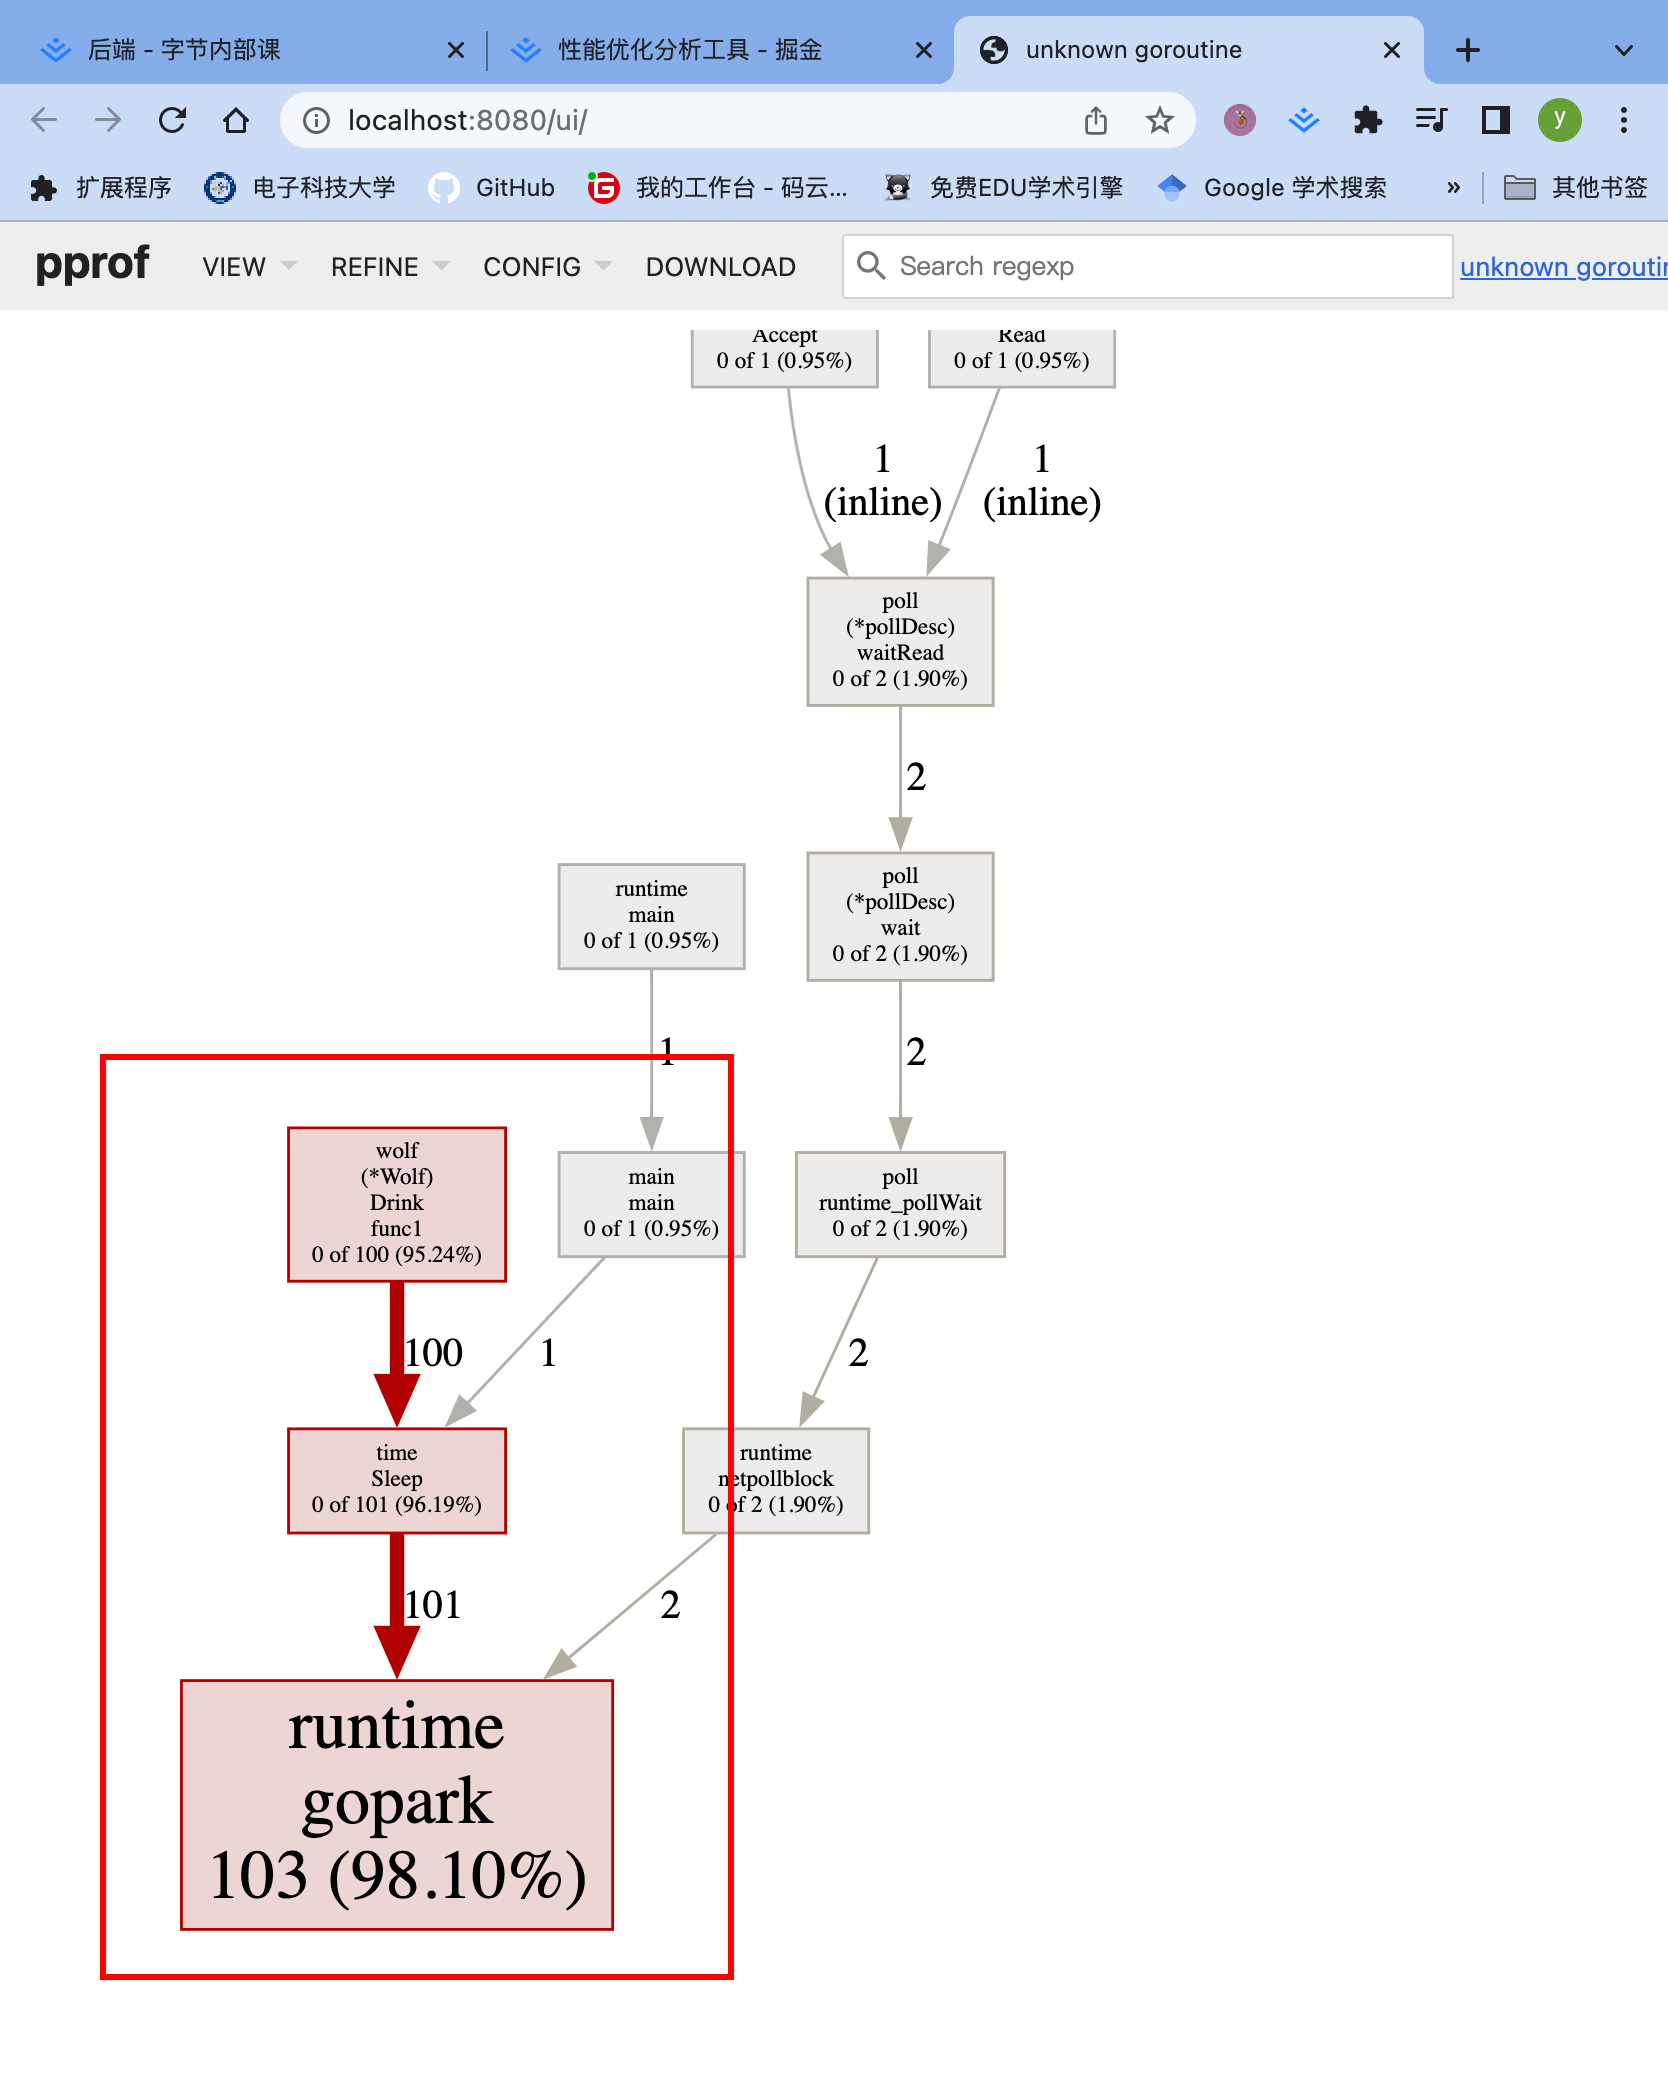
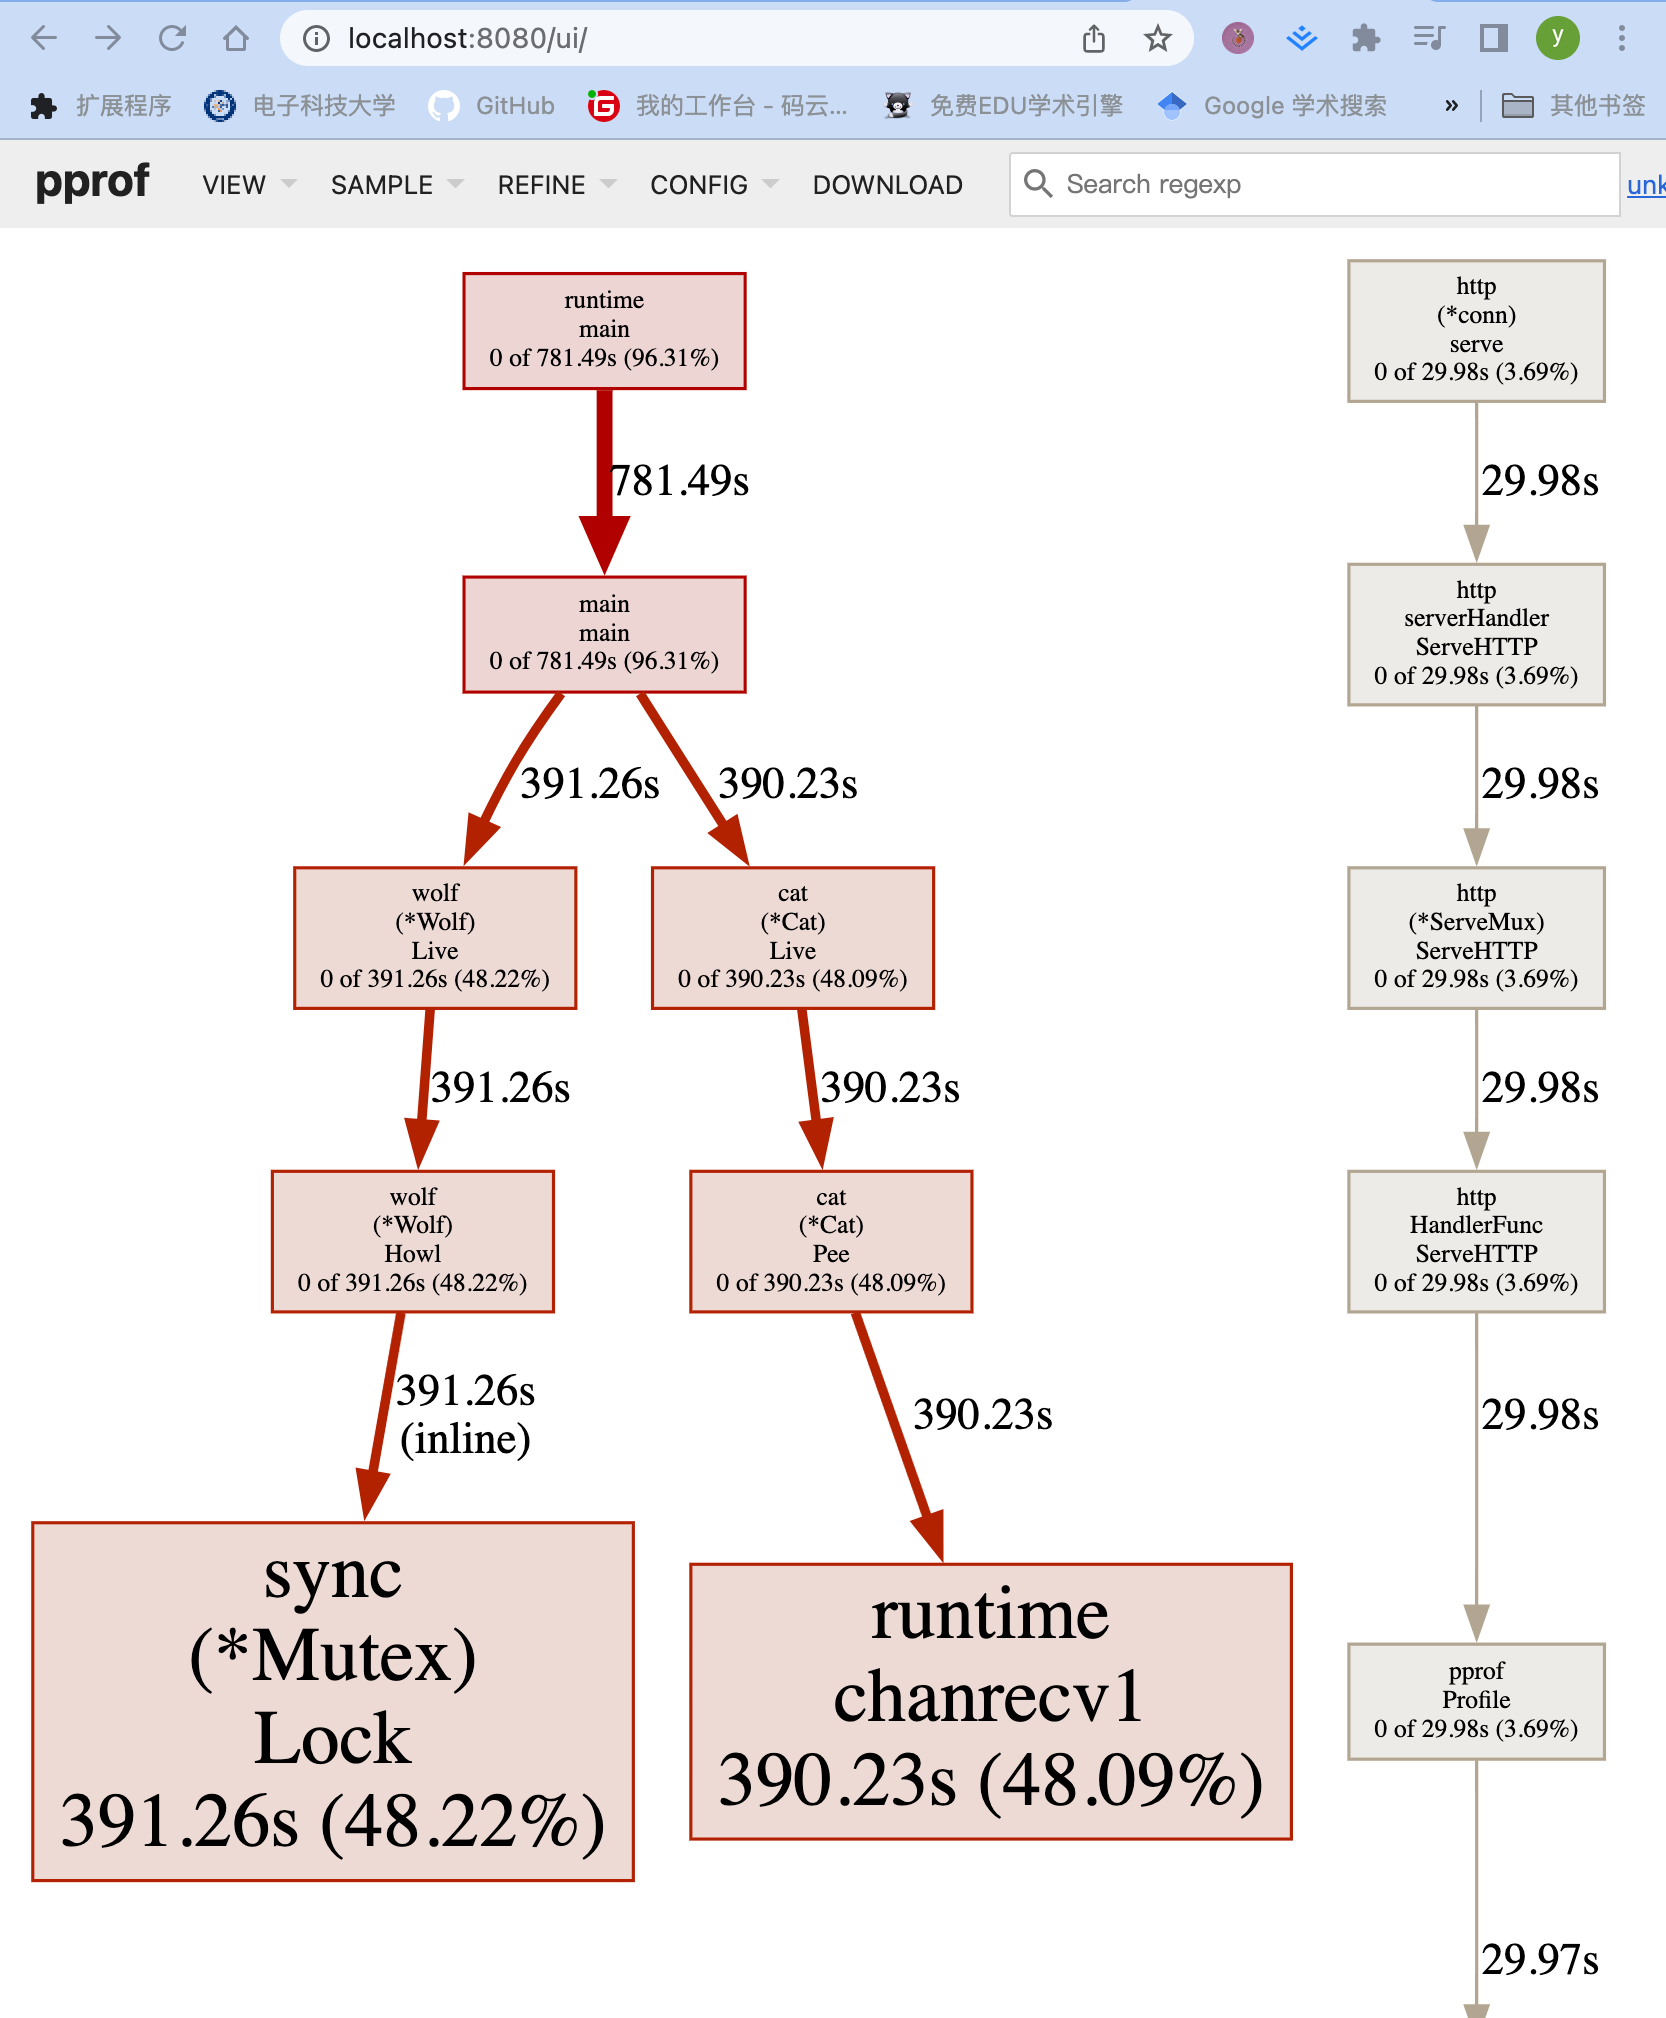
从上往下是调用顺序
每一块是一个函数,越长代表占用CPU的时间更长
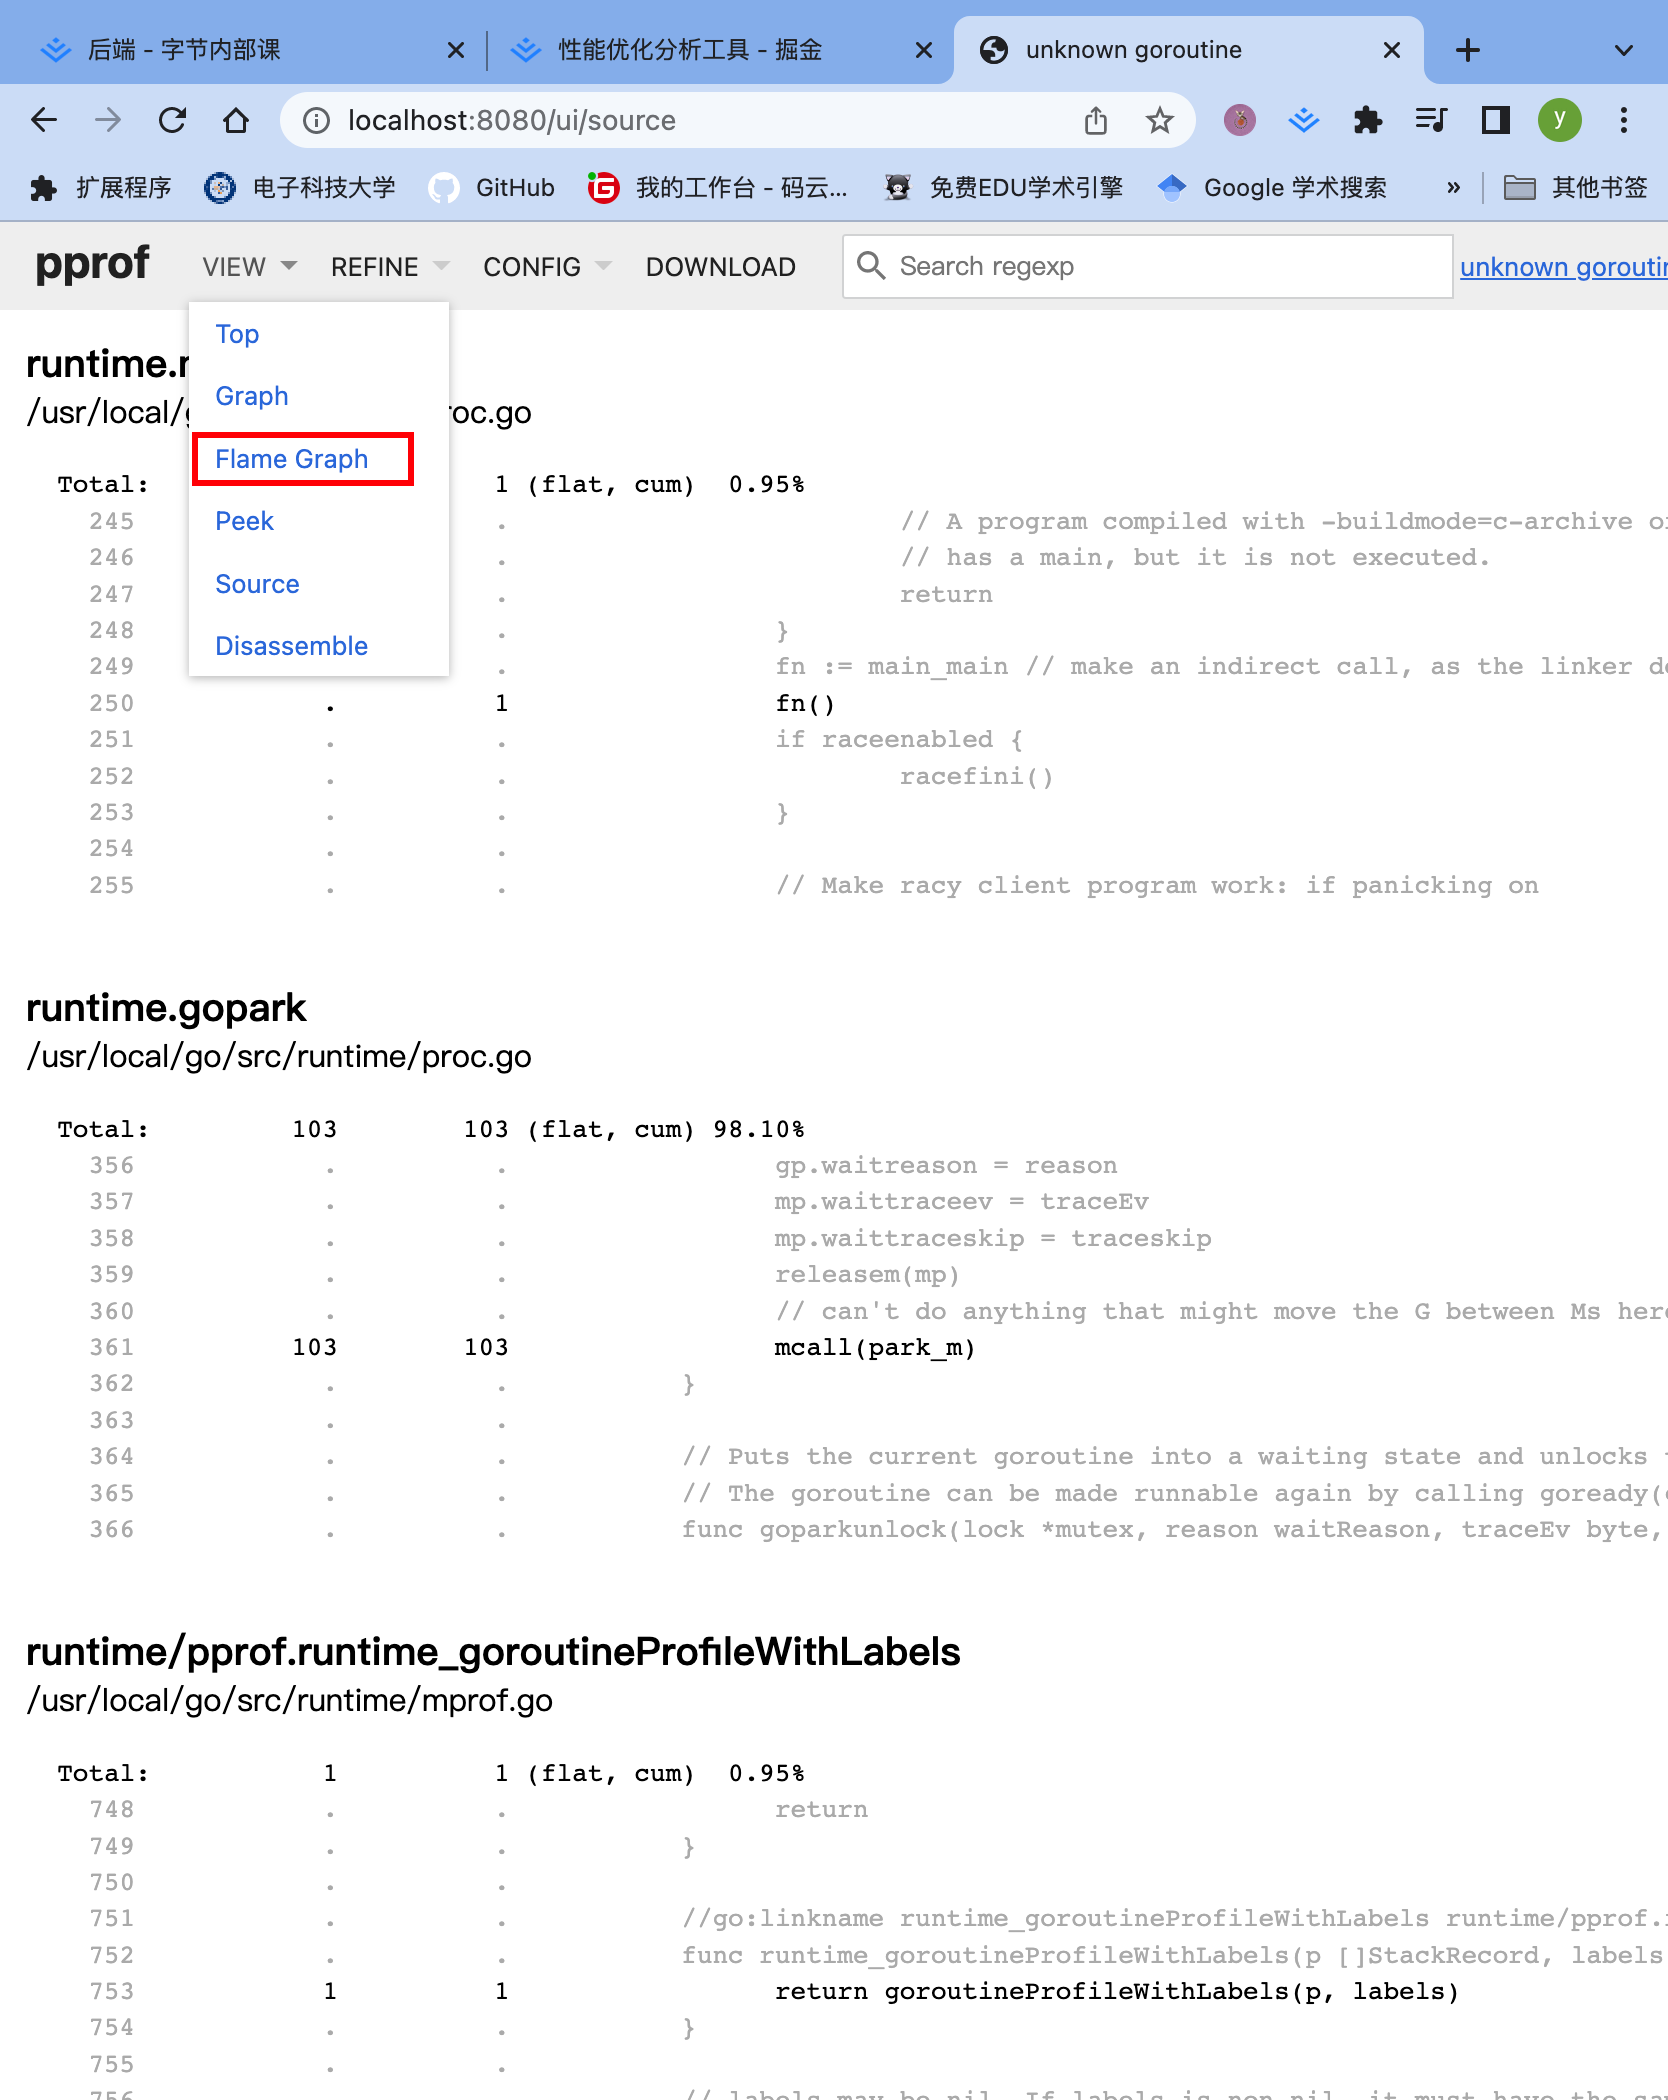
火焰图
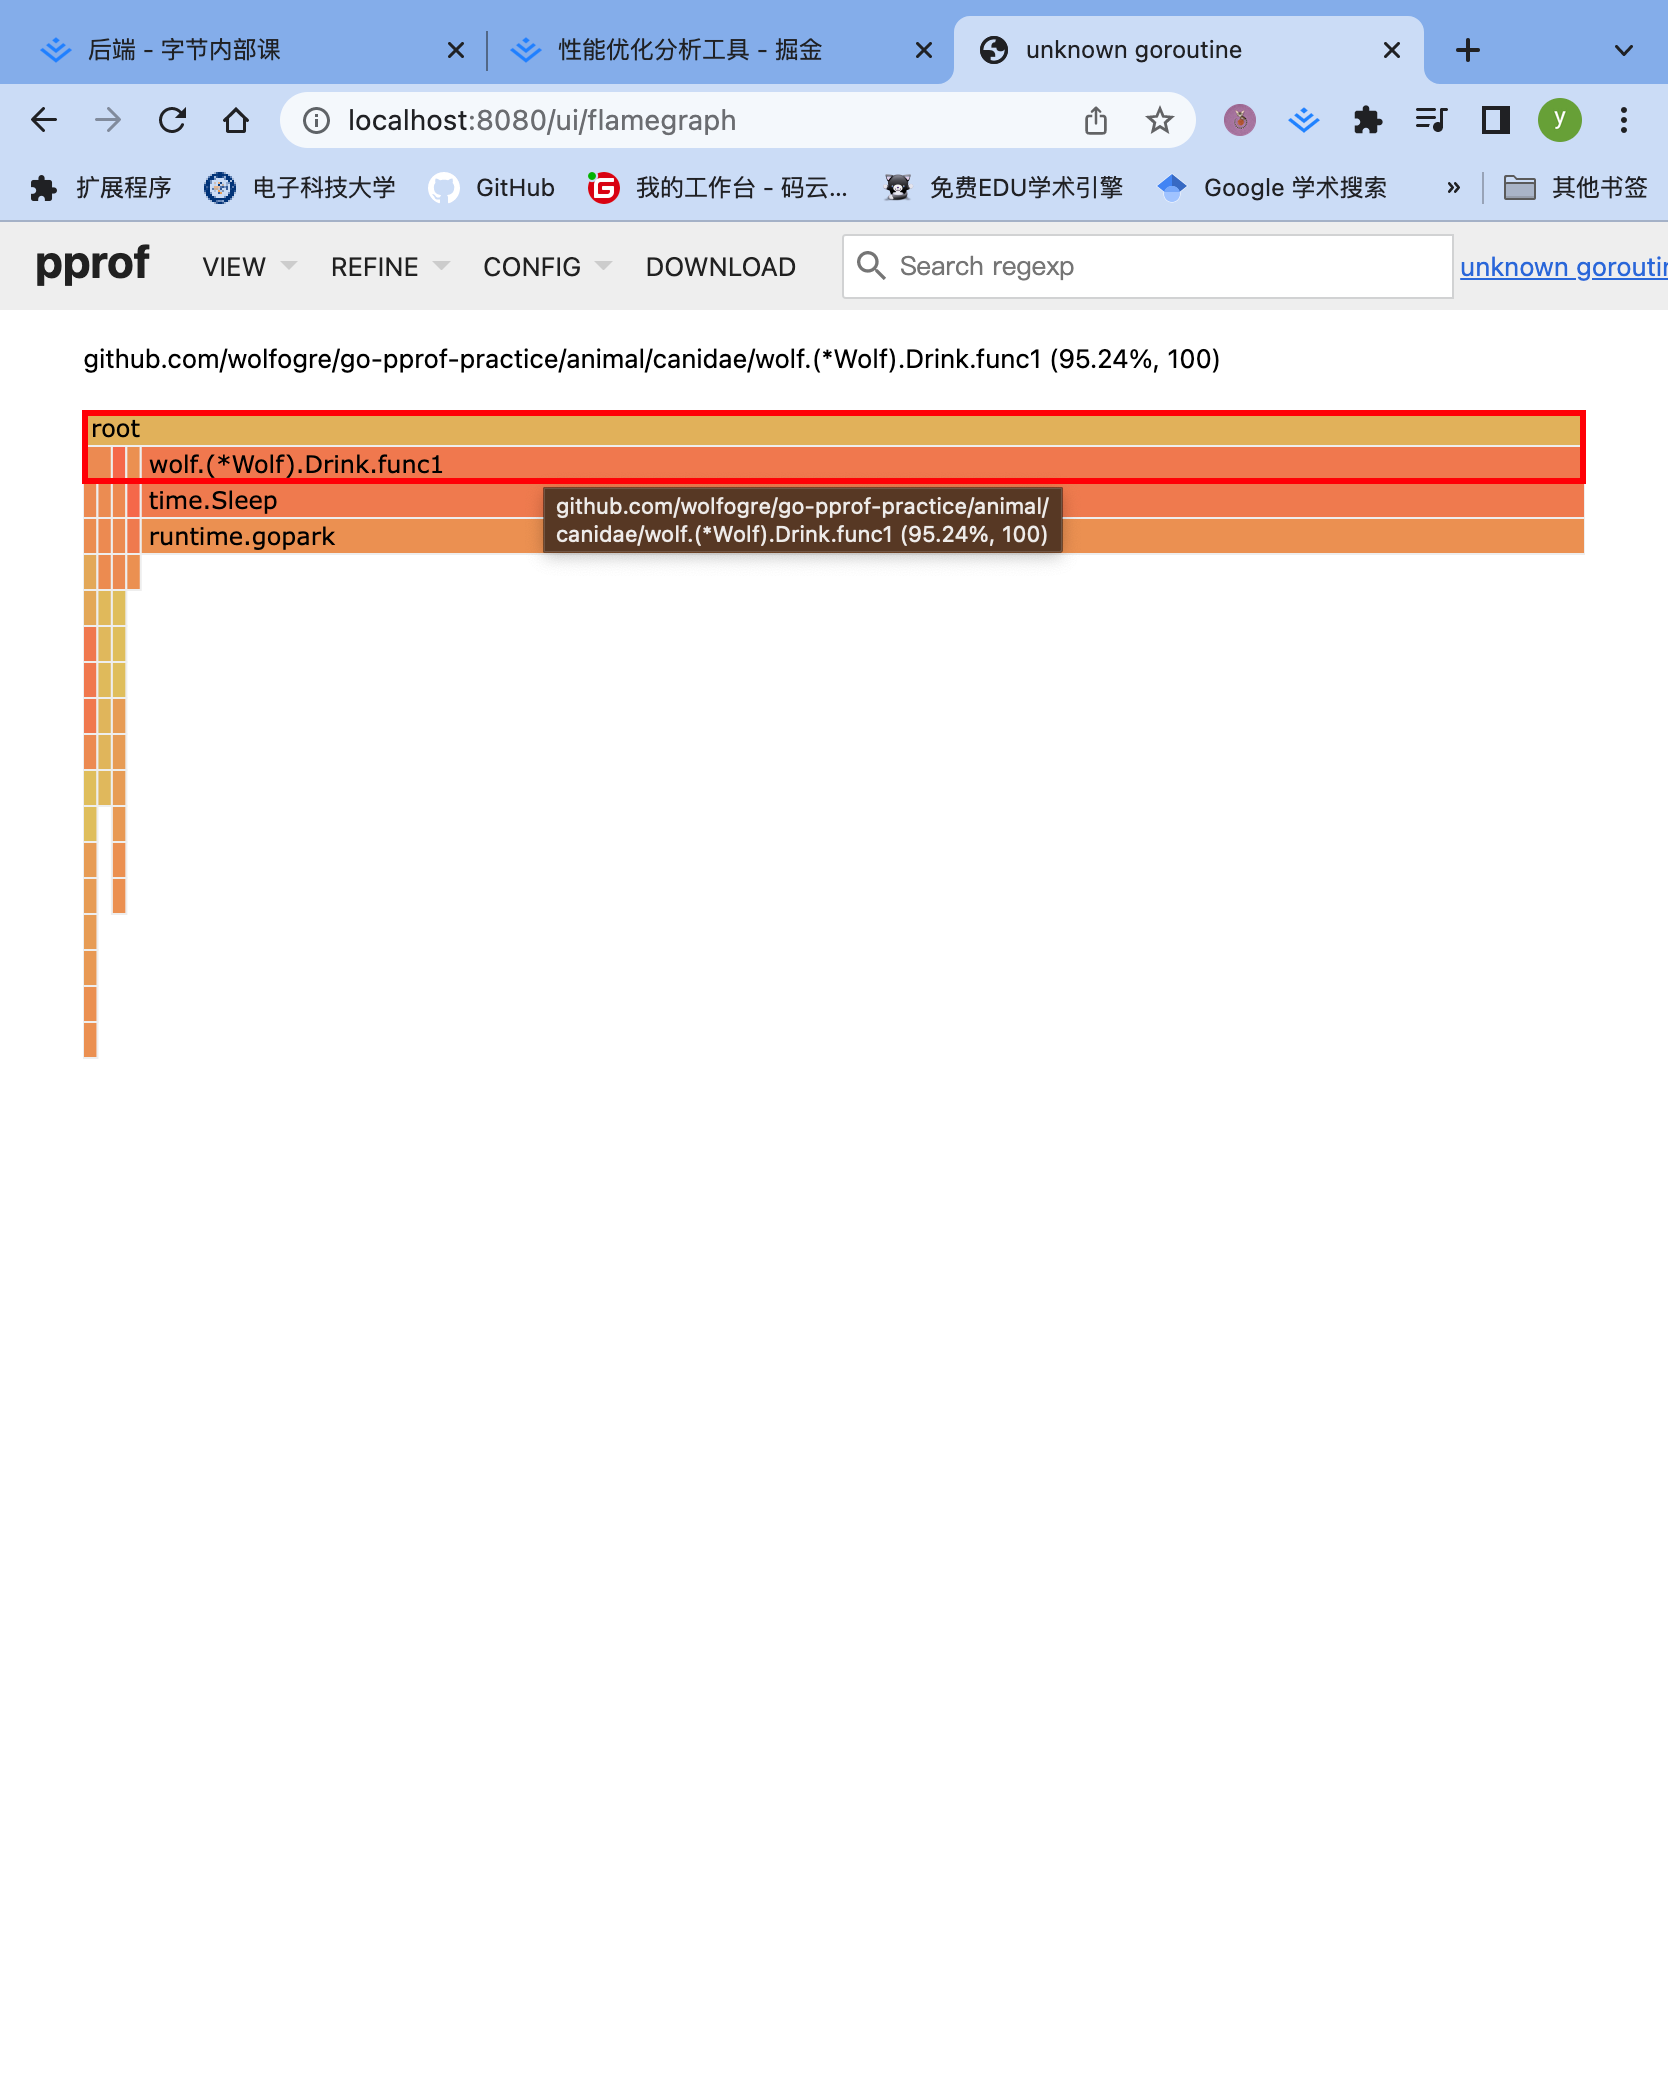
火焰图是动态的,支持点击块进行分析,简单交互,方便处理某个函数的行为昂!!!
- 上面这里就可以看到wolf明显有问题昂!!!
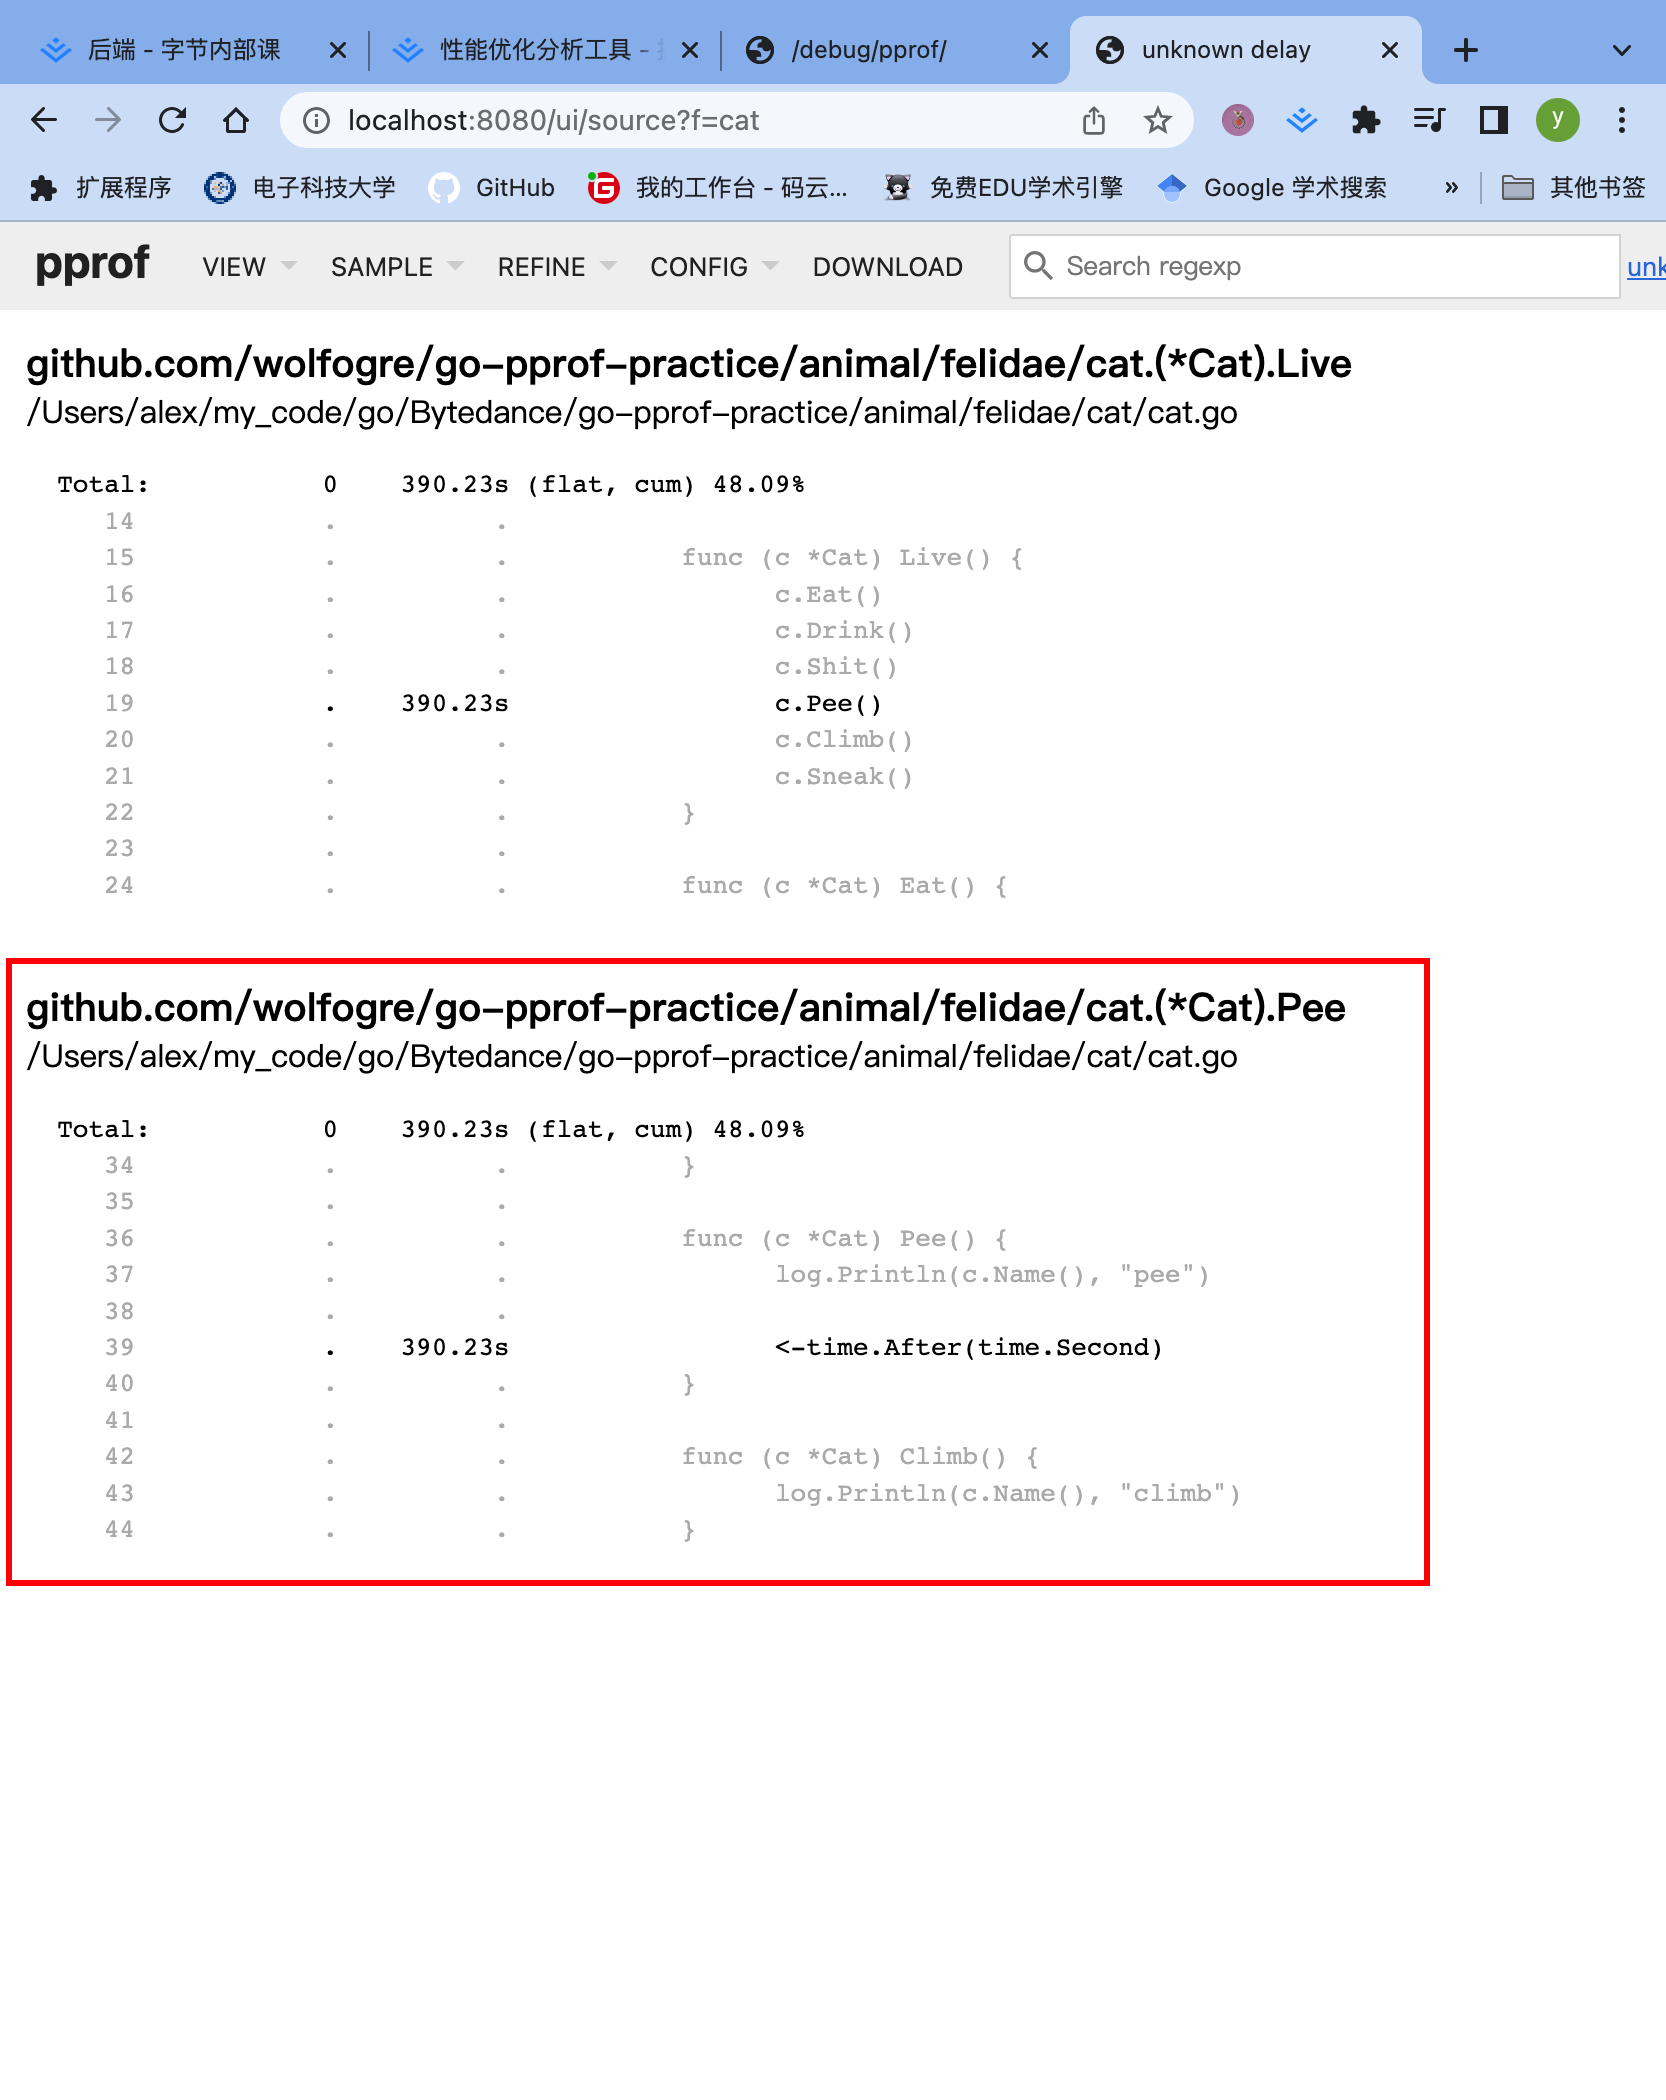
source视图最终定位
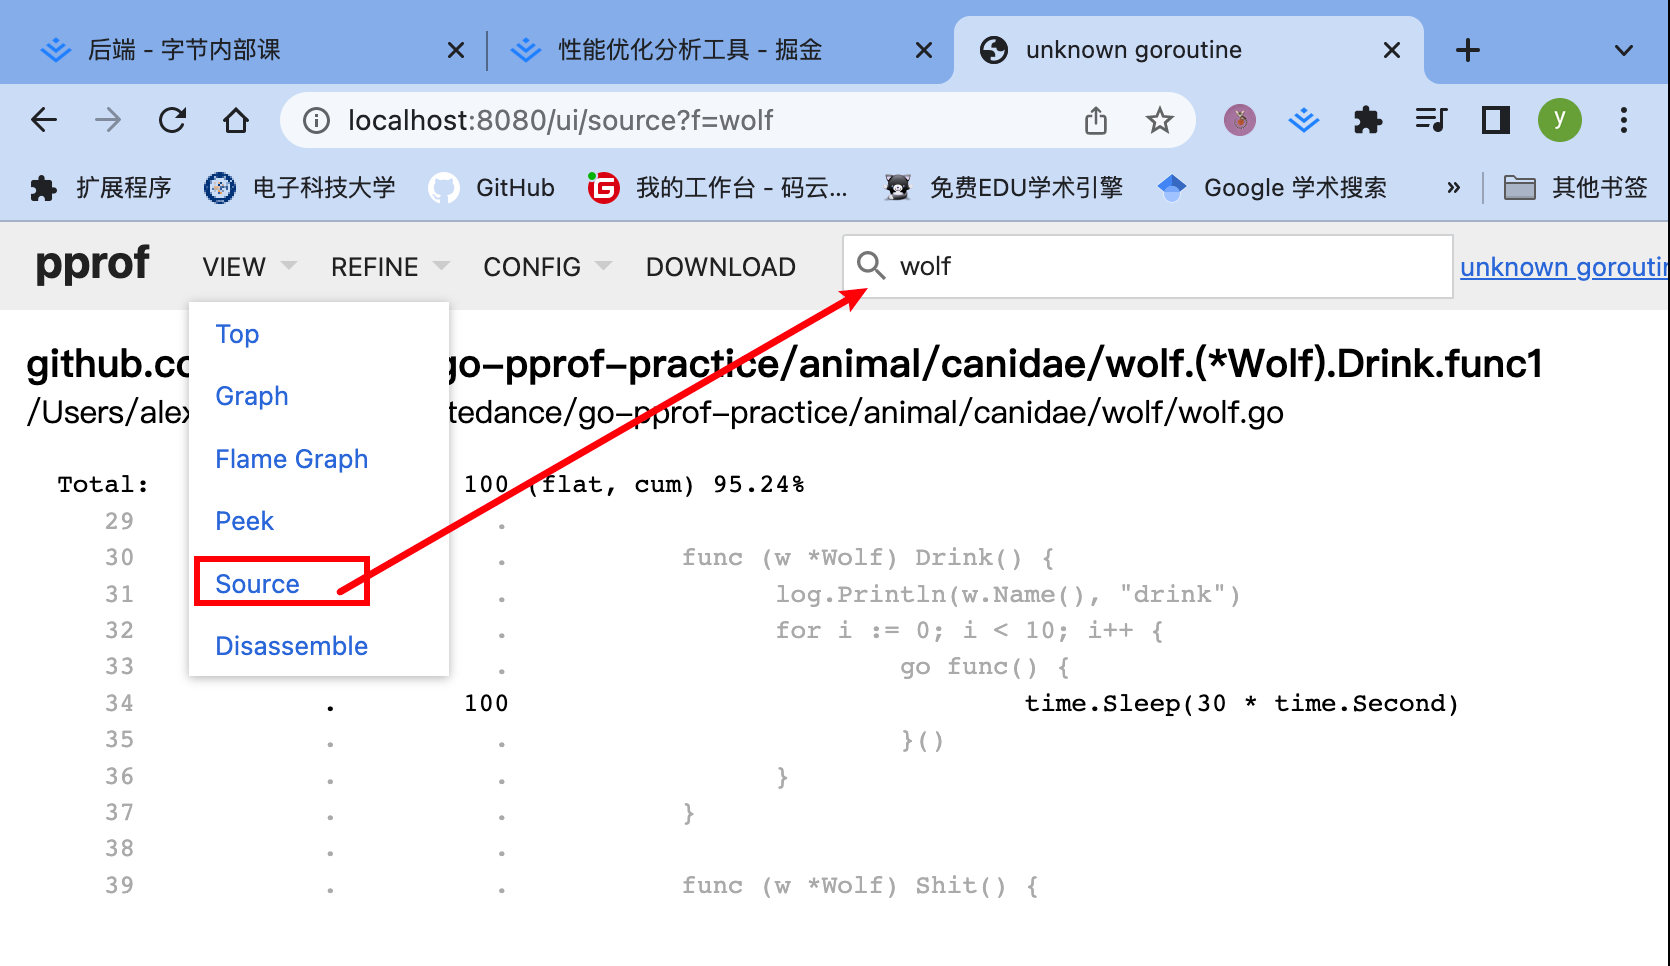
转到source页面,搜索wolf,看看问题原因昂!!!
看到,每一个协程sleep太久了,没有被销毁,导致反复创建新的协程,寄!!!注释掉就好了昂!!!
排查实战-锁
命令行工具直接采样
alex ~/my_code/go/Bytedance/go-pprof-practice [master] $ go tool pprof -http=:8080 "http://localhost:6060/debug/pprof/mutex"
Fetching profile over HTTP from http://localhost:6060/debug/pprof/mutex
Saved profile in /Users/alex/pprof/pprof.contentions.delay.001.pb.gz
Serving web UI on http://localhost:8080
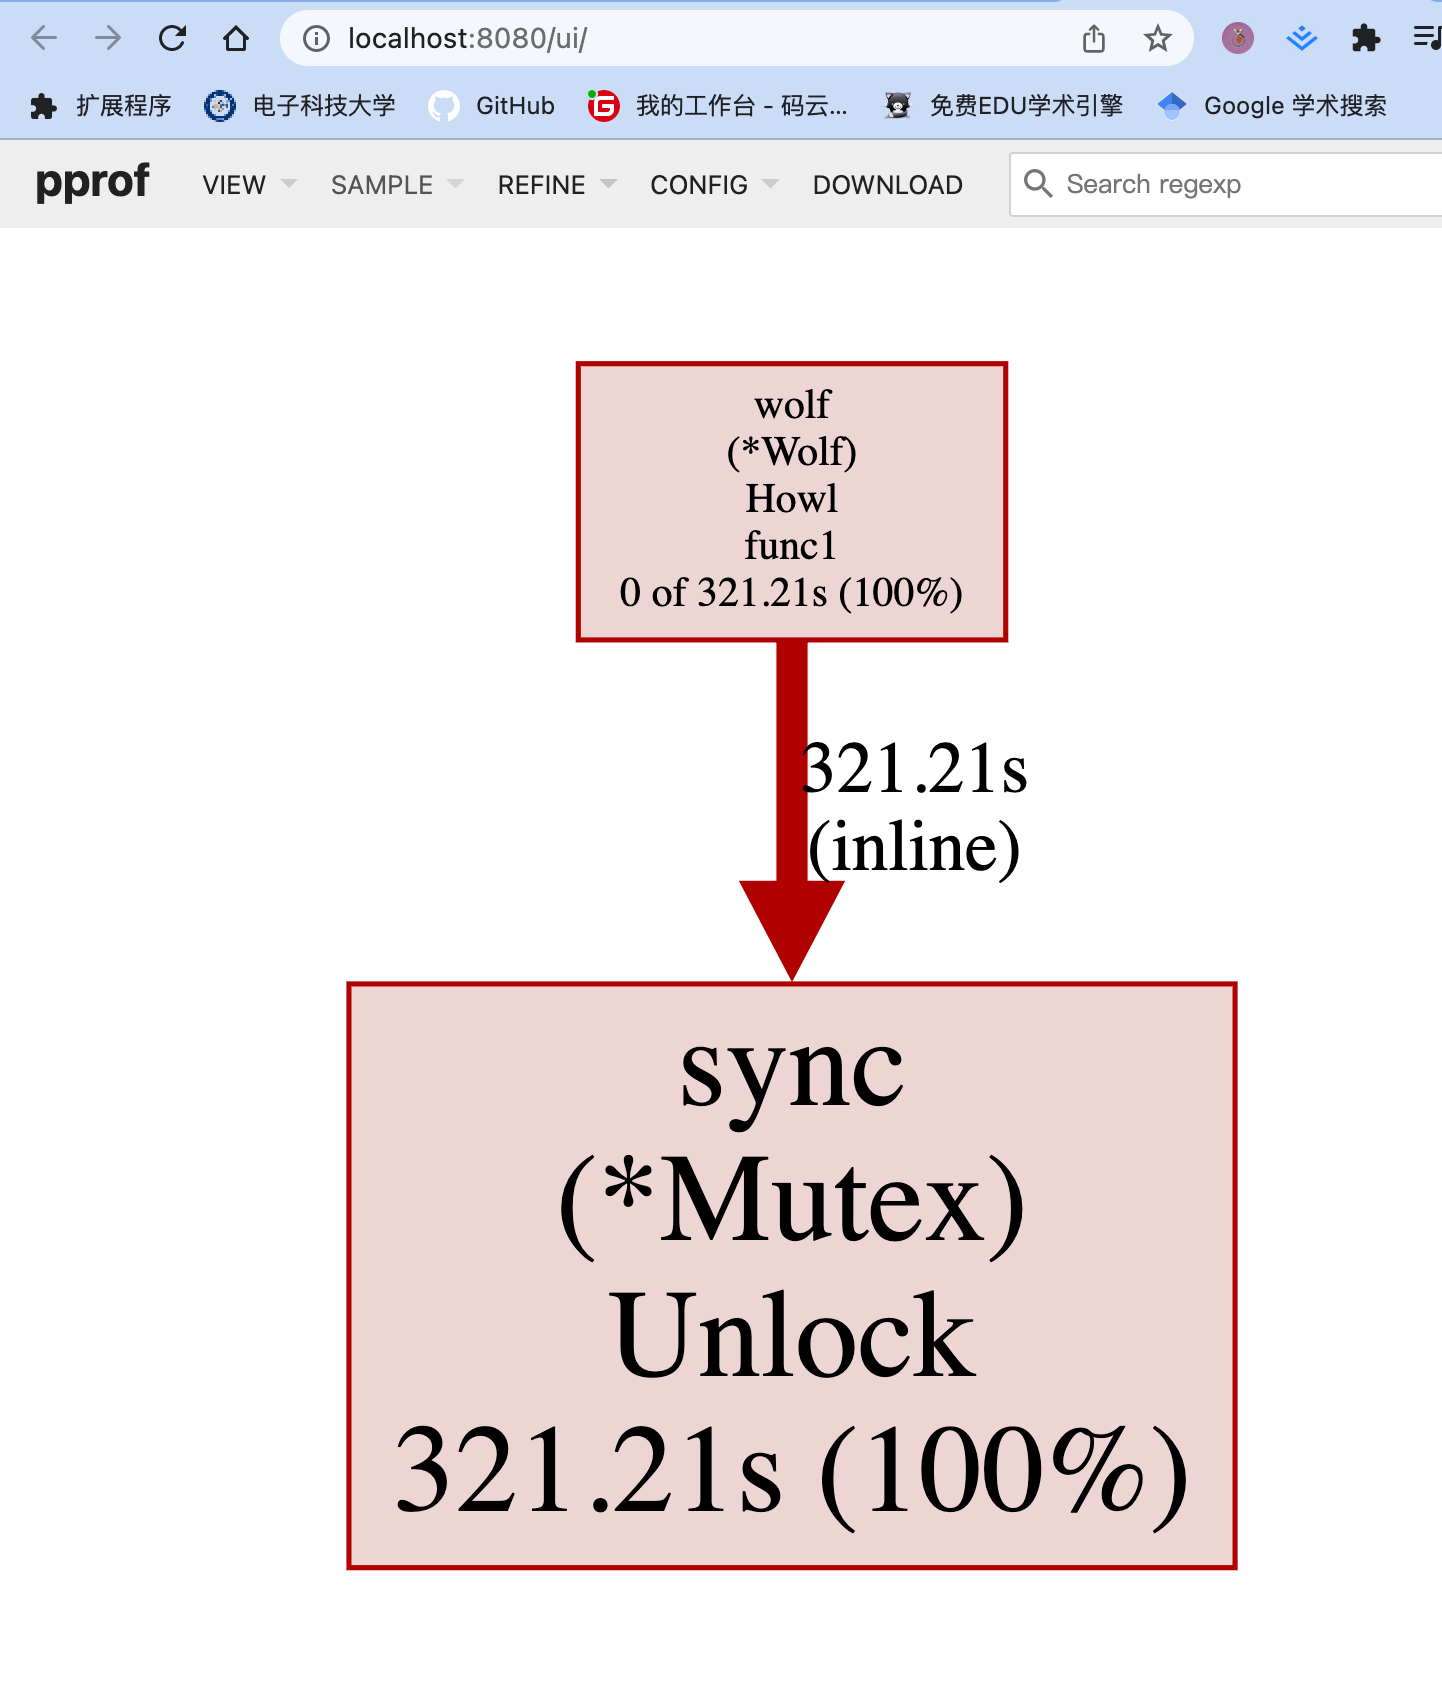
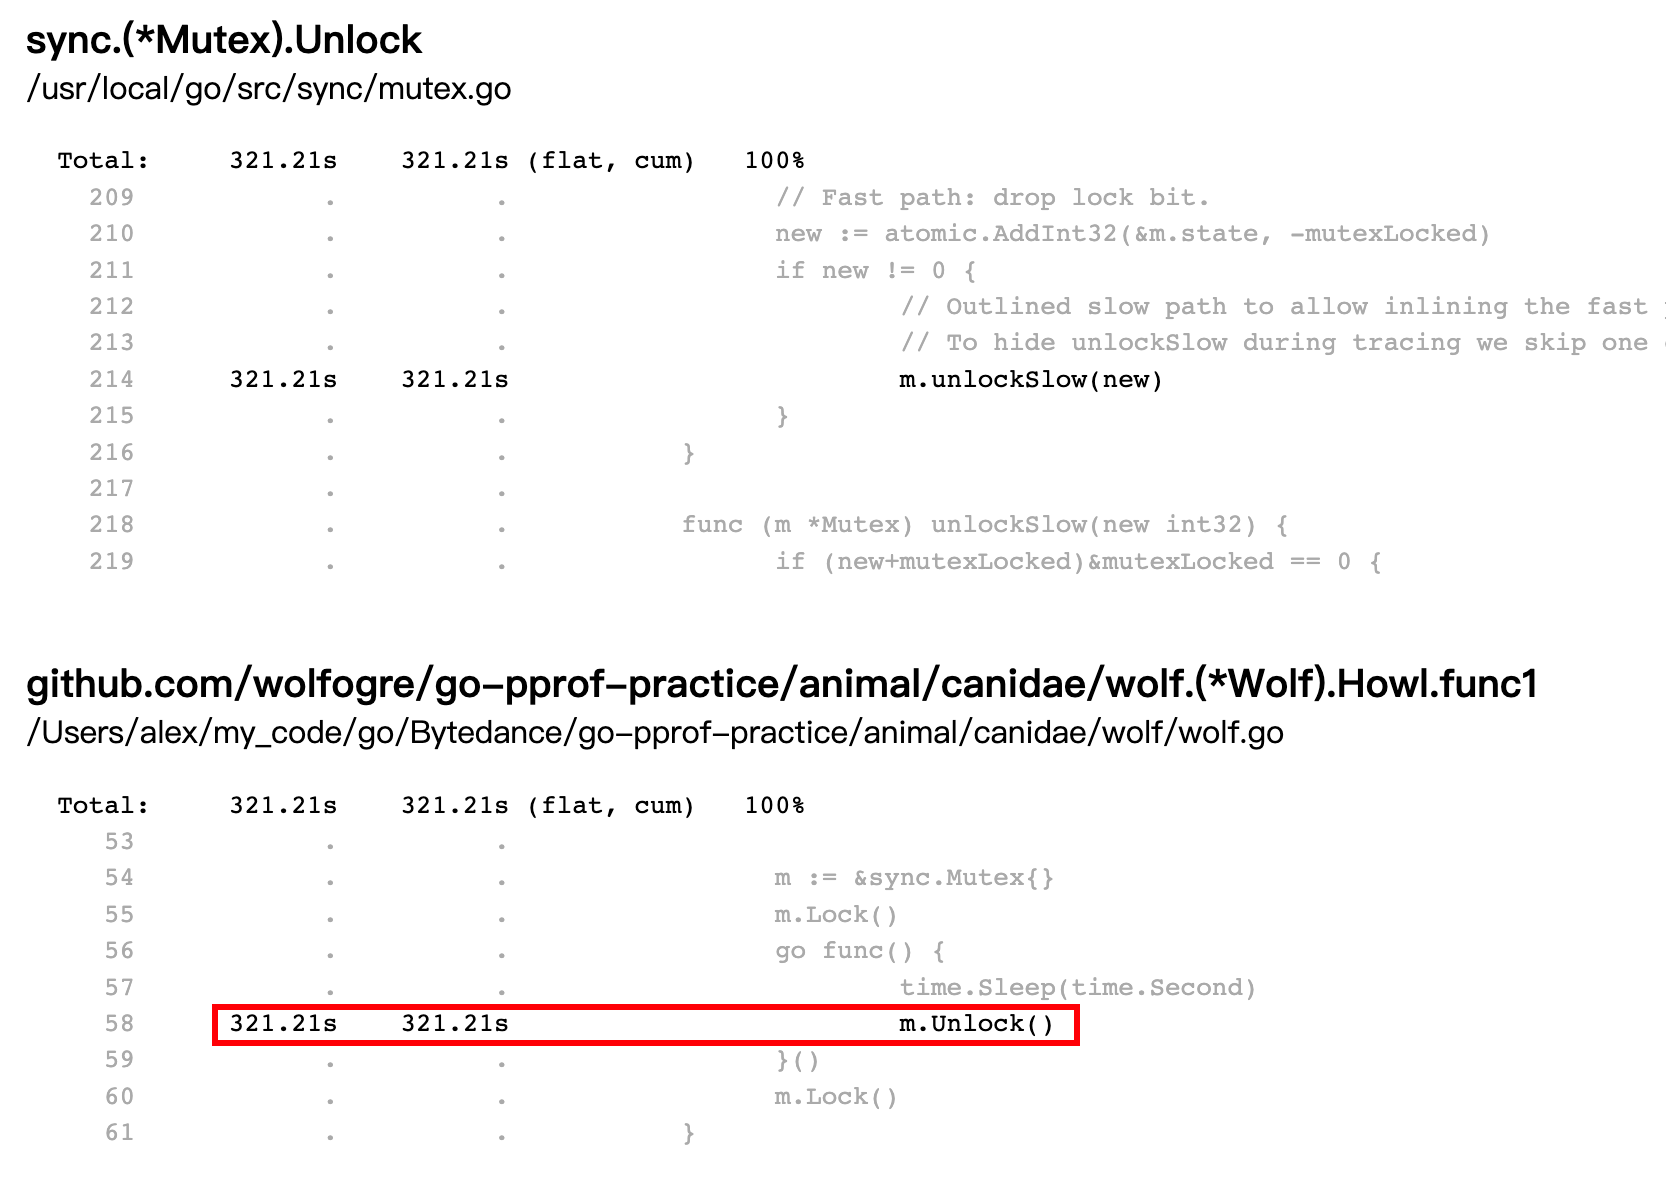
Source view找到问题了昂!!!
排查实战-block
命令行工具直接采样
alex ~/my_code/go/Bytedance/go-pprof-practice [master] $ go tool pprof -http=:8080 "http://localhost:6060/debug/pprof/block"
Fetching profile over HTTP from http://localhost:6060/debug/pprof/block
Saved profile in /Users/alex/pprof/pprof.contentions.delay.002.pb.gz
Serving web UI on http://localhost:8080
两个block为什么只展示了一个
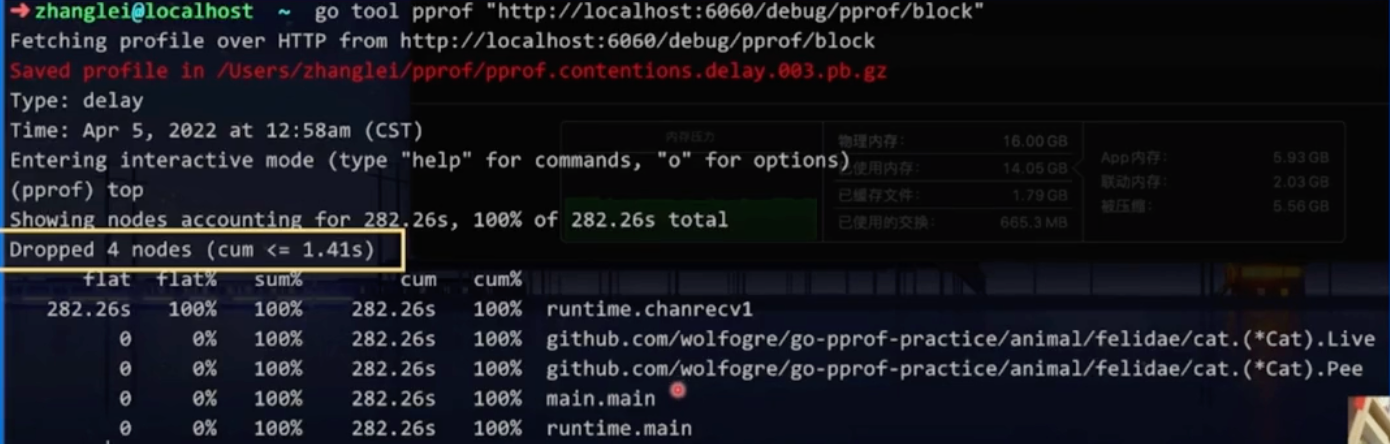
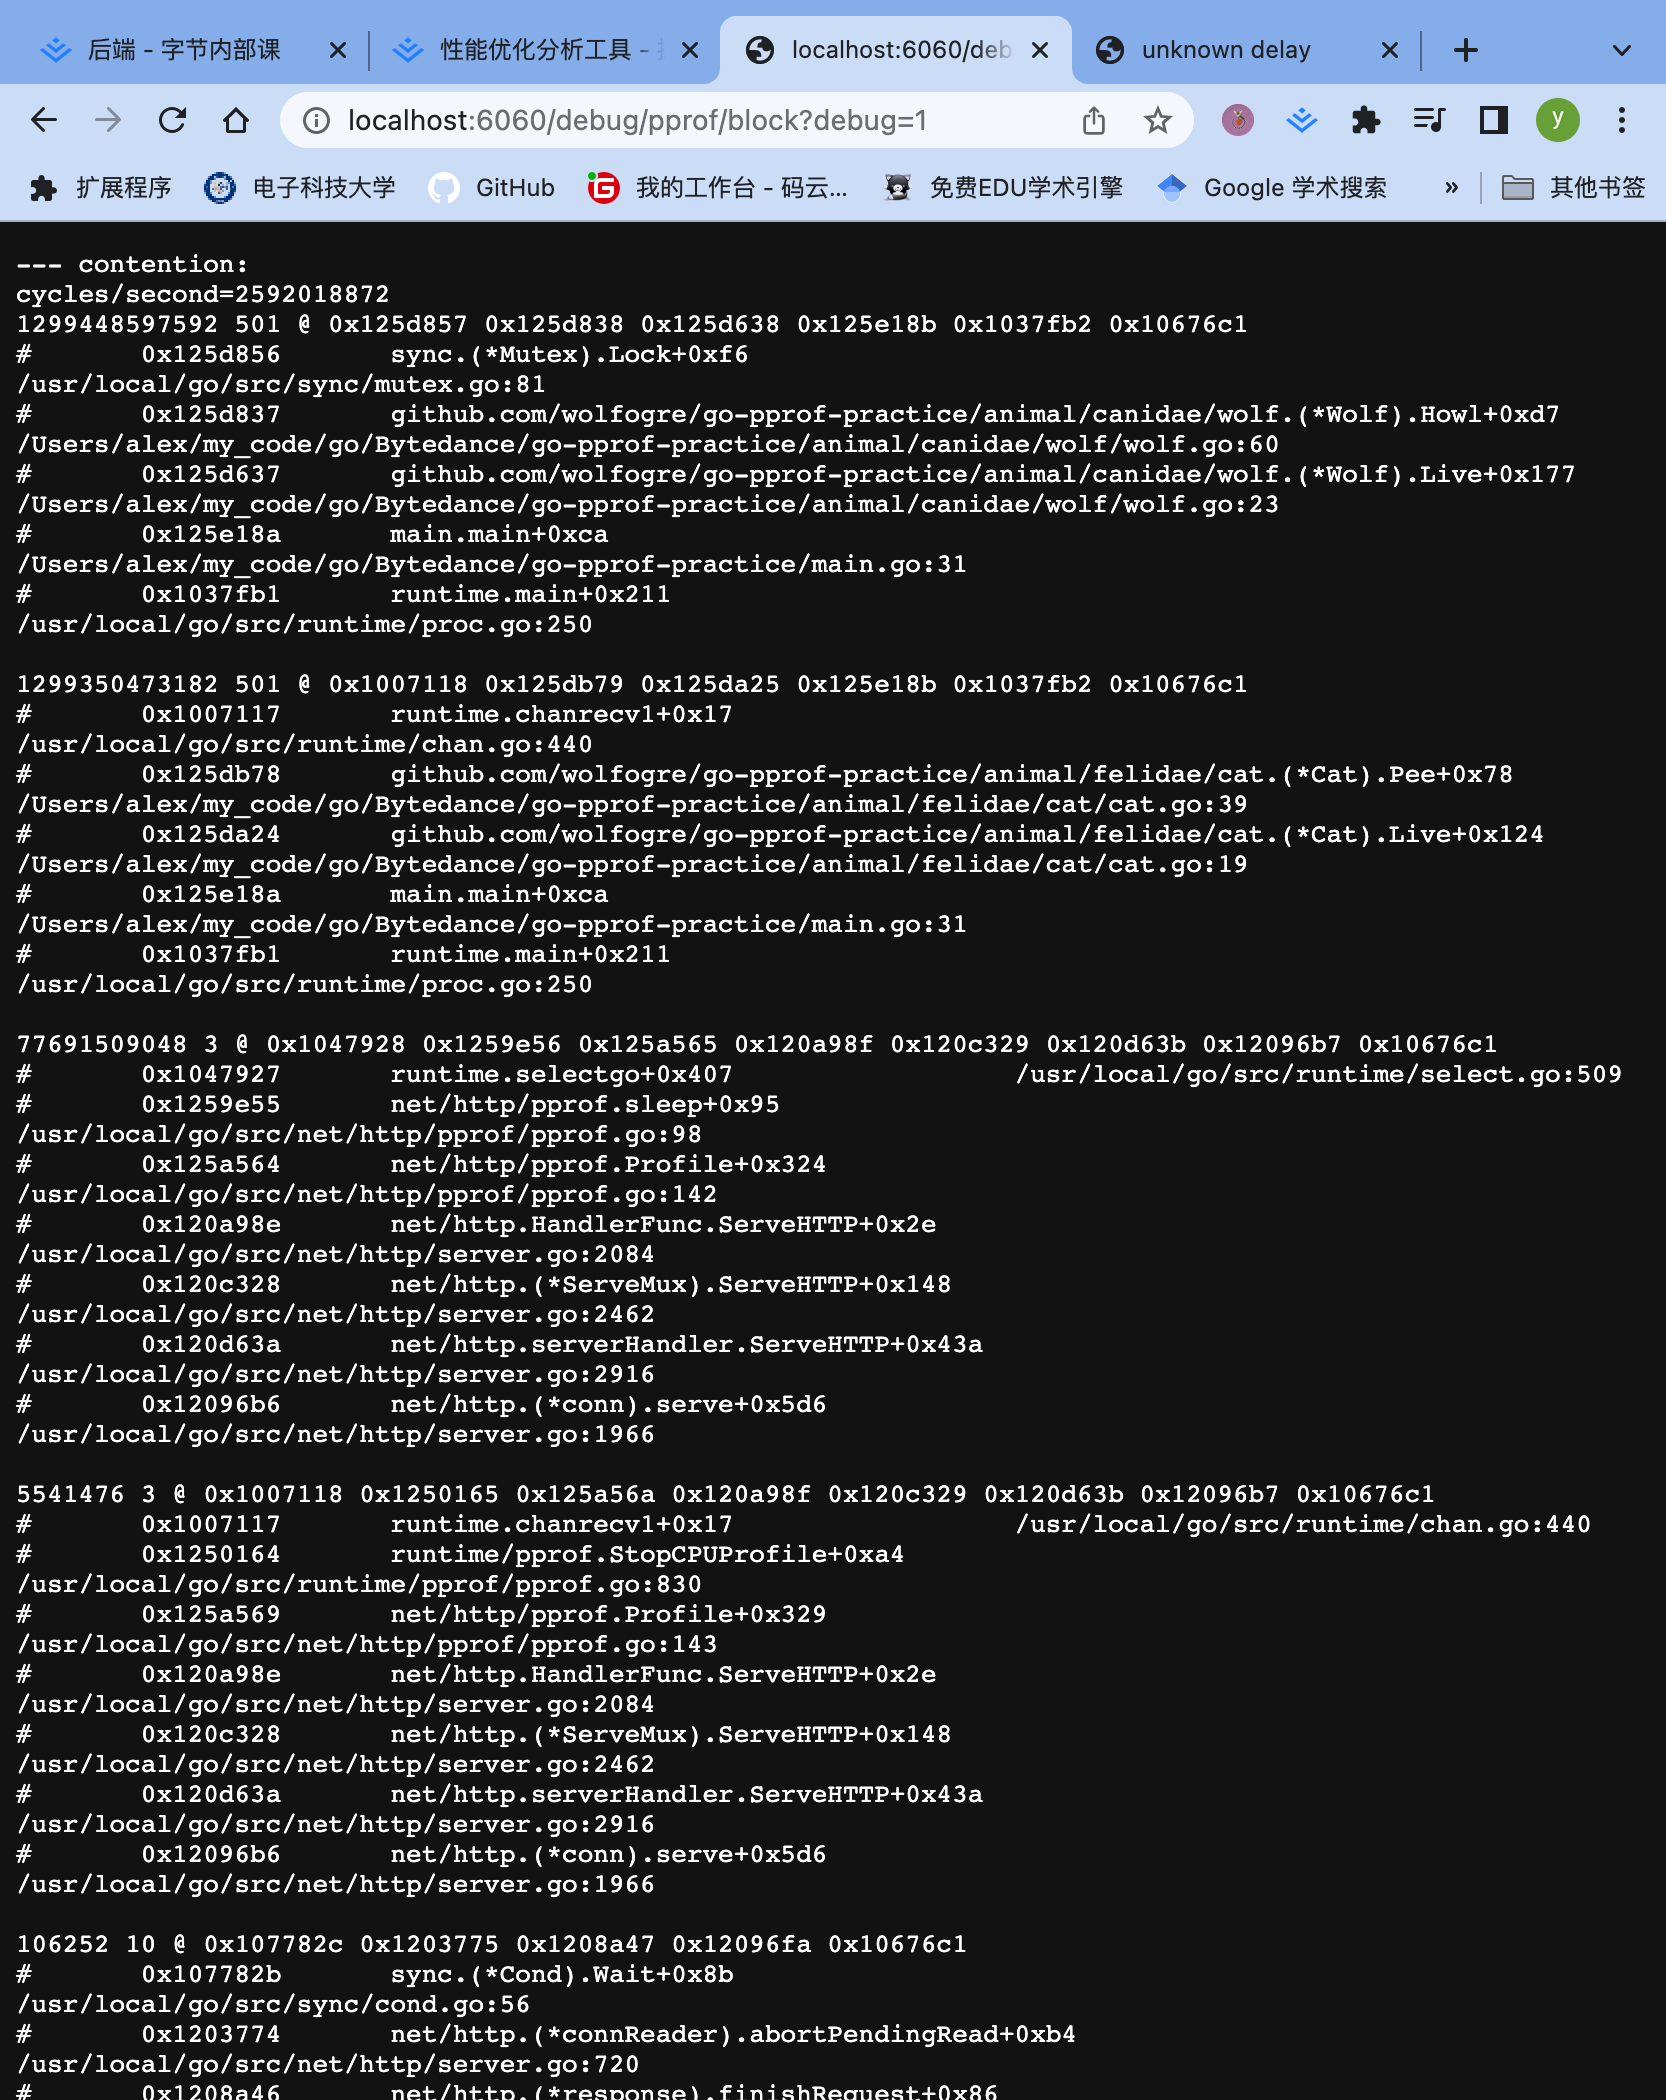
采样可能采到了,全量数据特别多,默认过滤策略,把一些占比小的数据过滤掉了。想看怎么办?
首页的页面
首页里面会包含
可以点击首页对应的block标签,进去康康昂!!!
Summary
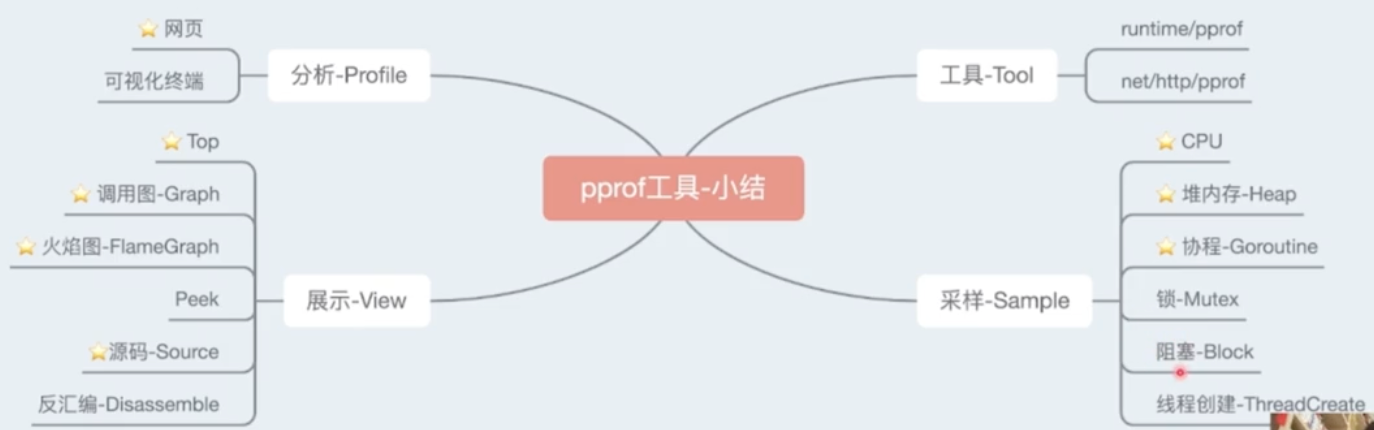
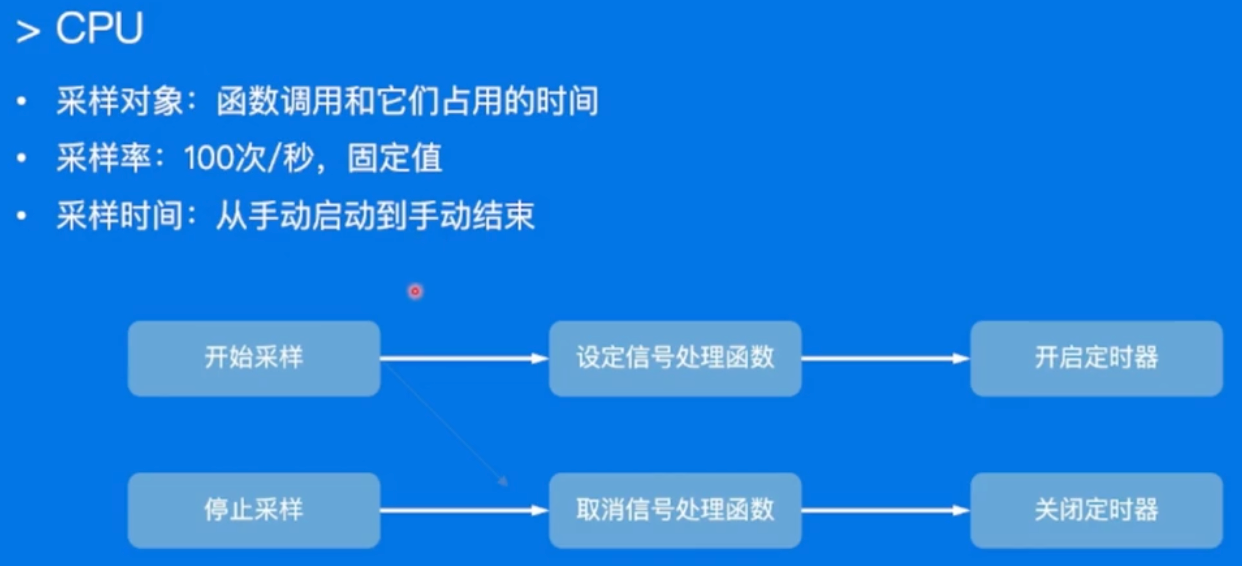
proof-采样过程和原理
采样过程和工作原理
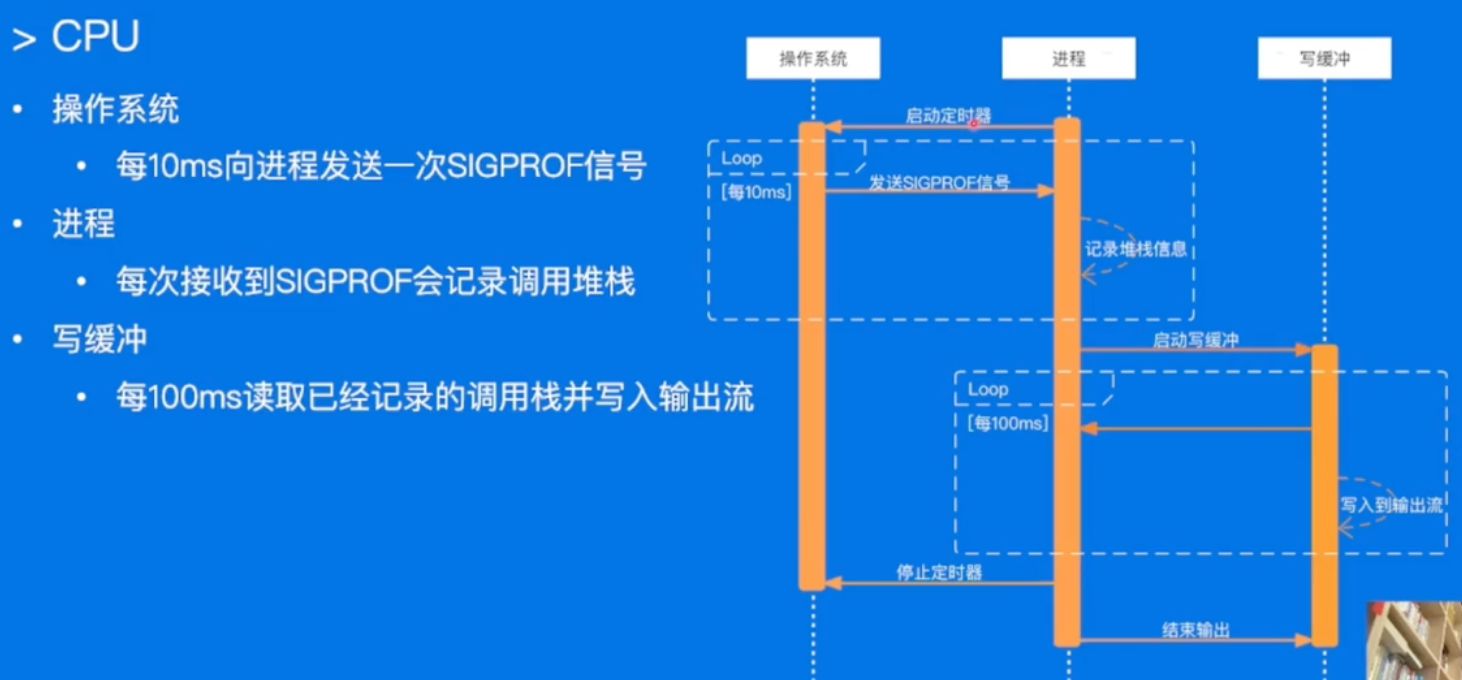
- CPU
- Heap

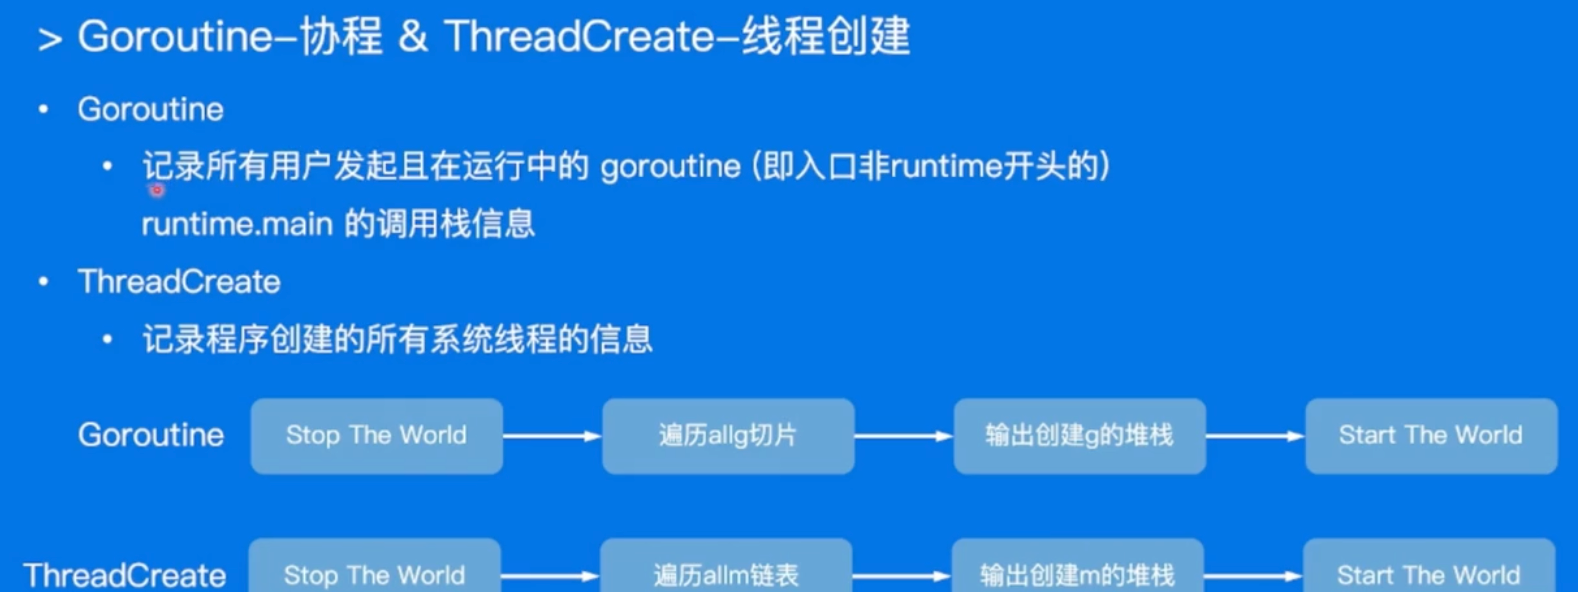
- Goroutine
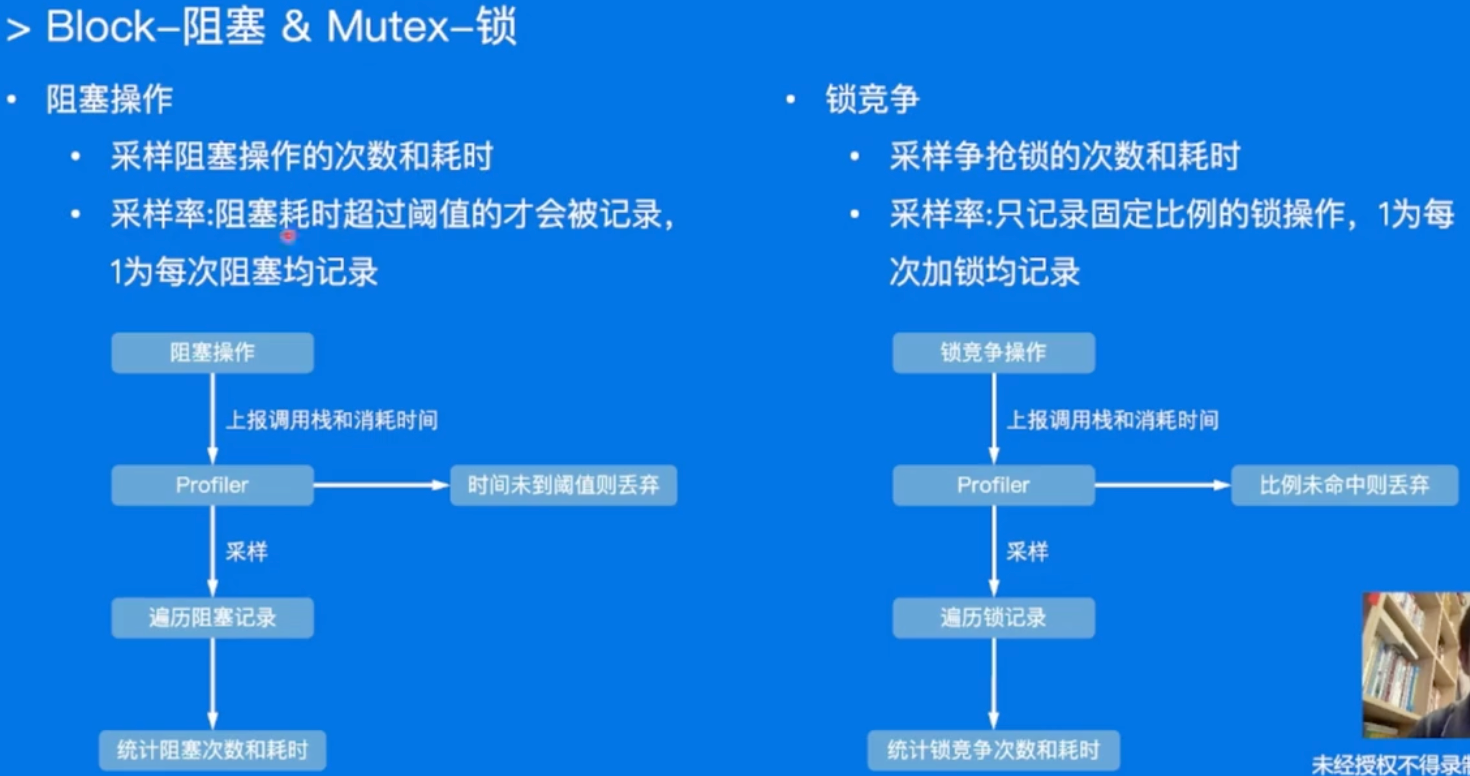
- Block & Mutex
- 小结:

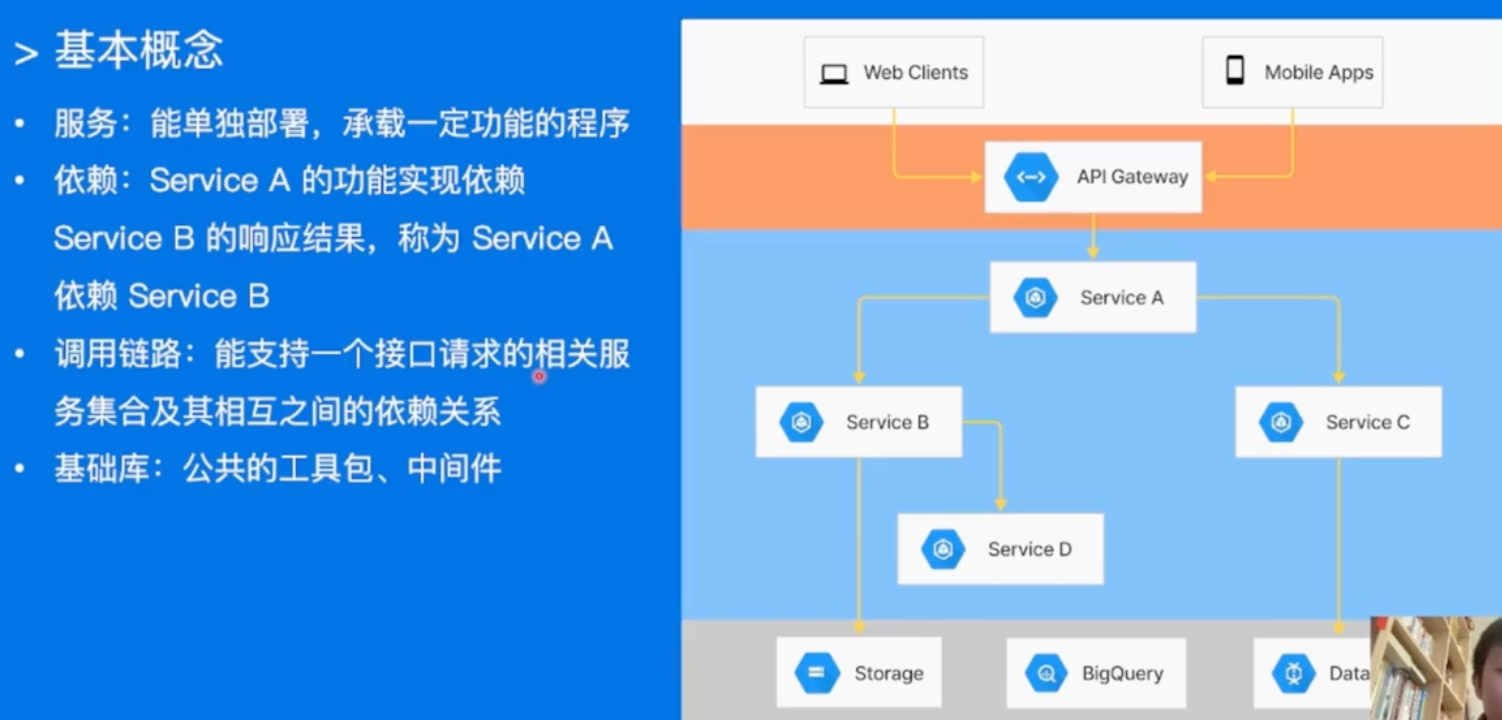
性能调优案例
- 调优包含模块
- 业务服务优化
- 基础库优化
- Go语言优化
业务服务优化
- 流程:
- 建立服务性能评估手段
- 分析性能数据,定位性能瓶颈
- 重点优化项改造
- 优化效果验证
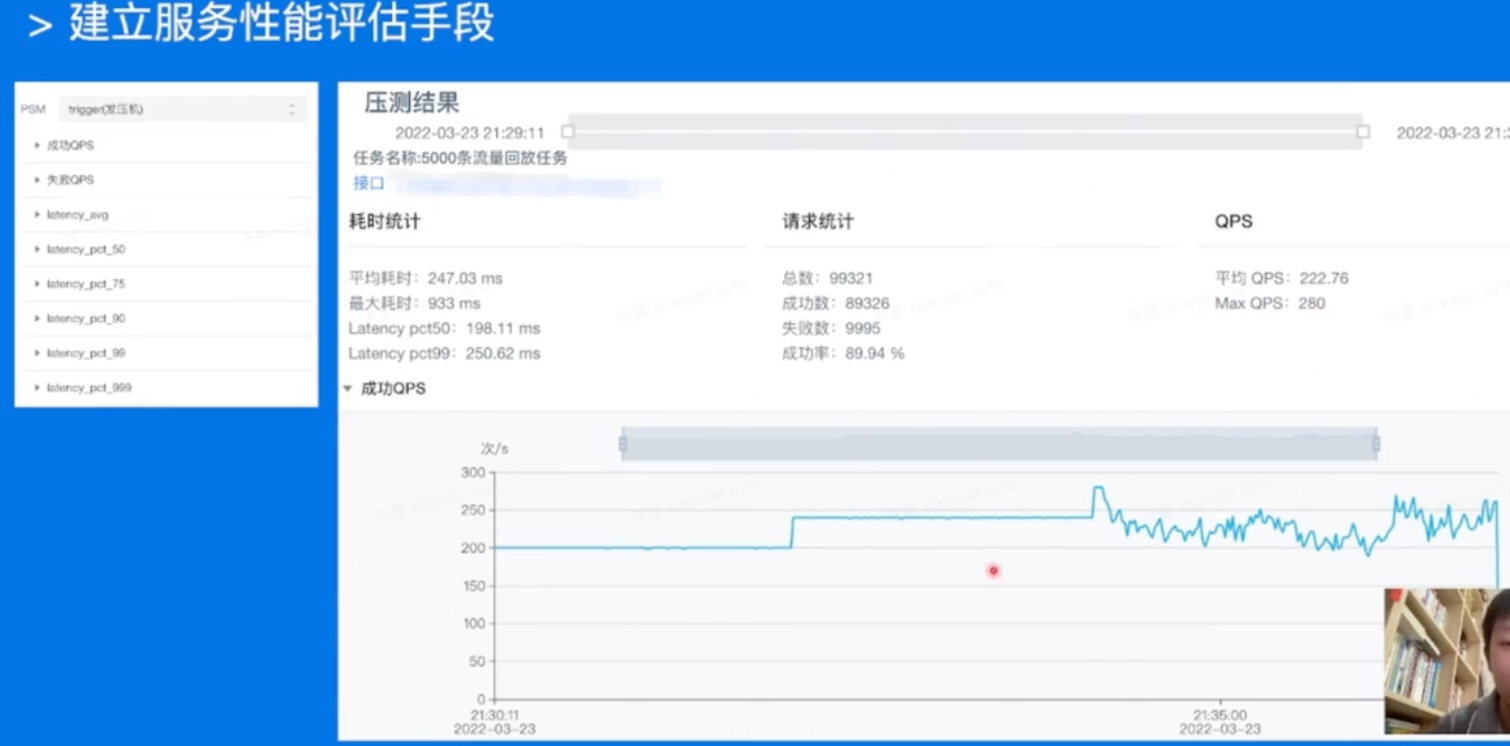
建立服务性能评估手段

分析性能数据,定位性能瓶颈
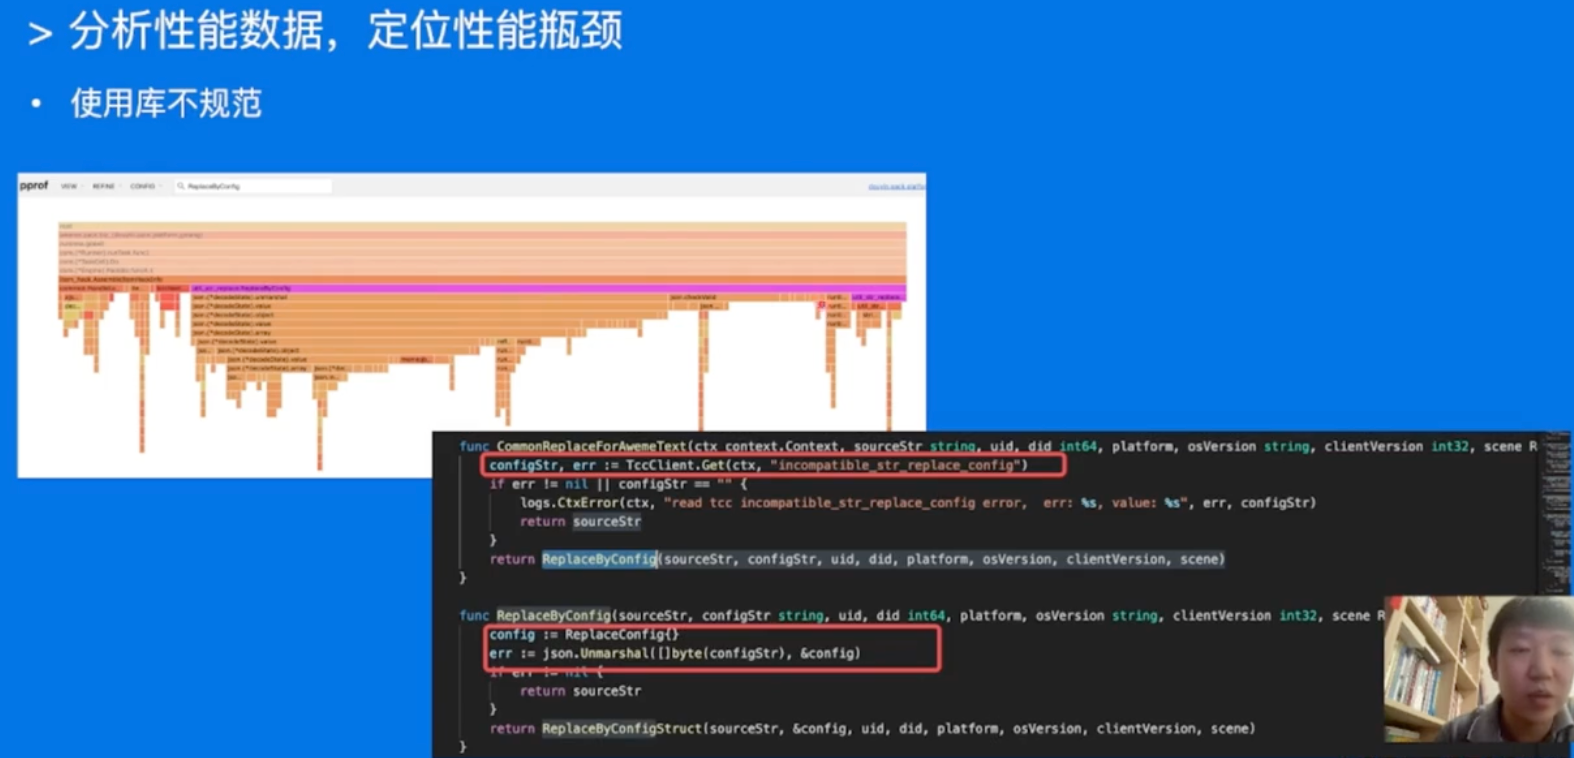
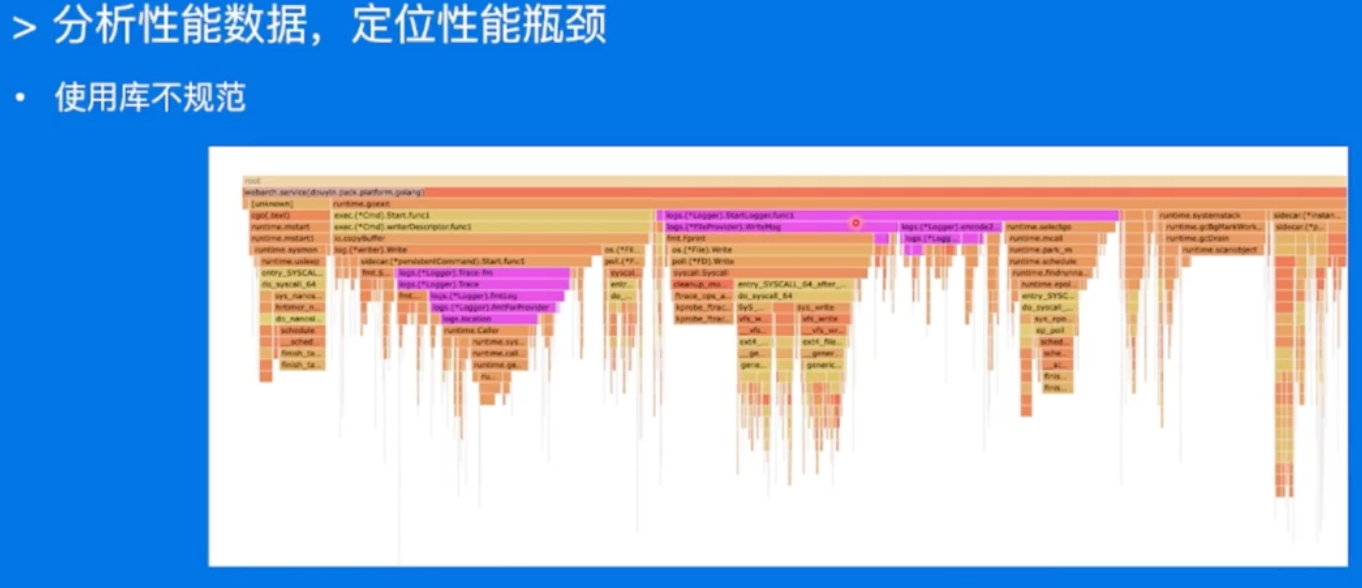
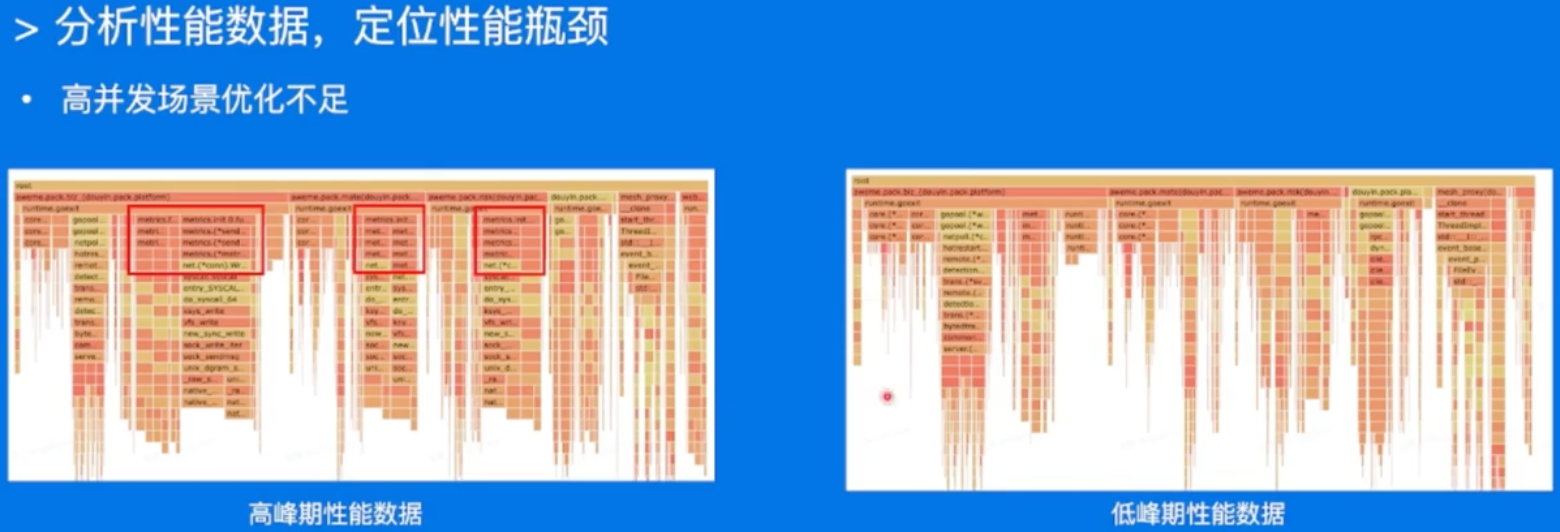
同一个库,在不同的负载下的表现都可能会有非常大的差异昂!
重点优化项改造
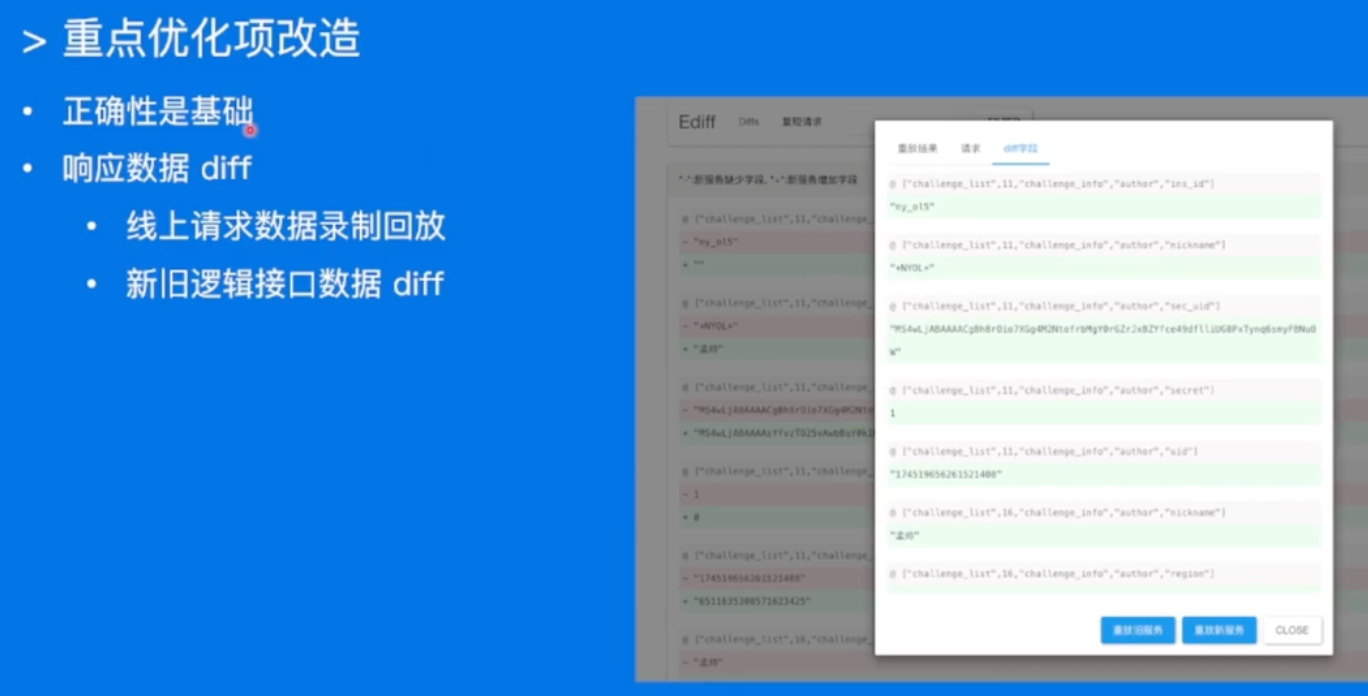
正确性是第一位!!!
优化效果验证&上线
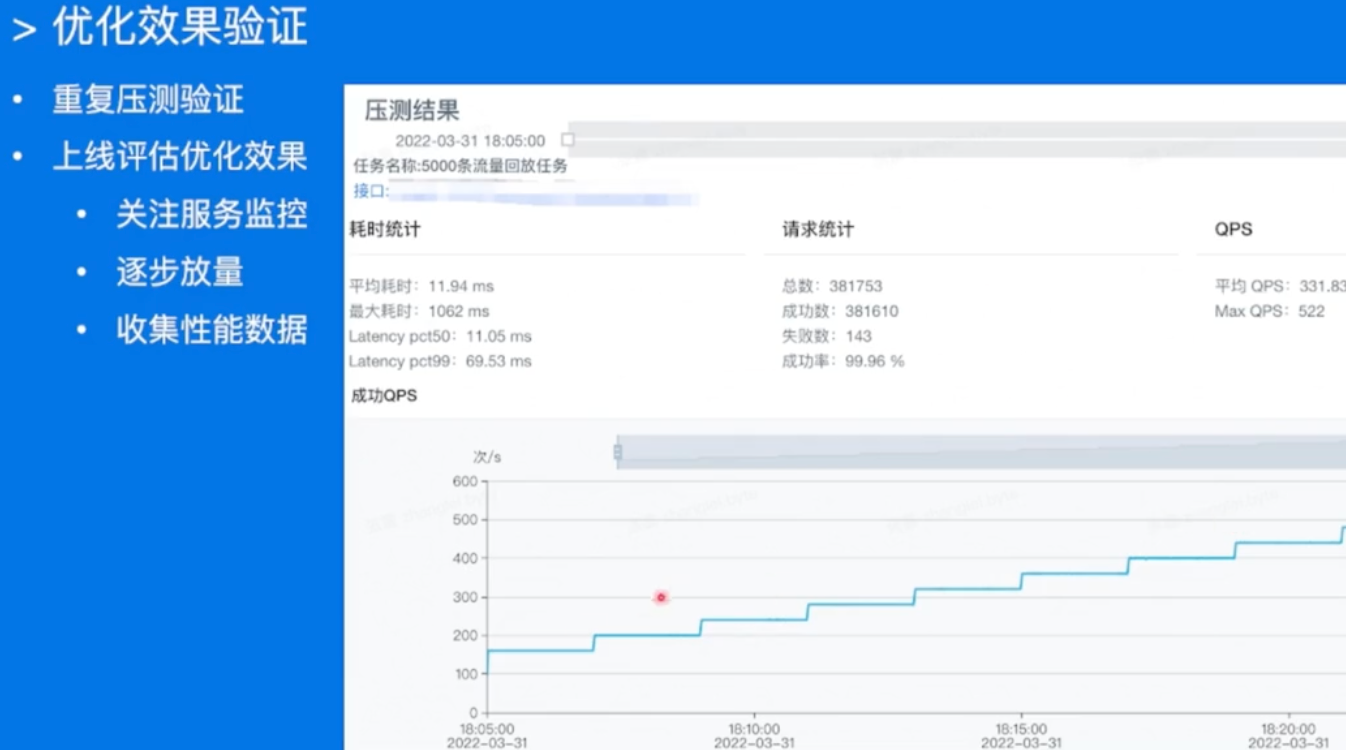
味儿太对了,逐步放量,小流量测试,然后灰度放量!!!
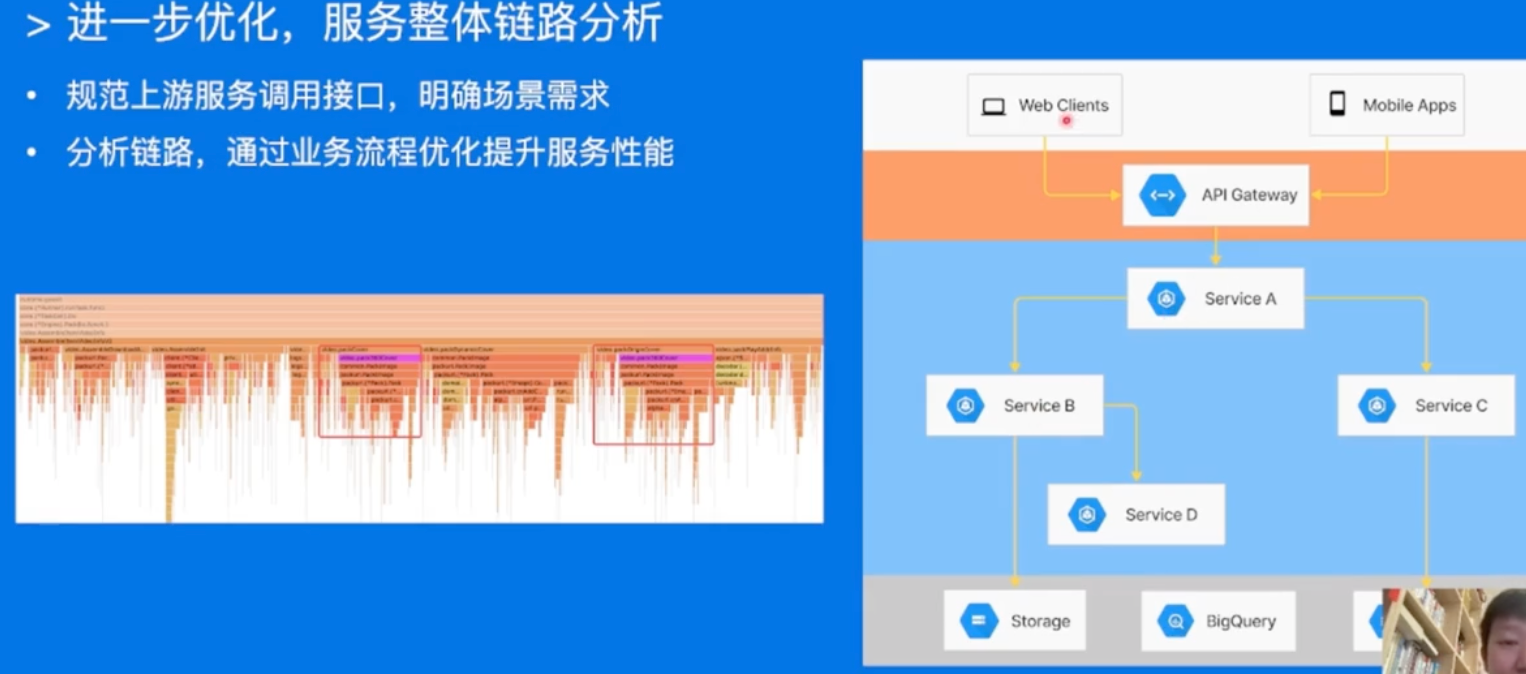
整体链路分析也很重要昂!!! -> 整体缓存哇,之类的,整条调用链路分析昂!!!
基础库优化
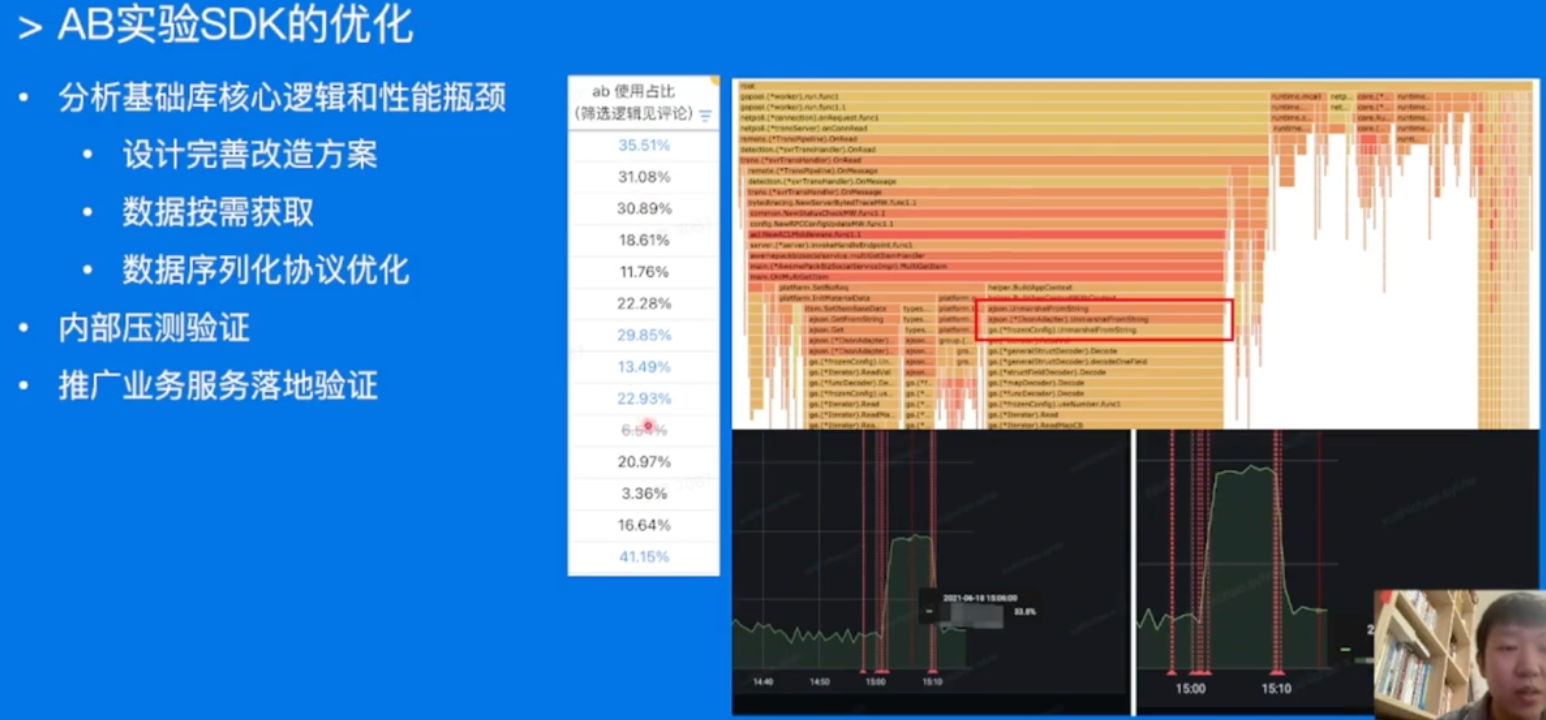
基础库可能同时被多个业务使用,分析优化。升级上线之后,其实能带来比较多的性能提升昂!!!
Go语言优化

Go本身版本的升级啊,编译器的优化之类的,都可能会带来收益昂!
Summary

References
- gofmt和goimports的配置:juejin.cn/post/706853…
- Geektutu:geektutu.com/post/hpg-sl… geektutu.com,https://geektutu.c…
- Golang中Atomic的实现和保证:juejin.cn/post/693421…
- 《golang pprof 实战》代码实验用例:github.com/wolfogre/go…
- 错误处理,%w和%v的区别: stackoverflow.com/questions/6…