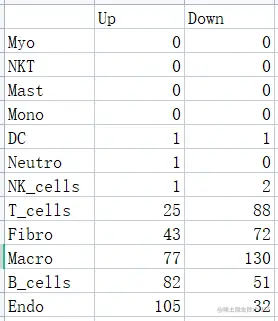
数据准备——主要是找到目标细胞群的差异基因,分别为up和down
T_cells$celltype.group <- paste(T_cells$celltype2, T_cells$orig.ident, sep = "_")
Idents(T_cells) <- "celltype.group"
T_cells.markers <- FindMarkers(T_cells,ident.1 = "T_cells_EAM",ident.2 = "T_cells_Control", verbose = TRUE, test.use = 'wilcox',min.pct = 0.1)

mydeg_1 <- FindMarkers(T_cells,ident.1 = 'T_cells_EAM+HCQ',ident.2 ='T_cells_EAM', verbose = TRUE, test.use = 'wilcox',min.pct = 0.1)


#上调的基因
T_cells.markers <- subset(T_cells.markers, p_val_adj<0.05&abs(avg_log2FC)>0.15)
sig_dge.up_T_cells_EAM <- subset(T_cells.markers, p_val_adj<0.05&avg_log2FC>0.15)
sig_dge.down_T_cells_EAM <- subset(T_cells.markers, p_val_adj<0.05&avg_log2FC< -0.15)


mydeg_1 <- subset(mydeg_1, p_val_adj<0.05&abs(avg_log2FC)>0.15)#按p校正值<0.05且|abs(log2FC)|>0.15取差异基因?
sig_dge.up_T_cells_EH <- subset(mydeg_1, p_val_adj<0.05&avg_log2FC>0.15)#EAM上调的基因
sig_dge.down_T_cells_EH <- subset(mydeg_1, p_val_adj<0.05&avg_log2FC< -0.15)

bb <- rownames(sig_dge.down_T_cells_EH)
cc <- rownames(sig_dge.up_T_cells_EAM)
aa <- intersect(bb,cc)
dd <- rownames(sig_dge.down_T_cells_EAM)
ee <- rownames(sig_dge.up_T_cells_EH)
ff <- intersect(dd,ee)
write.csv(aa,'T_cells_down.csv')
write.csv(ff,'T_cells_up.csv')
实操
library(ggplot2)
library(reshape2)
diff= read.delim("https://www.bioladder.cn/shiny/zyp/bioladder2/model/ggplot2/DoublePositionBarPlot/demo.txt")
diff = melt(diff)
head(diff)
ggplot(diff, aes(
x = factor(X,levels = unique(X)),
y = ifelse(variable == "Up", value, -value),
fill = variable)) +
geom_bar(stat = 'identity')+
coord_flip()+
geom_text(
aes(label=value,
hjust = ifelse(variable == "Up", -0.4, 1.1)
),
size=3
)+
scale_y_continuous(
labels = abs,
expand = expansion(mult = c(0.1, 0.1)))+
scale_fill_manual(values = c("#E64B35FF", "#3C5488FF"))


