option = {
backgroundColor: '#0f164a', \\ 背景
tooltip: {
trigger: 'axis',
axisPointer: {
type: 'shadow'
}
},
grid: {
left: '3%',
right: '4%',
bottom: '3%',
containLabel: true
},
label: {
show: true,
position: 'top'
},
legend: {
data: ['line', 'bar'],
textStyle: {
color: '#ccc'
}
},
xAxis: {
type: 'category',
axisLabel: {
textStyle: {
color: '#fff'
}
},
axisLine: {
//x轴线的颜色以及宽度
show: true,
lineStyle: {
color: '#0e96b0',
width: 1,
type: 'solid'
}
},
splitLine: {
//分割线配置
show: false,
lineStyle: {
color: '#fff'
}
},
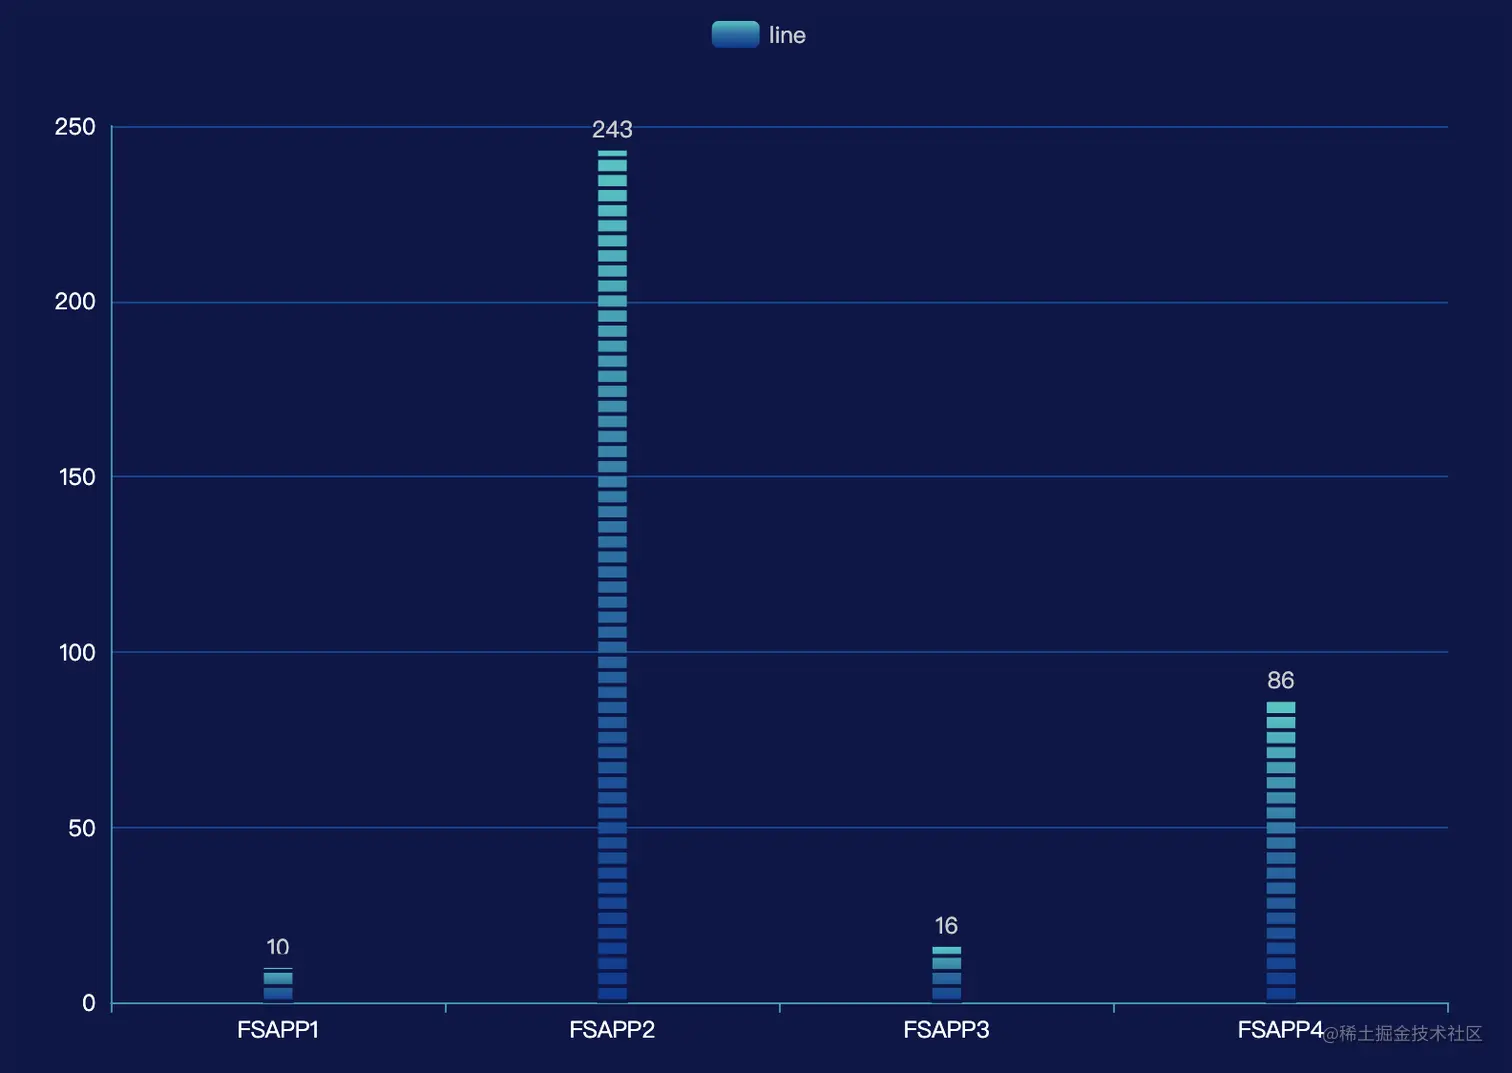
data: ['FSAPP1', 'FSAPP2', 'FSAPP3', 'FSAPP4']
// boundaryGap: [0, 0.008],
},
yAxis: {
axisLine: {
//x轴线的颜色以及宽度
show: true,
lineStyle: {
color: '#0e96b0',
width: 1,
type: 'solid'
}
},
type: 'value',
axisLabel: {
textStyle: {
color: '#fff'
}
},
splitLine: {
//分割线配置
// show: false,
lineStyle: {
color: '#014294'
}
}
},
series: [
{
name: 'line',
type: 'bar',
barGap: '-100%',
barWidth: 15,
itemStyle: {
color: new echarts.graphic.LinearGradient(0, 1, 0, 0, [
{ offset: 0, color: '#003792' },
{ offset: 0.5, color: '#036aa4' },
{ offset: 1, color: '#08c9c4' }
])
},
z: 10,
data: [10, 243, 16, 86]
},
{
type: 'pictorialBar',
symbol: 'rect',
itemStyle: {
color: '#0f164a'
},
label: {
show: false,
position: 'top'
},
symbolRepeat: true,
symbolSize: [16, 2],
symbolMargin: 3,
z: 12,
data: [10, 243, 16, 86]
}
]
};
option = {
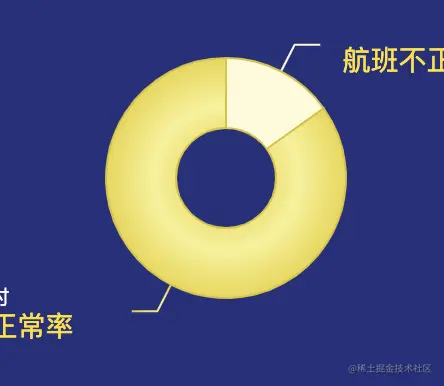
color: ["#fdfad7", "#f8ee75"],
series: [
{
type: "pie",
radius: [25, 60],
left: "center",
width: "150%",
height: "100%",
itemStyle: {
borderColor: "#d6c52d",
borderWidth: 1,
},
label: {
alignTo: "edge",
formatter: "{time|{c} 小时}\n{name|{b}} ",
edgeDistance: 10,
lineHeight: 15,
minMargin: 4,
rich: {
time: {
fontSize: 10,
color: "#fff",
},
name: {
color: "#ffe112",
fontSize: 14,
},
},
},
labelLine: {
length: 15,
length2: 10,
maxSurfaceAngle: 80,
},
data: [
{
name: "航班不正常率",
value: 1,
title: "什么什么架次",
num: 3,
itemStyle:{
color:new echarts.graphic.RadialGradient(0.5, 0.5, 0.6, [
{ offset: 0, color: "#e3c91c" },
{ offset: 0.5, color: "#f7f293" },
{ offset: 1, color: "#e3c91c" },
])
}
},
{
name: "航班正常率",
value: 5.6,
title: "什么什么架次",
num: 234,
itemStyle:{
color: '#f00'
}
},
],
},
],
}


