

1.前提条件
检查你是否已经安装了ruby 3。检查你是否已经安装了bundler,以及版本7以上的npm。
$> ruby -v
ruby 3.0.0p0 // you need at least version 3 here
$> bundle -v
Bundler version 2.2.11
任何更高的版本都可以使用。
2.安装最小的网络应用程序
$> mkdir myapp && cd myapp
$/myapp> echo "source 'https://rubygems.org'" > Gemfile
$/myapp> echo "gem 'rails', '7.0.0'" >> Gemfile
$/myapp> bundle install
$/myapp> bundle exec rails new . --force
$/myapp> bundle update
$/myapp> bin/rails db:create
$/myapp> bin/rails db:migrate
3.探索Gemfile
source "https://rubygems.org"
git_source(:github) { |repo| "https://github.com/#{repo}.git" }

ruby "3.0.0"

gem "rails", "~> 7.0.0"
gem "sprockets-rails"
gem "pg", "~> 1.1"
gem "puma", "~> 5.0"
gem "tzinfo-data", platforms: %i[ mingw mswin x64_mingw jruby ]

group :development, :test do
  gem "debug", platforms: %i[ mri mingw x64_mingw ]
end
看到最后3行了吗?** 在任何Rails应用程序中,调试宝石都是默认可用的**,即使是最小化的应用程序,这意味着Rails维护者认为这个调试宝石是你不能缺少的东西。
4.Scaffold视图、Rails和模型
为了快速测试(以及创建管理界面),Rails提供了脚手架:在一个资源上完全创建CRUD操作。
$/myapp> bin/rails generate scaffold Computer name:string price:integer
      invoke  active_record
      create    db/migrate/20211222182724_create_computers.rb
      create    app/models/computer.rb
      invoke    test_unit
      create      test/models/computer_test.rb
      create      test/fixtures/computers.yml
      invoke  resource_route
       route    resources :computers
      invoke  scaffold_controller
      create    app/controllers/computers_controller.rb
      invoke    erb
      create      app/views/computers
      create      app/views/computers/index.html.erb
      create      app/views/computers/edit.html.erb
      create      app/views/computers/show.html.erb
      create      app/views/computers/new.html.erb
      create      app/views/computers/_form.html.erb
      create      app/views/computers/_computer.html.erb
      invoke    resource_route
      invoke    test_unit
      create      test/controllers/computers_controller_test.rb
      invoke    helper
      create      app/helpers/computers_helper.rb
      invoke      test_unit
我们将在后面写到脚手架的内容。现在,我们只是注意到Rails为我们创建了所有的骨架。非常方便。
然后打开config/routes.rb
# inside config/routes.rb
Rails.application.routes.draw do
  resources :computers
  root to: "computers#index"
end
然后运行迁移:
$> bin/rails db:migrate
并启动你的本地Web服务器
$> bin/rails server
最后打开你的浏览器http://localhost:3000
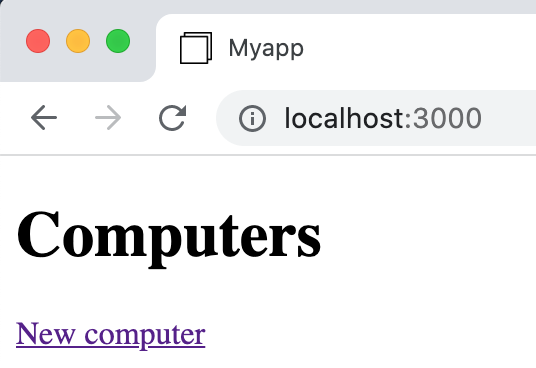
Localhost
很好!一切顺利。让我们看看如何调试这个应用程序,以免出现任何突然的错误。
5.调试我们的应用程序
首先打开app/controllers/computers_controller.rb
class ComputersController < ApplicationController
  before_action :set_computer, only: %i[ show edit update destroy ]

  # GET /computers
  def index
    @computers = Computer.all
  end

  # A lot more code...
end
从注释中,你可以猜到,每次在浏览器中输入/computers URL时,都会调用index函数。很好!这让我们可以轻松地尝试ruby/debuggem。
修改app/controllers/computers_controller.rb如下
class ComputersController < ApplicationController
  before_action :set_computer, only: %i[ show edit update destroy ]

  # GET /computers
  def index
    my_age = 42
    binding.break
    @computers = Computer.all
    binding.break
  end

  # A lot more code...
end
所以我们添加了2行binding.break
从名字上看,我们可以猜测Rails服务器应该在每次到达binding.break 指令时停止。
到达一个断点
停止你的本地Web服务器。用.NET重新启动它。
$> bin/rails server
并在http://localhost:3000,刷新你的浏览器
你应该看到表示你的页面现在无法加载的旋钮。
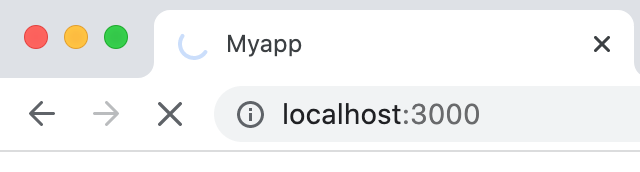
旋转器
可能断点确实已经到达了,就像计划的那样 !
打开你的终端。
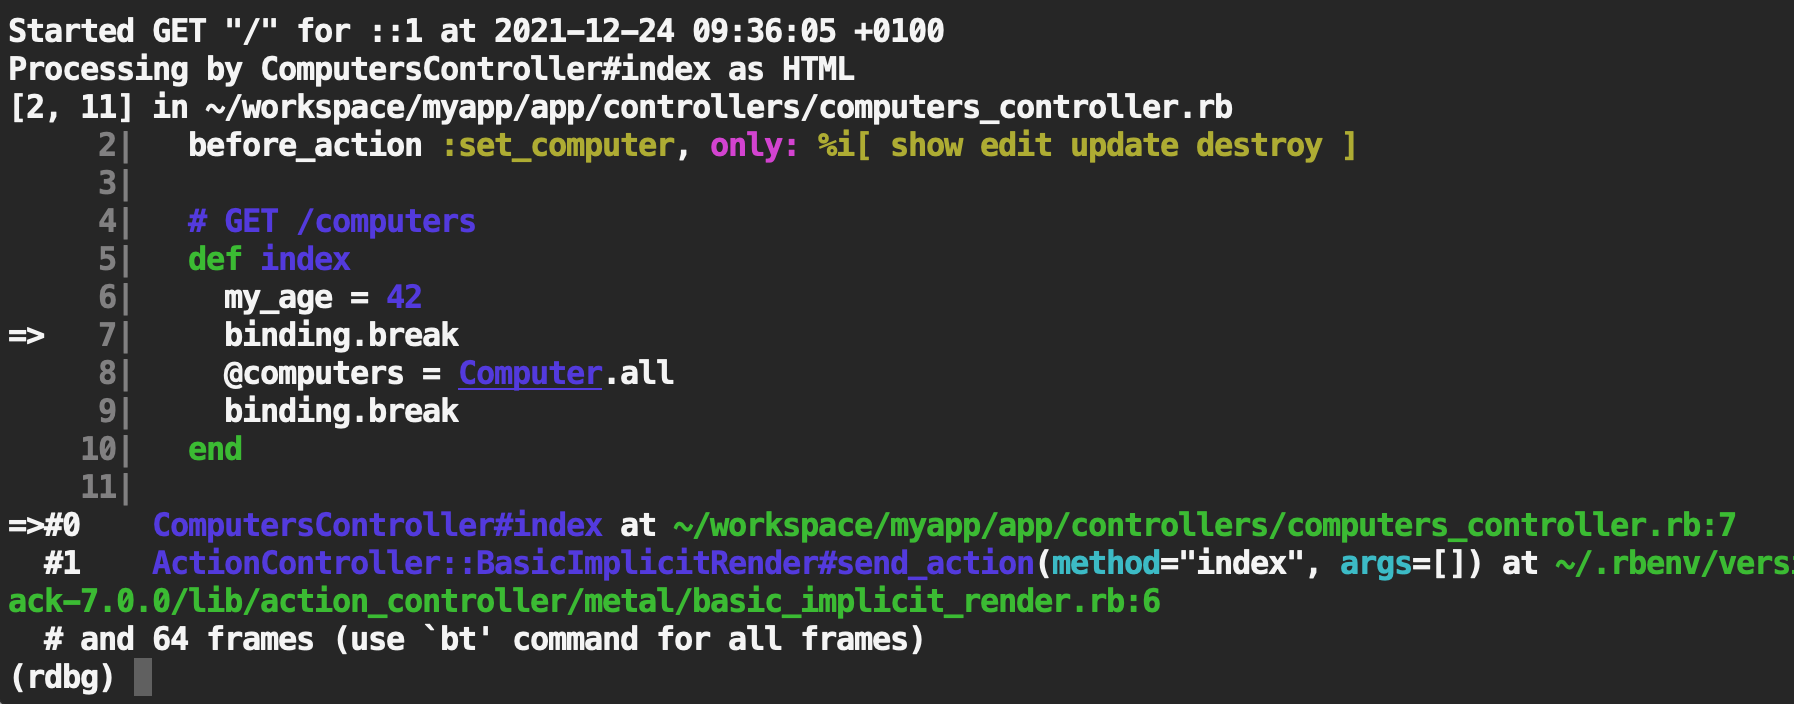
终端中的美丽色彩
程序已经在你要求的地方停止了:在binding.break 指令上。
第一课 :
ruby/debug允许我们在终端中调试Ruby-on-Rails程序,它具有你通常在IDE中找到的所有功能:下一步、评估、继续,等等。
第二课 :
ruby/debug带有漂亮的颜色,这对我们帮助很大。
评估一个变量
在你的终端中,光标已经定位在 ruby 调试器中。
键入
(rdbg) my_age # ruby
42
(rdbg) @computers
nil
(rdbg)
my_age 已经存在,并且调试器向我们显示了它的值。很好 !当我们到达第一个断点时,@computers还没有被设置,所以它的值是 (现在)。nil
设置一个变量
(rdbg) eval my_age=43    # command
(rdbg) my_age    # ruby
43
(rdbg)
如果你想在你的控制器或服务对象中达到一个特定的状态,这非常有用。还要注意每行末尾的注释。
第三课 :
ruby/debug 使得实时读取和写入任何变量成为可能,使你的 Rails 应用程序能够达到任何想要的状态。
第四课 :
ruby/debug 有一个很好的开发者用户体验,它试图对现有的命令进行注释(如果没有注释出现,你就试图输入一个不存在的命令...)。
跳到下一个断点
(rdbg) c    # continue command
[4, 13] in ~/workspace/myapp/app/controllers/computers_controller.rb
     4|   # GET /computers
     5|   def index
     6|     my_age = 42
     7|     binding.break
     8|     @computers = Computer.all
=>   9|     binding.break
    10|   end
现在,毫不奇怪,如果你评估@computers ,它就存在。
(rdbg) @computers # ruby
[]
(rdbg) 3 + 4 # ruby
7
注意,你可以输入任何Ruby表达式,而不仅仅是现有的变量。
逃离调试器
输入 "c "和 "enter",直到你从所有断点中逃脱。
(rdbg) c    # continue command
  Rendering layout layouts/application.html.erb
  Rendering computers/index.html.erb within layouts/application
  Rendered computers/index.html.erb within layouts/application (Duration: 0.7ms | Allocations: 327)
  Rendered layout layouts/application.html.erb (Duration: 4.4ms | Allocations: 1317)
Completed 200 OK in 1581101ms (Views: 9.0ms | ActiveRecord: 9.0ms | Allocations: 139408)
然后回到浏览器,在http://locahost:3000。旋转器已经消失了。如果你重新加载页面,旋转器又出现了,你可以在终端享受一个新的调试会话。
所有可用的选项
在调试器内,输入 "h"
(rdbg) h    # help command
### Control flow

* `s[tep]`
  * Step in. Resume the program until next breakable point.
* `s[tep] <n>`
  * Step in, resume the program at `<n>`th breakable point.
* `n[ext]`
  * Step over. Resume the program until next line.
* `n[ext] <n>`
  * Step over, same as `step <n>`.
* `fin[ish]`
  * Finish this frame. Resume the program until the current frame is finished.
* `fin[ish] <n>`
  * Finish `<n>`th frames.
* `c[ontinue]`
  * Resume the program.
* `q[uit]` or `Ctrl-D`
  * Finish debugger (with the debuggee process on non-remote debugging).
* `q[uit]!`
  * Same as q[uit] but without the confirmation prompt.
* `kill`
  * Stop the debuggee process with `Kernel#exit!`.
* `kill!`
  * Same as kill but without the confirmation prompt.
* `sigint`
  * Execute SIGINT handler registered by the debuggee.
  * Note that this command should be used just after stop by `SIGINT`.

### Breakpoint

* `b[reak]`
  * Show all breakpoints.
* `b[reak] <line>`
  * Set breakpoint on `<line>` at the current frame's file.
* `b[reak] <file>:<line>` or `<file> <line>`
  * Set breakpoint on `<file>:<line>`.
* `b[reak] <class>#<name>`
   * Set breakpoint on the method `<class>#<name>`.
* `b[reak] <expr>.<name>`
   * Set breakpoint on the method `<expr>.<name>`.
* `b[reak] ... if: <expr>`
  * break if `<expr>` is true at specified location.
* `b[reak] ... pre: <command>`
  * break and run `<command>` before stopping.
* `b[reak] ... do: <command>`
  * break and run `<command>`, and continue.
* `b[reak] ... path: <path_regexp>`
  * break if the triggering event's path matches <path_regexp>.
* `b[reak] if: <expr>`
  * break if: `<expr>` is true at any lines.
  * Note that this feature is super slow.
* `catch <Error>`
  * Set breakpoint on raising `<Error>`.
* `catch ... if: <expr>`
  * stops only if `<expr>` is true as well.
* `catch ... pre: <command>`
  * runs `<command>` before stopping.
* `catch ... do: <command>`
  * stops and run `<command>`, and continue.
* `catch ... path: <path_regexp>`
  * stops if the exception is raised from a path that matches <path_regexp>.
* `watch @ivar`
  * Stop the execution when the result of current scope's `@ivar` is changed.
  * Note that this feature is super slow.
* `watch ... if: <expr>`
  * stops only if `<expr>` is true as well.
* `watch ... pre: <command>`
  * runs `<command>` before stopping.
* `watch ... do: <command>`
  * stops and run `<command>`, and continue.
* `watch ... path: <path_regexp>`
  * stops if the triggering event's path matches <path_regexp>.
* `del[ete]`
  * delete all breakpoints.
* `del[ete] <bpnum>`
  * delete specified breakpoint.

### Information

* `bt` or `backtrace`
  * Show backtrace (frame) information.
* `bt <num>` or `backtrace <num>`
  * Only shows first `<num>` frames.
* `bt /regexp/` or `backtrace /regexp/`
  * Only shows frames with method name or location info that matches `/regexp/`.
* `bt <num> /regexp/` or `backtrace <num> /regexp/`
  * Only shows first `<num>` frames with method name or location info that matches `/regexp/`.
* `l[ist]`
  * Show current frame's source code.
  * Next `list` command shows the successor lines.
* `l[ist] -`
  * Show predecessor lines as opposed to the `list` command.
* `l[ist] <start>` or `l[ist] <start>-<end>`
  * Show current frame's source code from the line <start> to <end> if given.
* `edit`
  * Open the current file on the editor (use `EDITOR` environment variable).
  * Note that edited file will not be reloaded.
* `edit <file>`
  * Open <file> on the editor.
* `i[nfo]`
   * Show information about current frame (local/instance variables and defined constants).
* `i[nfo] l[ocal[s]]`
  * Show information about the current frame (local variables)
  * It includes `self` as `%self` and a return value as `%return`.
* `i[nfo] i[var[s]]` or `i[nfo] instance`
  * Show information about instance variables about `self`.
* `i[nfo] c[onst[s]]` or `i[nfo] constant[s]`
  * Show information about accessible constants except toplevel constants.
* `i[nfo] g[lobal[s]]`
  * Show information about global variables
* `i[nfo] ... </pattern/>`
  * Filter the output with `</pattern/>`.
* `i[nfo] th[read[s]]`
  * Show all threads (same as `th[read]`).
* `o[utline]` or `ls`
  * Show you available methods, constants, local variables, and instance variables in the current scope.
* `o[utline] <expr>` or `ls <expr>`
  * Show you available methods and instance variables of the given object.
  * If the object is a class/module, it also lists its constants.
* `display`
  * Show display setting.
* `display <expr>`
  * Show the result of `<expr>` at every suspended timing.
* `undisplay`
  * Remove all display settings.
* `undisplay <displaynum>`
  * Remove a specified display setting.

### Frame control

* `f[rame]`
  * Show the current frame.
* `f[rame] <framenum>`
  * Specify a current frame. Evaluation are run on specified frame.
* `up`
  * Specify the upper frame.
* `down`
  * Specify the lower frame.

### Evaluate

* `p <expr>`
  * Evaluate like `p <expr>` on the current frame.
* `pp <expr>`
  * Evaluate like `pp <expr>` on the current frame.
* `eval <expr>`
  * Evaluate `<expr>` on the current frame.
* `irb`
  * Invoke `irb` on the current frame.

### Trace

* `trace`
  * Show available tracers list.
* `trace line`
  * Add a line tracer. It indicates line events.
* `trace call`
  * Add a call tracer. It indicate call/return events.
* `trace exception`
  * Add an exception tracer. It indicates raising exceptions.
* `trace object <expr>`
  * Add an object tracer. It indicates that an object by `<expr>` is passed as a parameter or a receiver on method call.
* `trace ... </pattern/>`
  * Indicates only matched events to `</pattern/>` (RegExp).
* `trace ... into: <file>`
  * Save trace information into: `<file>`.
* `trace off <num>`
  * Disable tracer specified by `<num>` (use `trace` command to check the numbers).
* `trace off [line|call|pass]`
  * Disable all tracers. If `<type>` is provided, disable specified type tracers.
* `record`
  * Show recording status.
* `record [on|off]`
  * Start/Stop recording.
* `step back`
  * Start replay. Step back with the last execution log.
  * `s[tep]` does stepping forward with the last log.
* `step reset`
  * Stop replay .

### Thread control

* `th[read]`
  * Show all threads.
* `th[read] <thnum>`
  * Switch thread specified by `<thnum>`.

### Configuration

* `config`
  * Show all configuration with description.
* `config <name>`
  * Show current configuration of <name>.
* `config set <name> <val>` or `config <name> = <val>`
  * Set <name> to <val>.
* `config append <name> <val>` or `config <name> << <val>`
  * Append `<val>` to `<name>` if it is an array.
* `config unset <name>`
  * Set <name> to default.
* `source <file>`
  * Evaluate lines in `<file>` as debug commands.
* `open`
  * open debuggee port on UNIX domain socket and wait for attaching.
  * Note that `open` command is EXPERIMENTAL.
* `open [<host>:]<port>`
  * open debuggee port on TCP/IP with given `[<host>:]<port>` and wait for attaching.
* `open vscode`
  * open debuggee port for VSCode and launch VSCode if available.
* `open chrome`
  * open debuggee port for Chrome and wait for attaching.

### Help

* `h[elp]`
  * Show help for all commands.
* `h[elp] <command>`
  * Show help for the given command.
(rdbg)
ruby/debug的替代品
你可以试试byebug gem,直接用一些 "print "语句进行调试。这也是非常有效的 !
