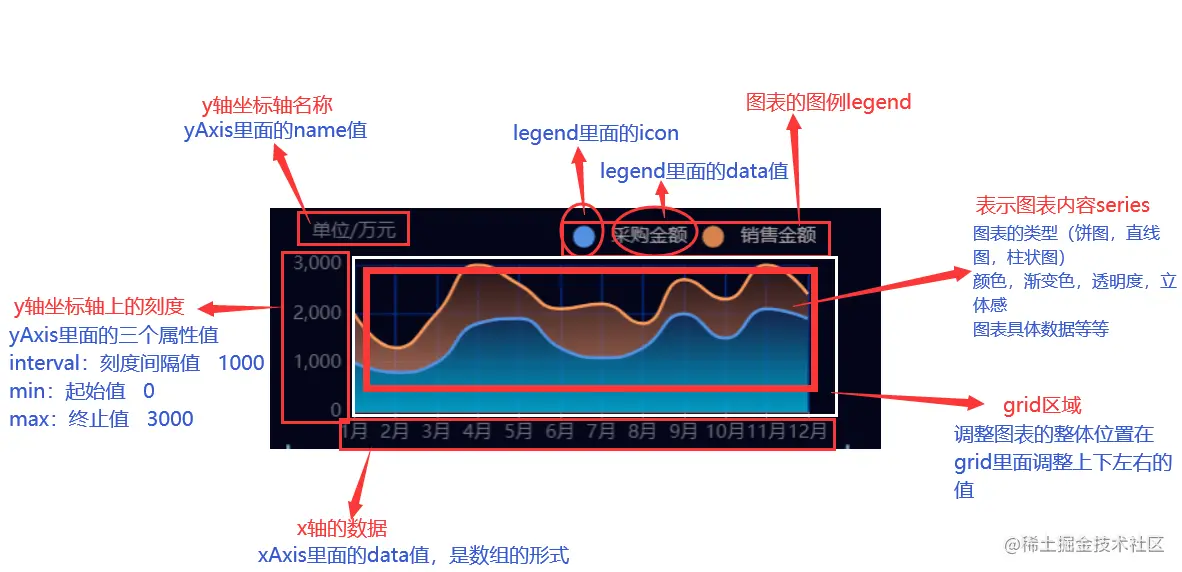
步骤
- 先准备一个div容器,设置props,接收传入进来的数据,比如说echarts图表的id、宽高、是否显示legend图列组件以及legend位置设置和选中状态、是否显示dataZoom缩放组件、是否显示工具栏组件,还可以传入配置属性设置name、单位、图标类型(type、line)、是否开启面积图、颜色等,notMerge是否跟之前设置的 option 进行合并
- 在methods里创建一个设置echars的函数,引入echarts组件或者在main.js中引入挂载到vue的原型上,配置一些基础的option,根据传入进来的值做不同的逻辑处理,通过init()方法对echarts实例初始化,在这里判断一下有实例就不创建了,否则浏览器控制台会有提示,最后用setOption方法设置图表实例的配置项以及数据
- 当容器大小改变时,去调用resize()函数,改变图表尺寸
- 监听传入进来的数据,数据发生变化重新调用这个echarts函数
- 在beforeDestroy中销毁echarts实例
- 这种使用率高的组件可以放在main.js中全局注册使用也可以在组件中单独使用,使用时把echarts需要的数据和配置都放在一个对象中传入封装好的组件就行了
引入使用
main.js全局引入
import Echart from '@/components/echarts/LineColumnEcharts'
import PieEcharts from '@/components/echarts/PieEcharts'
Vue.component('Echart', Echart)
<Echart
:echartsData="energyConsumptionEcharts.data"
:configurationList="energyConsumptionEcharts.configuration"
:echartsIdCard="energyConsumptionEcharts.id"
:axisLabel="axisLabel"
></Echart>
const energyConsumptionEcharts = {
configuration: [
{
name: '综合能耗(当量)',
yAxisUnit: '(Tce)',
min: 0,
max: 100,
type: 'bar',
label: {
show: true,
position: 'top',
color: '#333'
},
seriesColor: ['#5995CF', '#5F79CC ']
markLine: {
data: [{ yAxis: 7, name: 'Avg' }],
lineStyle: {
color: 'rgba(244, 178, 0, 1)'
}
},
barGap: 0,不同系列的柱间距离
areaStyle: true
stack:'all'
yAxisIndex:0,
},
{
yAxisIndex: 1,
}
],
id: 'energyConsumptionID',
data: {
data0: [默认y数据],
data1:[默认数据2]
xAxis: [默认x数据]
}
}
const axisLabel = {
interval: 0,
fontSize: 16,
fontWeight: 'bold',
formatter: function(value, index) {
const arr = value.split('')
let str = ''
arr.forEach((item, index) => {
if (item == '_') {
str += `\n-\n`
} else if (/[0-9a-zA-Z]/g.test(item)) {
str += item
} else {
str += index == 0 ? item : '\n' + item
}
})
return str
}
}
if (e.target.value == 0) {
this.$set(this.energyConsumptionEcharts.configuration[0], 'name', '综合能耗(当量)')
} else {
this.$set(this.energyConsumptionEcharts.configuration[0], 'name', '综合能耗(等价)')
}
that.$set(that.energyConsumptionEcharts.data, 'xAxis', res.result.result[0])
that.$set(that.energyConsumptionEcharts.data, 'data0', res.result.result[1])
传入多个图
传入多个柱状图
柱状图多个颜色
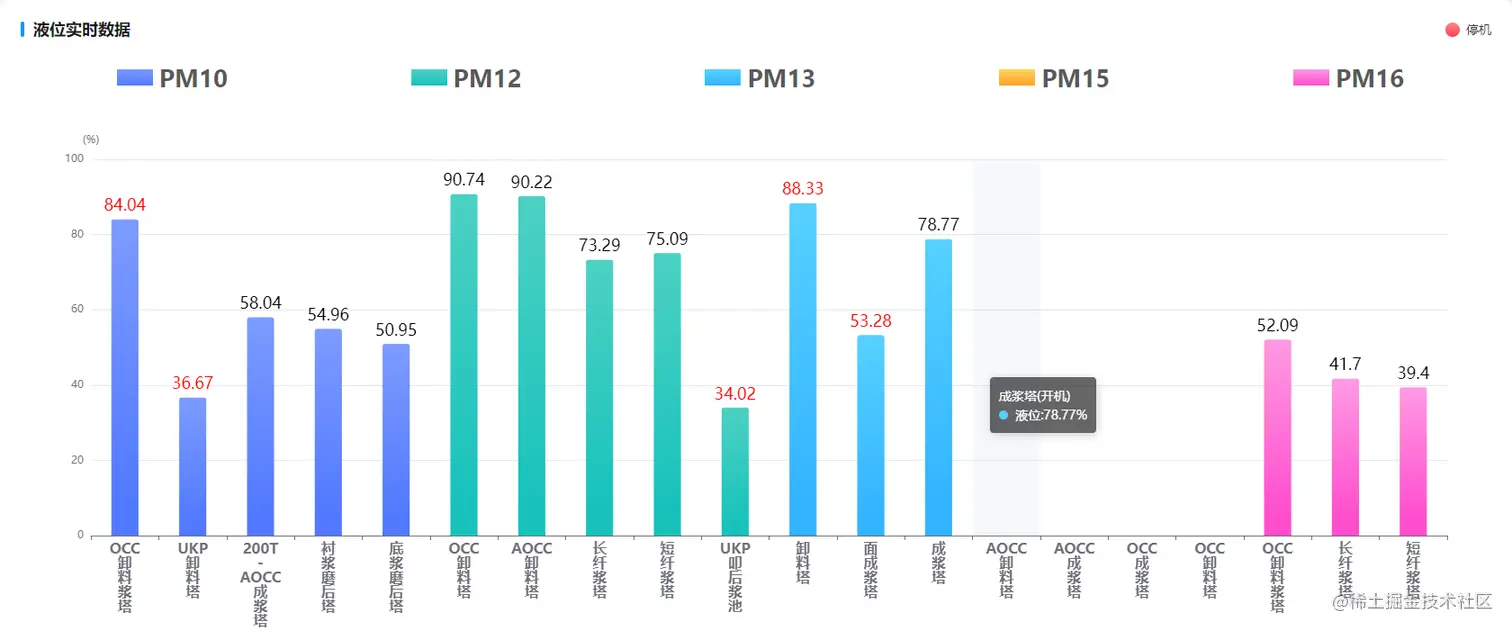
let echartsData=[
10,
{
"value": "75.09",
"label": {
"color": "rgb(255,0,0)",
"fontSize": "18px"
},
"itemStyle": {
"barBorderRadius": [
3,
3,
0,
0
],
"color": {
"colorStops": [
{
"offset": 0,
"color": "#7d9bff"
},
{
"offset": 0.9,
"color": "#5179ff"
}
],
"x": 0,
"y": 0,
"x2": 0,
"y2": 1,
"type": "linear",
"global": false
}
}
}
]
initRealTimeTableData() {
const that = this
selectLiquidByRealTime()
.then(res => {
const data = res.result.result[0]
console.log(data,'data');
let list = Array(data.deviceName.length)
console.log(list,'list');
list.fill('-')
console.log(list,'list2');
that.equipmentList = data.pmIds
data.pmIds.forEach((item, index) => {
list = that.setArrayColors(list, data.pmDevice[item], index, data.downDeviceValue)
})
that.realTimeEcharts.data.data0 = list
that.realTimeEcharts.data.xAxis = data.deviceName
})
.catch(err => {
console.log('initRealTimeTableData', err)
})
},
setArrayColors(arr1, arr2, index, arr3) {
const that = this
let echarts = require('echarts')
arr2.forEach((item, key) => {
if (item != '-') {
arr1.splice(key, 1, {
value: item,
label: {
color: arr3[key] == '-' ? '#000' : 'rgb(255,0,0)',
fontSize: '18px'
},
itemStyle: {
barBorderRadius: [3, 3, 0, 0],
color: new echarts.graphic.LinearGradient(0, 0, 0, 1, [
{
offset: 0,
color: that.colorList2[index]
},
{
offset: 0.9,
color: that.colorList[index]
}
])
}
})
}
})
return arr1
},
echarts.vue柱状图组件
<template>
<div :id="echartsIdCard" :style="{ width: echartsWidth, height: echartsHeight }"></div>
</template>
<script>
const yAxisStyle = {
type: 'value',
splitLine: {
lineStyle: {
type: 'solid',
},
show: true,
},
axisLine: {
lineStyle: {
},
},
axisLabel: {
show: true,
axisLine: {
lineStyle: {
},
},
textStyle: {
},
},
}
export default {
name: 'LineColumnEcharts',
data() {
return {
echarts: null,
barWidth: '',
value: {},
isStack: false,
dataActive: '',
}
},
props: {
echartsData: {
type: Object,
default: () => ({
data0: [],
xAxis: [],
}),
},
notMerge: {
type: Boolean,
default: false,
},
isTimeInterval: {
type: Boolean,
default: false,
},
isLegend: {
type: Boolean,
default: true,
},
legendLocation: {
type: Object,
default: () => ({
top: 'top',
left: 'center',
}),
},
grid: {
type: Object,
default: () => ({
left: '3%',
right: '3%',
bottom: '3%',
containLabel: true,
}),
},
legendSelected: {
type: Object,
},
isScale: {
type: Boolean,
default: false,
},
echartsWidth: {
type: String,
default: '100%',
},
echartsHeight: {
type: String,
default: '321px',
},
echartsIdCard: {
type: String,
default: 'echartsID',
},
axisTick: {
type: Boolean,
default: true,
},
axisLabel: {
type: Object,
default: () => ({
show: true,
}),
},
isToolShow: {
type: Boolean,
default: false,
},
tooltipBr: {
type: Boolean,
default: false,
},
dataZoom: {
type: Array,
{
{
},
configurationList: {
type: Array,
default: () => [
{
name: '用量',
yAxisUnit: '(kWh)',
type: 'line',
seriesColor: ['rgba(79, 140, 255, 1)'],
},
],
},
},
methods: {
createEcharts() {
const that = this
const option = {
tooltip: {
trigger: 'axis',
backgroundColor: 'rgba(0,0,0,.6)',
borderColor: 'rgba(0,0,0,.6)',
borderWidth: 0,
axisPointer: {
lineStyle: {
color: '#ccc',
},
},
formatter: that.tooltipTextFunction,
},
legend: {
data: [],
show: that.isLegend,
},
xAxis: [
{
type: 'category',
data: that.echartsData.xAxis,
axisPointer: {
type: that.setAxisPointerType(),
},
axisTick: {
show: this.axisTick,
},
},
],
yAxis: [],
toolbox: {
show: that.isToolShow,
feature: {
magicType: {
type: ['line', 'bar'],
iconStyle: {
borderColor: '#00DAFB',
},
},
restore: {
iconStyle: {
borderColor: '#00DAFB',
},
},
},
right: '15',
},
grid: {
left: '3%',
right: '3%',
bottom: '3%',
containLabel: true,
},
series: [],
}
option.grid = {
...this.grid,
}
option.xAxis[0].axisLabel = this.axisLabel
if (this.dataZoom) {
this.setDataZoom(option)
}
let selected = {
...this.legendSelected,
}
option.legend = {
...option.legend,
...this.legendLocation,
selected: selected,
}
let echarts = require('echarts')
let dom = document.getElementById(that.echartsIdCard)
let myEcharts = echarts.init(dom)
myEcharts.clear(option)
that.setOptionData(option, echarts)
that.$nextTick(function () {
document.addEventListener('webkitfullscreenchange', function (e) {
if (!document.fullscreenElement) {
myEcharts.resize()
}
})
})
setTimeout(function () {
myEcharts.setOption(option, {
notMerge: that.notMerge,
})
myEcharts.resize()
window.addEventListener('resize', function () {
myEcharts.resize()
})
}, 100)
},
setOptionData(option, echarts) {
const that = this
option.yAxis = that.setYAxisData()
that.configurationList.forEach((item, index) => {
option.legend.data.push(item.name)
if (item.hasOwnProperty('stack')) {
that.isStack = true
} else {
that.isStack = false
}
const obj = {
name: item.name,
type: item.type,
yAxisIndex: item.hasOwnProperty('yAxisIndex') ? item.yAxisIndex : 0,
data: that.echartsData[`data${index}`],
itemStyle: {
normal: {
barBorderRadius: that.isStack ? [0, 0, 0, 0] : [3, 3, 0, 0],
color: new echarts.graphic.LinearGradient(0, 0, 0, 1, that.getColorLists(item)),
},
},
}
this.setSeries(obj, item)
option.series.push(obj)
})
},
setSeries(obj, item) {
const that = this
if (item.hasOwnProperty('areaStyle')) {
if (item.areaStyle && item.type == 'line') {
obj.areaStyle = {}
}
}
if (item.hasOwnProperty('label')) {
obj.label = item.label
}
that.setMarkLine(obj, item)
that.setMarkPoint(obj, item)
if (item.hasOwnProperty('barWidth')) {
if (item.barWidth != 'auto') {
obj.barWidth = that.setBarWidth(item)
}
} else {
obj.barWidth = that.setBarWidth(item)
}
if (item.hasOwnProperty('stack')) {
obj.stack = item.stack
}
if (item.hasOwnProperty('barGap')) {
obj.barGap = item.barGap
}
},
setDataZoom(obj) {
if (!this.dataZoom.length) {
obj.dataZoom = [
{
type: 'inside',
},
{
type: 'slider',
},
]
} else {
obj.dataZoom = this.dataZoom
}
obj.grid.bottom = 50
},
setMarkLine(obj, item) {
if (item.hasOwnProperty('markLine')) {
obj.markLine = item.markLine
}
},
setMarkPoint(obj, item) {
const data = []
const label = {
color: '#fff',
fontSize: '12',
}
if (item.hasOwnProperty('markPoint')) {
if (item.markPoint instanceof Array) {
item.markPoint.forEach((item) => {
if (item == 'max') {
data.push({
type: 'max',
name: 'Max',
})
}
if (item == 'min') {
data.push({
type: 'min',
name: 'Min',
})
}
})
} else {
console.log('markPoint 类型错误')
}
obj.markPoint = {
data: data,
label: label,
}
}
},
setBarWidth(item) {
this.barWidth = ''
if (item.hasOwnProperty('barWidth')) {
this.barWidth = item.barWidth ? item.barWidth : '40%'
} else {
this.barWidth = '40%'
}
console.log(this.barWidth, ' this.barWidth ALL')
return this.barWidth
},
setYAxisData() {
const that = this
const y = []
const yIndex = [],
yUnit = []
that.configurationList.forEach((item, index) => {
if (item.hasOwnProperty('yAxisIndex')) {
if (!yIndex.length) {
yIndex.push(item.yAxisIndex)
yUnit.push(item.yAxisUnit)
} else {
yIndex.indexOf(item.yAxisIndex) != -1 || (yIndex.push(item.yAxisIndex) && yUnit.push(item.yAxisUnit))
}
} else if (item.hasOwnProperty('yAxisUnit')) {
if (!yIndex.length) {
yIndex.push(0)
yUnit.push(item.yAxisUnit)
}
}
})
if (this.isScale) {
yAxisStyle.scale = true
} else {
yAxisStyle.scale = false
}
yIndex.forEach((item, index) => {
const data = {}
if (that.configurationList[index].hasOwnProperty('min')) {
data.min = that.configurationList[index].min
}
if (that.configurationList[index].hasOwnProperty('max')) {
data.max = that.configurationList[index].max
}
y.push({
...yAxisStyle,
...data,
name: yUnit[index],
})
})
return y
},
getColorLists(item) {
const colorLists = [
{
offset: 0,
color: item.seriesColor[0],
},
{
offset: 0.4,
color: item.seriesColor[1],
},
{
offset: 1,
color: item.seriesColor[2],
},
]
const colorList = [
{
offset: 0,
color: item.seriesColor[0],
},
{
offset: 0.9,
color: item.seriesColor.length == 1 ? item.seriesColor[0] : item.seriesColor[1],
},
]
return item.seriesColor.length > 2 ? colorLists : colorList
},
setAxisPointerType() {
let isBar = false
this.configurationList.forEach((item, index) => {
if (item.type == 'bar') {
isBar = true
}
})
if (isBar) {
return 'shadow'
} else {
return 'line'
}
},
tooltipTextFunction(params, ticket, callback) {
const that = this
const divFirst = `<div style='color:#fff;font-family: PingFang SC;'>${params[0].axisValue}<br/>`
let divTemplate = ''
let tipBr = this.tooltipBr?tipBr='<br>':tipBr=''
if (!that.isTimeInterval) {
params.forEach((item, index) => {
divTemplate += `${item.marker} ${item.seriesName}:${
item.data instanceof Object ? item.data.value : item.data
}${tipBr}`
})
} else {
divTemplate += `${params[0].marker} ${params[0].seriesName}:${
params[0].value !== '-' ? params[0].data : params[1].value !== '-' ? params[1].value : params[2].value
}${that.configurationList[0].hasOwnProperty('yAxisUnit') ? that.configurationList[0].yAxisUnit : ''}<br>`
}
divTemplate = divFirst + divTemplate + '</div>'
return divTemplate
},
},
watch: {
echartsData: {
handler() {
this.$nextTick(() => {
this.createEcharts()
})
},
deep: true,
},
configurationList: {
handler() {
this.$nextTick(() => {
this.createEcharts()
})
},
deep: true,
},
isTimeInterval(newValue, oldValue) {
console.log('isTimeInterval', newValue, oldValue)
this.createEcharts()
},
},
computed: {},
created() {},
mounted() {
this.createEcharts()
},
beforeUpdate() {
this.createEcharts()
},
updated() {
this.createEcharts()
},
destroyed() {},
}
</script>
<style></style>
尖峰谷
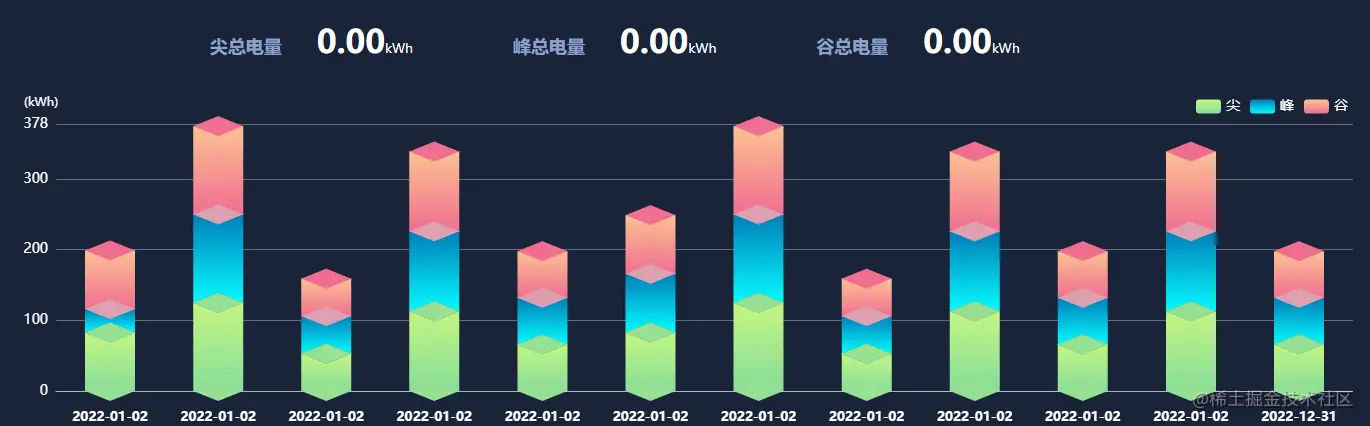
引入使用
  <JGF
    :xaxis="xaxis"
    :data1="data1"
    :data2="data2"
    :data4="data4"
    :width="100"
  ></JGF>
<template>
  <!-- 为 ECharts 准备一个具备大小(宽高)的 DOM -->
  <div id="chartLine" style="" class="line-wrap" :style="{ height: `${height}px`, width: `${width}%` }"></div>
</template>

<script>
import * as echarts from 'echarts'
// require('echarts/theme/shine');//引入主题

export default {
  props: {
    height: {
      type: String | Number,
      default: '400'
    },
    width: {
      type: String | Number,
      default: '100'
    },
    gridLeft: {
      type: String | Number,
      default: '10%'
    },
    gridRight: {
      type: String | Number,
      default: '15%'
    },
    color: {
      type: Array,
      default: () => ['#F8617B', '#6D82AD']
    },
    xaxis: {
      type: Array,
      default: () => [
        '2021-11-12 08:00:00',
        '2021-11-12 08:00:00',
        '2021-11-12 08:00:00',
        '2021-11-12 08:00:00',
        '2021-11-12 08:00:00',
        '2021-11-12 08:00:00',
        '2021-11-12 08:00:00',
        '2021-11-12 08:00:00',
        '2021-11-12 08:00:00',
        '2021-11-12 08:00:00',
        '2021-11-12 08:00:00',
        '2021-11-12 08:00:00'
      ]
    },

    data1: {
      type: Array,
      default: () => [40, 50, 30, 35, 55, 30, 20, 50, 50, 35, 55, 35]
    },
    data2: {
      type: Array,
      default: () => [20, 30, 60, 50, 66, 54, 60, 50, 50, 35, 55, 30]
    },
    data4: {
      type: Array,
      default: () => [3, 5, 3, 13, 6, 5, 10, 20, 10, 10, 5, 5]
    },
    data3: {
      type: Array,
      default: () => []
    },
    data5: {
      type: Array,
      default: () => []
    },
    data0: {
      type: Array,
      default: () => [1, 1, 1, 1, 1, 1, 1, 1, 1, 1, 1, 1]
    }
    // color: {
    //   type: Array,
    //   default: () => ['#F8617B', '#6D82AD'],
    // },
  },
  data() {
    return {
      chartLine: null,
      timer: null
    }
  },
  beforeDestroy() {
    console.log('destroyed')
    clearInterval(this.timer)
    this.timer = null
  },

  destroyed() {
    clearInterval(this.timer)
    this.timer = null
  },
  mounted() {
    // this.timer = setInterval(() => {
    this.$nextTick(() => {
      this.drawLineChart()
    })
    // }, 1000)
  },
  watch: {
    data1: {
      deep: true,
      handler: function() {
        this.drawLineChart()
      }
    }
  },
  methods: {
    drawLineChart() {
      // this.chartLine = echarts.init(this.$el, 'shine') // 基于准备好的dom,初始化echarts实例
      if (this.chartLine == null) {
        // 如果不存在,就进行初始化
        this.chartLine = echarts.init(this.$el, 'shine') // 基于准备好的dom,初始化echarts实例
      }

      var xData = ['2021-01','2021-02','2021-03','2021-04','2021-05','2021-06','2021-07','2021-08','2021-09','2021-10','2021-11','2021-12'      ]
      xData = this.xaxis

      // var data0 = []
      var data0 = [0, 0, 0, 0, 0, 0, 0, 0, 0, 0, 0, 0]
      // var data0 =[1, 1, 1, 1, 1, 1, 1, 1, 1, 1, 1, 1]
      var data1 = [400000, 50, 30, 35, 55, 30, 20, 50, 50, 35, 55, 35] //化肥
      var newdata1 = []
      this.data1.forEach(function(item, index) {
        // console.log(item,index);

        // for(var i=0;i<this.data1.length;i++){
        // if(item=='-'){
        //   data0[index]=0
        // }else{
        //   data0[index]=1
        // }
        // }
        newdata1.push(item * 1 !== item * 1 ? 0 : item * 1)
      })
      data1 = newdata1
      var data2 = [45, 35, 60, 50, 66, 54000, 60, 50, 50, 35, 55, 30] //农药
      var newdata2 = []
      this.data2.forEach(function(item, index) {
        // for(var i=0;i<this.data2.length;i++){
        // if(item!=='-'){
        //   data0[index]=1
        // }else{
        //   data0[index]=0
        // }
        // }
        newdata2.push(item * 1 !== item * 1 ? 0 : item * 1)
      })
      data2 = newdata2
      var data4 = [30, 50, 30000, 13, 6, 5, 10, 20, 10, 10, 5, 5] //农服
      var newdata4 = []
      this.data4.forEach(function(item, index) {
        // console.log('166',item,index);

        // for(var i=0;i<this.data4.length;i++){
        // if(item!=='-'){
        //   data0[index]=1
        // }else{
        //   data0[index]=0
        // }
        // }

        newdata4.push(item * 1 !== item * 1 ? 0 : item * 1)
      })
      data4 = newdata4
      var data3 = []
      var data5 = []
      for (let i = 0; i < data1.length; i++) {
        // console.log('图表',this.data1[i]);
        if (data1[i] == '-') {
          data1[i] = '0'
        } else if (data2[i] == '-') {
          data2[i] = '0'
        } else if (data4[i] == '-') {
          data4[i] = '0'
        }
        data3.push(data1[i] + data2[i] + data4[i])
      }
      for (let i = 0; i < data1.length; i++) {
        if (data1[i] == '-') {
          data1[i] = '0'
        } else if (data2[i] == '-') {
          data2[i] = '0'
        } else if (data4[i] == '-') {
          data4[i] = '0'
        }
        data5.push(data1[i] + data2[i])
      }
      let option = {
        backgroundColor: '#1a2439', //背景色
        tooltip: {
          trigger: 'axis',
          borderColor: 'rgba(255,255,255,.3)',
          backgroundColor: 'rgba(13,5,30,.6)',
          textStyle: {
            color: 'white' //设置文字颜色
          },
          borderWidth: 1,
          padding: 5,
          formatter: function(parms) {
            // console.log(parms,parms[0].axisValue.length)
            var strofdate = ''
            if (parms[0].axisValue.length == 4) {
              strofdate = '年份'
            }
            if (parms[0].axisValue.length == 6) {
              strofdate = '月份'
            }

            if (parms[0].value == 0) {
              parms[0].value = '-'
            }
            if (parms[1].value == 0) {
              parms[1].value = '-'
            }
            if (parms[2].value == 0) {
              parms[2].value = '-'
            }
            var str =
              strofdate +
              '' +
              parms[0].axisValue +
              '</br>' +
              parms[0].marker +
              '尖:' +
              parms[0].value +
              '</br>' +
              parms[1].marker +
              '峰:' +
              parms[1].value +
              '</br>' +
              parms[2].marker +
              '谷:' +
              parms[2].value
            return str
          }
        },
        textStyle: {
          color: '#C9C9C9'
        },
        // color: ["#7BA9FA", "#7BA9FA", "#DE9FB1", "#DE9FB1","yellow","yellow"],
        color: ['#96e092', '#018bc1', '#96e092', '#DE9FB1', '#f06e90', '#f89e92'],

        legend: {
          type: 'scroll',
          orient: 'horizontal',
          selectedMode: true, //图例点击失效
          right: '0',
          top: '30px',

          textStyle: {
            color: '#ffffff',
            fontSize: 14
          }
          // data: datas.legendData,
        },
        dataZoom: [
          {
            type: 'slider',
            show: false,
            startValue: 0,
            endValue: 23,
            height: '15',
            bottom: '3%'
            // zoomLock: true,
          }
        ],
        // dataZoom: [
        //   {
        //     type: 'inside',
        //     height: 12,
        //     show: false,
        //   },
        //   {
        //     type: 'slider',
        //     height: 12,
        //     show: this.dataZoomShow,
        //   },
        // ],
        // right: '1.5%',
        grid: {
          containLabel: true,
          left: '1%',
          // top: '7%',
          bottom: '10%',
          right: '0'
        },
        xAxis: {
          type: 'category',
          data: xData,
          axisLine: {
            show: true,
            lineStyle: {
              color: '#B5B5B5'
            }
          },
          axisTick: {
            show: false
          },
          axisLabel: {
            margin: 20, //刻度标签与轴线之间的距离。
            textStyle: {
              fontFamily: 'Microsoft YaHei',
              color: '#FFF'
            },
            fontSize: 13,
            fontStyle: 'bold'
          }
        },
        yAxis: {
          name: '(kWh)',
          nameTextStyle: {
            color: 'white',
            padding: [0, 0, 0, -30] // 四个数字分别为上右下左与原位置距离
          },

          type: 'value',
          scale: true,
          // max: function (value) {
          //   return value
          // },
          // max:20,
          max: function(value) {
            // return (value.max + value.max * 0.1).toFixed(0)
            return parseInt(value.max + 3.5)
          },
          axisLine: {
            show: false,
            lineStyle: {
              color: '#B5B5B5'
            }
          },
          splitLine: {
            show: true,
            lineStyle: {
              // 使用深浅的间隔色
              color: ['#B5B5B5'],
              type: 'solid',
              opacity: 0.5
            }
          },
          axisLabel: {
            textStyle: {
              fontFamily: 'Microsoft YaHei',
              color: '#FFF'
            },
            fontSize: 14
          }
        },
        series: [
          {
            type: 'bar',
            name: '尖',
            type: 'bar',
            // stack: 'zs',
            data: data1,
            stack: 'zs',
            barMaxWidth: 'auto',
            barWidth: 50,
            itemStyle: {
              color: {
                x: 0,
                y: 0,
                x2: 0,
                y2: 1,
                type: 'linear',
                global: false,
                colorStops: [
                  {
                    offset: 0,
                    color: '#c4f580'
                  },
                  {
                    offset: 1,
                    color: '#86dd9b'
                  }
                ]
              }
            }
          },
          {
            name: '峰',
            type: 'bar',
            data: data2,
            stack: 'zs',
            type: 'bar',
            barMaxWidth: 'auto',
            barWidth: 50,
            itemStyle: {
              color: {
                x: 0,
                y: 0,
                x2: 0,
                y2: 1,
                type: 'linear',
                global: false,
                colorStops: [
                  {
                    offset: 0,
                    color: '#017ebb'
                  },
                  {
                    offset: 1,
                    color: '#06fbfe'
                  }
                ]
              }
            }
          },
          {
            name: '谷',
            type: 'bar',
            data: data4,
            stack: 'zs',
            type: 'bar',
            barMaxWidth: 'auto',
            barWidth: 50,
            itemStyle: {
              color: {
                x: 0,
                y: 0,
                x2: 0,
                y2: 1,
                type: 'linear',
                global: false,
                colorStops: [
                  {
                    offset: 0,
                    color: '#fbc292'
                  },
                  {
                    offset: 1,
                    color: '#f06e91'
                  }
                ]
              }
            }
          },
//设置那个隔片
          {
            data: data0,
            show: false,
            type: 'pictorialBar',
            barMaxWidth: '20',
            symbol: 'diamond',
            symbolOffset: [0, '50%'],
            symbolSize: [50, 20],
            zlevel: 2
          },

          {
            data: data1,
            type: 'pictorialBar',
            barMaxWidth: '20',
            symbolPosition: 'end',
            symbol: 'diamond',
            symbolOffset: [0, '-50%'],
            symbolSize: [50, 20],
            zlevel: 2
          },

          {
            data: data1,
            type: 'pictorialBar',
            barMaxWidth: '20',
            symbolPosition: 'end',
            symbol: 'diamond',
            symbolOffset: [0, '-50%'],
            symbolSize: [50, 20],
            zlevel: 2
          },
          {
            data: data5,
            type: 'pictorialBar',
            barMaxWidth: '20',
            symbolPosition: 'end',
            symbol: 'diamond',
            symbolOffset: [0, '-50%'],
            symbolSize: [50, 20],
            zlevel: 2
          },
          {
            data: data3,
            type: 'pictorialBar',
            barMaxWidth: '20',
            symbolPosition: 'end',
            symbol: 'diamond',
            symbolOffset: [0, '-50%'],
            symbolSize: [50, 20],
            zlevel: 2
          }
        ]
      }
      // 使用刚指定的配置项和数据显示图表

      this.chartLine.setOption(option)
    }
  }
}
</script>

<style lang="less" scope>
.line-wrap {
  width: 50%;
}
.a {
}
</style>
多个饼图
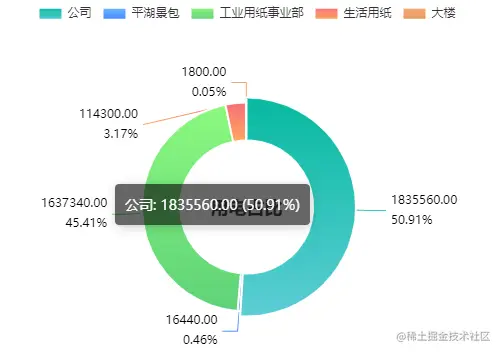
引入使用
<PieEcharts
        :title="pieTitle"
        :echartsData="pieEchartsData"
        :legendLocation="legendLocation"
        style="margin-top: 35px;">
</PieEcharts>
//饼图配置
const legendLocation = {
  left: 'center',
  top: '1%'
}
//饼图数据
const pieEchartsData = [
  {
    name: '公司', //一级菜单
    value: '1835560.00'
  },
  {
    name: '平湖景包', //一级菜单
    value: '-'
  },
  {
    name: '工业用纸事业部', //一级菜单
    value: '-'
  },
  {
    name: '生活用纸', //一级菜单
    value: '-'
  },
  {
    name: '大楼', //一级菜单
    value: '-'
  }
]
echarts饼图组件
<template>
<div :id="echartsIdCard" ref="lineColumnEchartsID" :style="{ width: echartsWidth, height: echartsHeight }" class="bg">
<slot name="body"></slot>
</div>
</template>
<script>
export default {
name: 'PieEcharts',
data() {
return {}
},
props: {
echartsData: {
type: Array,
default: () => [
{
name: '景包公司',
value: 10,
},
{
name: '工业用纸事业部',
value: 10,
},
],
},
title: {
type: String,
default: '',
},
colors: {
type: Array,
default: () => [
{
c1: '#5ccdd5',
c2: '#07baa0',
},
{
c1: '#4082FE',
c2: '#71BFFD',
},
{
c1: '#5ed178',
c2: '#8cf97f',
},
{
c1: '#feab5e',
c2: '#f96c79',
},
{
c1: '#E79861',
c2: '#F5AA76',
},
{
c1: '#8099FC',
c2: '#5385F6',
},
],
},
legendLocation: {
type: Object,
default: () => ({
x: '35%',
y: '4%',
}),
},
echartsWidth: {
type: String,
default: '100%',
},
echartsHeight: {
type: String,
default: '380px',
},
echartsIdCard: {
type: String,
default: 'NightingaleChartID',
},
isToolShow: {
type: Boolean,
default: false,
},
},
methods: {
createEcharts() {
const that = this
const echarts = require('echarts')
const option = {
backgroundColor: '#fff',
color: 'red',
tooltip: {
trigger: 'item',
backgroundColor: 'rgba(0,0,0,.6)',
borderColor: 'rgba(0,0,0,.6)',
borderWidth: 0,
textStyle: {
color: '#fff',
},
formatter: '{b}: {c} ({d}%)',
},
title: [
{
text: this.title,
top: '52%',
left: 'center',
textStyle: {
rich: {
name: {
fontSize: 14,
fontWeight: 'normal',
color: '#666666',
padding: [10, 0],
},
val: {
fontSize: 24,
fontWeight: '400',
color: '#333333',
},
},
},
},
],
legend: {
orient: 'horizontal',
icon: 'rect',
x: '35%',
y: '4%',
itemWidth: 24,
itemHeight: 12,
align: 'left',
textStyle: {
rich: {
name: {
fontSize: 12,
},
value: {
fontSize: 14,
padding: [0, 5, 0, 15],
},
unit: {
fontSize: 12,
},
},
},
},
series: [
{
type: 'pie',
radius: ['35%', '55%'],
center: ['50%', '55%'],
data: that.echartsData,
hoverAnimation: true,
itemStyle: {
normal: {
borderColor: '#fff',
borderWidth: 2,
color: (params) => {
return {
type: 'linear',
x: 0,
y: 0,
x2: 0,
y2: 1,
colorStops: [
{
offset: 0,
color: that.colors[params.dataIndex].c2,
},
{
offset: 1,
color: that.colors[params.dataIndex].c1,
},
],
global: false,
}
},
},
},
labelLine: {
normal: {
length: 20,
lineStyle: {
width: 1,
},
},
},
label: {
normal: {
formatter: '{c}\n{d}%',
color: 'black',
lineHeight: '20',
rich: {
icon: {
fontSize: 16,
color: 'auto',
},
name: {
fontSize: 14,
padding: [0, 10, 0, 4],
color: '#666666',
},
},
},
},
},
],
}
option.legend = {
...option.legend,
...this.legendLocation,
}
let dom = document.getElementById(that.echartsIdCard)
let myEcharts = echarts.init(dom)
setTimeout(function () {
myEcharts.setOption(option)
myEcharts.resize()
window.addEventListener('resize', function () {
myEcharts.resize()
})
}, 100)
},
setInSideColor(echarts) {
let colorOne, colorTwo
if (typeof this.colors.inSide == 'string') {
colorOne = this.colors.inSide ? this.colors.inSide : '#3398ff'
colorTwo = this.colors.inSide ? this.colors.inSide : '#7db0fd'
} else if (this.colors.inSide instanceof Array) {
colorOne = this.colors.inSide[0]
colorTwo = this.colors.inSide.length > 1 ? this.colors.inSide[1] : this.colors.inSide[0]
} else {
colorOne = '#3398ff'
colorTwo = '#7db0fd'
}
return new echarts.graphic.LinearGradient(0, 0, 0, 1, [
{
offset: 0,
color: colorOne,
},
{
offset: 1,
color: colorTwo,
},
])
},
},
watch: {
echartsData: {
handler() {
this.$nextTick(() => {
this.createEcharts()
})
},
deep: true,
},
configurationList: {
handler() {
this.$nextTick(() => {
this.createEcharts()
})
},
deep: true,
},
},
computed: {},
created() {},
mounted() {
this.createEcharts()
},
beforeUpdate() {
this.createEcharts()
},
updated() {
this.createEcharts()
},
destroyed() {},
}
</script>
<style scoped>
.bg {
position: relative;
}
</style>
单个饼图
引入使用
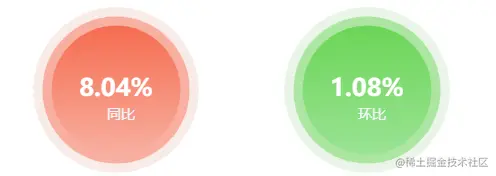
<ScheduleEcharts
  echartsIdCard="yoyID"
  :colors="powerUtilizationAnalysis.yoy < 0 ? yoyColors : lrrColors"
  :echartsData="yoyEchartsData"
></ScheduleEcharts>

lrrEchartsData: {
    name: '环比',
    value: 10
  },
  yoyEchartsData: {
    name: '同比',
    value: 10
  },
echarts单个饼图组件
<template>
<div :id="echartsIdCard" ref="lineColumnEchartsID" :style="{ width: echartsWidth, height: echartsHeight }"></div>
</template>
<script>
export default {
name: 'scheduleEcharts',
data() {
return {}
},
props: {
echartsData: {
type: Object,
default: () => ({ name: '同比', value: 10 }),
},
colors: {
type: Object,
default: () => ({ inSide: '', outSide: '', middleSide: '' }),
},
echartsWidth: {
type: String,
default: '100%',
},
echartsHeight: {
type: String,
default: '184px',
},
echartsIdCard: {
type: String,
default: 'NightingaleChartID',
},
isToolShow: {
type: Boolean,
default: false,
},
},
methods: {
createEcharts() {
const that = this
const echarts = require('echarts')
const option = {
backgroundColor: '#FFFFFF',
title: {
show: true,
text: that.echartsData.name,
x: '50%',
y: '57%',
z: 10,
textAlign: 'center',
textStyle: {
color: '#f1f7fe',
fontSize: 14,
fontWeight: 'normal',
},
},
series: [
{
type: 'pie',
radius: ['0', '70%'],
center: ['50%', '50%'],
z: 8,
hoverAnimation: false,
data: [
{
name: that.echartsData.name,
value: that.echartsData.value,
itemStyle: {
normal: {
color: that.setInSideColor(echarts),
},
},
label: {
normal: {
formatter: function (params) {
return params.value + '%'
},
color: '#FFFFFF',
fontSize: 24,
fontWeight: 'bold',
position: 'center',
show: true,
},
},
labelLine: {
show: false,
},
},
],
},
{
type: 'pie',
radius: '80%',
startAngle: 220,
endAngle: -40,
hoverAnimation: false,
center: ['50%', '50%'],
avoidLabelOverlap: false,
label: {
show: false,
},
labelLine: {
show: false,
},
data: [
{
value: 1,
itemStyle: {
normal: {
color:that.colors.middleSide?that.colors.middleSide:'#8DC4FD'
},
},
},
],
},
{
type: 'pie',
radius: '90%',
center: ['50%', '50%'],
avoidLabelOverlap: false,
z: 0,
hoverAnimation: false,
label: {
show: false,
},
labelLine: {
show: false,
},
data: [
{
value: 1,
itemStyle: {
normal: {
color: that.colors.outSide?that.colors.outSide:'#e3edf8',
},
},
},
],
},
],
}
let dom = document.getElementById(that.echartsIdCard)
let myEcharts = echarts.init(dom)
setTimeout(function () {
myEcharts.setOption(option)
myEcharts.resize()
window.addEventListener('resize', function () {
myEcharts.resize()
})
}, 100)
},
setInSideColor(echarts) {
let colorOne, colorTwo
if (typeof this.colors.inSide == 'string') {
colorOne = this.colors.inSide?this.colors.inSide:'#3398ff'
colorTwo = this.colors.inSide?this.colors.inSide:'#7db0fd'
} else if (this.colors.inSide instanceof Array) {
colorOne = this.colors.inSide[0]
colorTwo = this.colors.inSide.length > 1 ? this.colors.inSide[1] : this.colors.inSide[0]
} else {
colorOne = '#3398ff'
colorTwo = '#7db0fd'
}
return new echarts.graphic.LinearGradient(0, 0, 0, 1, [
{
offset: 0,
color: colorOne,
},
{
offset: 1,
color: colorTwo,
},
])
},
},
watch: {
echartsData: {
handler() {
this.$nextTick(() => {
this.createEcharts()
})
},
deep: true,
},
configurationList: {
handler() {
this.$nextTick(() => {
this.createEcharts()
})
},
deep: true,
},
},
computed: {},
created() {},
mounted() {
this.createEcharts()
},
beforeUpdate() {
this.createEcharts()
},
updated() {
this.createEcharts()
},
destroyed() {},
}
</script>
<style>
</style>
仪表盘
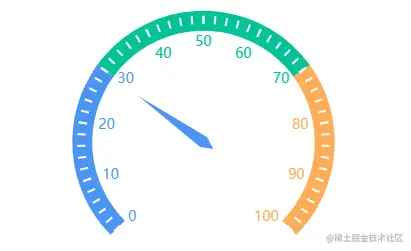
引入使用
<GaugeEcharts :echartsData="{ value: data }" />//传入一个数据

data: { value: 580, name: 'Email' },
echarts仪表盘组件
<template>
<div :id="echartsIdCard" ref="gaugeEchartsID" :style="{ width: echartsWidth, height: echartsHeight }" class="bg">
<slot name="body"></slot>
</div>
</template>
<script>
export default {
name: 'GaugeEcharts',
data() {
return {}
},
props: {
echartsData: {
value: 0,
},
colors: {
type: Array,
default: () => [
{
c1: '#5ccdd5',
c2: '#07baa0',
},
{
c1: '#4082FE',
c2: '#71BFFD',
},
{
c1: '#5ed178',
c2: '#8cf97f',
},
{
c1: '#feab5e',
c2: '#f96c79',
},
{
c1: '#E79861',
c2: '#F5AA76',
},
{
c1: '#8099FC',
c2: '#5385F6',
},
],
},
echartsWidth: {
type: String,
default: '100%',
},
echartsHeight: {
type: String,
default: '350px',
},
echartsIdCard: {
type: String,
default: 'NightingaleChartID',
},
},
methods: {
createEcharts() {
const that = this
const echarts = require('echarts')
const option = {
series: [
{
type: 'gauge',
axisLine: {
lineStyle: {
width: 20,
color: [
[0.3, '#4B95F3'],
[0.7, '#05C397'],
[1, '#FDAD59'],
],
},
},
pointer: {
itemStyle: {
color: 'auto',
},
},
axisTick: {
distance: -15,
length: 8,
lineStyle: {
color: '#fff',
width: 2,
},
},
splitLine: {
distance: -30,
length: 30,
lineStyle: {
color: '#000',
width: 0,
},
},
axisLabel: {
color: 'auto',
distance: 25,
fontSize: 14,
},
detail: {
show: false,
valueAnimation: true,
formatter: '{value} km/h',
color: 'auto',
},
data: [
{
value: this.echartsData.value,
},
],
},
],
}
let dom = document.getElementById(that.echartsIdCard)
let myEcharts = echarts.init(dom)
setTimeout(function () {
myEcharts.setOption(option)
myEcharts.resize()
window.addEventListener('resize', function () {
myEcharts.resize()
})
}, 100)
},
setInSideColor(echarts) {
let colorOne, colorTwo
if (typeof this.colors.inSide == 'string') {
colorOne = this.colors.inSide ? this.colors.inSide : '#3398ff'
colorTwo = this.colors.inSide ? this.colors.inSide : '#7db0fd'
} else if (this.colors.inSide instanceof Array) {
colorOne = this.colors.inSide[0]
colorTwo = this.colors.inSide.length > 1 ? this.colors.inSide[1] : this.colors.inSide[0]
} else {
colorOne = '#3398ff'
colorTwo = '#7db0fd'
}
return new echarts.graphic.LinearGradient(0, 0, 0, 1, [
{
offset: 0,
color: colorOne,
},
{
offset: 1,
color: colorTwo,
},
])
},
},
watch: {
echartsData: {
handler() {
this.$nextTick(() => {
this.createEcharts()
})
},
deep: true,
},
},
mounted() {
this.createEcharts()
},
beforeUpdate() {
this.createEcharts()
},
updated() {
this.createEcharts()
},
}
</script>
<style scoped>
.bg {
position: relative;
}
</style>


