在这篇文章中,我们通过一个数字例子和样本实现,探讨了随机森林的袋外误差,以绘制袋外误差。
目录:
- 随机森林简介
- 随机森林中的袋外误差
- 袋外误差的例子
- 袋外误差的代码
随机森林简介
随机森林是使用自举聚合的机器学习算法之一。随机森林聚合了几个决策树的结果。众所周知,当决策树的深度较小时,它们工作得很好,否则就会过度拟合。当它们在随机森林中被集合使用时,决策树的这一弱点得到了缓解。
随机森林的工作方式是对数据的小子集进行随机抽样,并对其进行决策树分类。然后,随机森林的预测是决策树的单个预测的组合,可以通过求和或采取多数票或任何其他合适的手段来组合结果。
训练数据的随机子集(带替换)的抽样被称为 "打包"。我们的想法是,在选择反馈给每个决策树的数据时的随机性将减少随机森林模型预测的方差。
随机森林的袋外误差
袋外误差是指使用在各自引导样本中不包含该数据点的树的预测结果计算的每个预测结果的平均误差。这样一来,随机森林模型在训练时就不断得到验证。让我们考虑在样本数据的子集上拟合的第j棵决策树(DT_j\)。对于不在 \(DT_j\)样本子集中的每个训练观察或样本(z_i = (x_i , y_i)\),其中 \(x_i\)是特征集, \(y_i\)是目标,我们用 \(DT_j\)来预测 \(x_i\)的结果 \(o_i\)。
因此,袋外误差是所有决策树中这个误差的平均值。
袋外误差的例子
下面是一个简单的例子,说明这在实践中是如何运作的。考虑这个玩具数据集,它记录了在温度和湿度下是否下雨。
| S/N | 温度 | 湿度 | 下雨了吗? |
|---|---|---|---|
| 1 | 33 | 高 | 没有 |
| 2 | 18 | 低 | 无 |
| 3 | 27 | 低 | 有 |
| 4 | 20 | 高 | 是 |
| 5 | 21 | 低 | 不适用 |
| 6 | 29 | 低 | 有 |
| 7 | 19 | 高 | 是 |
假设要在数据集上训练一个由5棵决策树(DT_1 ... DT_5\)组成的随机森林集合。每棵树都将在数据集的一个随机子集上进行训练。假设对于 \(DT_1\)来说,随机选择的子集包含数据集的前五个样本。因此,最后两个样本6和7将是袋外样本,在此基础上,将对DT_1\)进行验证。继续假设,让下表表示每棵决策树对其每个袋外样本的预测情况。
| 树 | 样本S/N | 预测值 | 实际 | 误差(abs) |
|---|---|---|---|---|
| DT1 | 6 | 没有 | 有 | 1 |
| DT1 | 7 | 没有 | 是 | 1 |
| 2.DT2 | 2 | 没有 | 无 | 0 |
| DT3 | 1 | 没有 | 没有 | 0 |
| DT3 | 2 | 有 | 不适用 | 1 |
| DT3 | 4 | 是 | 是 | 0 |
| DT4 | 2 | 是 | 不适用 | 1 |
| DT4 | 7 | 是 | 是 | 1 |
| DT5 | 3 | 是 | 是 | 0 |
| DT5 | 5 | 没有 | 没有 | 0 |
因此,我们可以看到,由于只有合集中的决策树的一个子集被用于确定用于计算袋外得分的每一个错误,所以它不能被认为像验证数据上的验证得分那样准确。然而,在这种情况下,数据集相当小,不可能留出验证集,袋外误差可以被证明是一个有用的指标。
袋外误差的代码
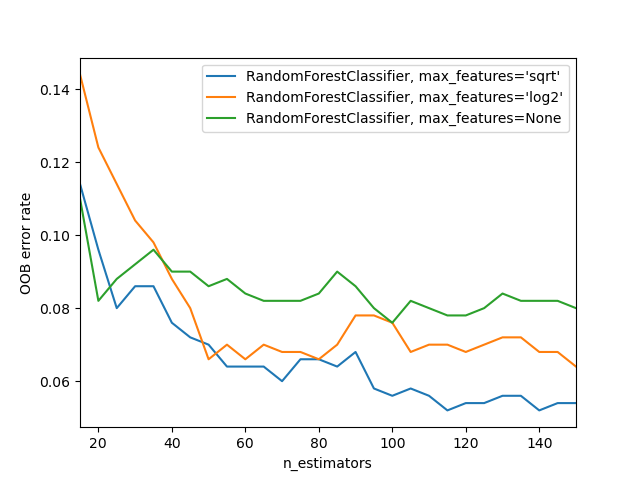
最后,我们演示了在scikit-learn库中为随机森林模型的n_estimators的选择估计一个合适的值时使用袋外误差。这个例子改编自文档。袋外误差是在训练期间增加每棵新树时测量的。结果显示,在这个例子中,n_estimators选择115是分类器的最佳值(带有'sqrt' max_features):
import matplotlib.pyplot as plt

from collections import OrderedDict
from sklearn.datasets import make_classification
from sklearn.ensemble import RandomForestClassifier

RANDOM_STATE = 123

# Generate a binary classification dataset.
X, y = make_classification(
    n_samples=500,
    n_features=25,
    n_clusters_per_class=1,
    n_informative=15,
    random_state=RANDOM_STATE,
)

# NOTE: Setting the `warm_start` construction parameter to `True` disables
# support for parallelized ensembles but is necessary for tracking the OOB
# error trajectory during training.
ensemble_clfs = [
    (
        "RandomForestClassifier, max_features='sqrt'",
        RandomForestClassifier(
            warm_start=True,
            oob_score=True,
            max_features="sqrt",
            random_state=RANDOM_STATE,
        ),
    ),
    (
        "RandomForestClassifier, max_features='log2'",
        RandomForestClassifier(
            warm_start=True,
            max_features="log2",
            oob_score=True,
            random_state=RANDOM_STATE,
        ),
    ),
    (
        "RandomForestClassifier, max_features=None",
        RandomForestClassifier(
            warm_start=True,
            max_features=None,
            oob_score=True,
            random_state=RANDOM_STATE,
        ),
    ),
]

# Map a classifier name to a list of (<n_estimators>, <error rate>) pairs.
error_rate = OrderedDict((label, []) for label, _ in ensemble_clfs)

# Range of `n_estimators` values to explore.
min_estimators = 15
max_estimators = 150

for label, clf in ensemble_clfs:
    for i in range(min_estimators, max_estimators + 1, 5):
        clf.set_params(n_estimators=i)
        clf.fit(X, y)

        # Record the OOB error for each `n_estimators=i` setting.
        oob_error = 1 - clf.oob_score_
        error_rate[label].append((i, oob_error))

# Generate the "OOB error rate" vs. "n_estimators" plot.
for label, clf_err in error_rate.items():
    xs, ys = zip(*clf_err)
    plt.plot(xs, ys, label=label)

plt.xlim(min_estimators, max_estimators)
plt.xlabel("n_estimators")
plt.ylabel("OOB error rate")
plt.legend(loc="upper right")
plt.show()