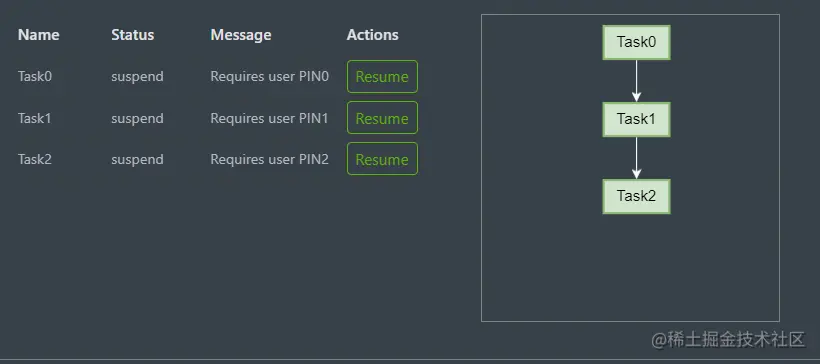
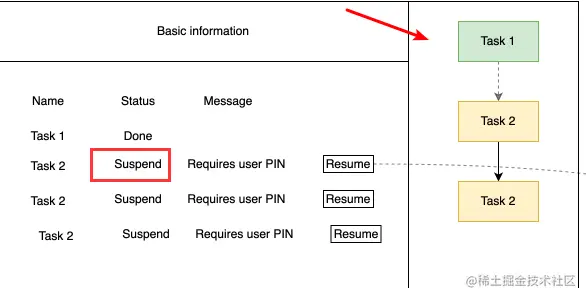
任务需求,需要完成通过表格内的name任务栏数量生成对应的简易可以拖拽的任务流程图
生成一个html文件代码如下
<div #container class="container"></div>
逻辑文件代码如下components.ts文件里的代码
import { Component, ElementRef, Input, OnChanges, OnInit, SimpleChanges, ViewChild } from '@angular/core';
import { Edge, Graph, Node } from '@antv/x6';
import { WorkflowListTaskProcess } from '@app/interfaces/product/workflow-list';
@Component({
selector: 'app-process-chart',
templateUrl: './process-chart.component.html',
styleUrls: ['./process-chart.component.less']
})
export class ProcessChartComponent implements OnInit, OnChanges {
@Input() data: WorkflowListTaskProcess[] = []
@ViewChild('container') container!: ElementRef;
graph!: Graph;
graphBasicConfig = {
panning: true,
selecting: false,
autoResize: true,
mousewheel: {
enabled: false,
},
async: true,
scaling: {
min: 0.5,
},
};
edgeAttrs = {
line: {
strokeWidth: 1,
stroke: '#fff',
targetMarker: {
name: 'classic',
size: 7,
},
},
};
nodeWidth = 60
nodeHeight = 30
nodes: Node.Metadata[] = [];
edges: Edge.Metadata[] = [];
ngOnChanges(changes: SimpleChanges): void {
setTimeout(() => {
this.refreshChart()
}, 100)
}
ngOnInit(): void {
this.initGraph()
}
refreshChart() {
if (this.graph) {
this.graph.dispose()
}
this.initGraph()
this.initChart()
}
initGraph(): void {
if (!this.container) {
return
}
const width = this.container.nativeElement.offsetWidth;
const height = this.container.nativeElement.offsetHeight;
const graphConfig = {
width,
height,
...this.graphBasicConfig,
scroller: {
enabled: false,
pannable: true,
pageVisible: false,
pageBreak: false,
padding: 10,
autoResize: true
},
container: this.container.nativeElement,
};
console.log('graphConfig', graphConfig);
this.graph = new Graph(graphConfig);
}
initChart(): void {
this.nodes = []
this.edges = []
this.data.forEach(((item, index) => {
this.nodes.push({
id: item.name,
x: 110,
y: 10 + (this.nodeHeight + 40) * index,
width: this.nodeWidth,
height: this.nodeHeight,
zIndex: 1,
label: item.name,
attrs: {
body: {
fill: "#d0e4ce",
stroke: "#89b771"
},
label: {
fill: '#000'
},
},
})
if (index === 0) {
return
}
const lastNode = this.data[index - 1]
this.edges.push({
source: lastNode.name,
target: item.name,
attrs: this.edgeAttrs,
})
}))
console.log('initChart', this.nodes)
this.graph.addNodes(this.nodes)
this.graph.addEdges(this.edges)
}
}
搭配定义的ts类型,单度定义的ts文件
上面导入的 WorkflowListTaskProcess
export interface WorkflowListTaskProcess {
    id: string;
    name: string;
    status:string;
    message:string
}
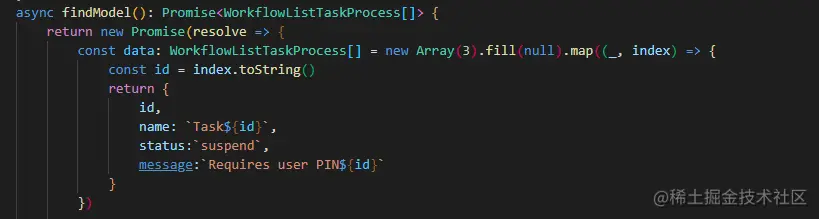
完成-->效果如下: