需求如下:
配置项
import * as echarts from 'echarts';
var chartDom = document.getElementById('main');
var myChart = echarts.init(chartDom);
var option;
setTimeout(function () {
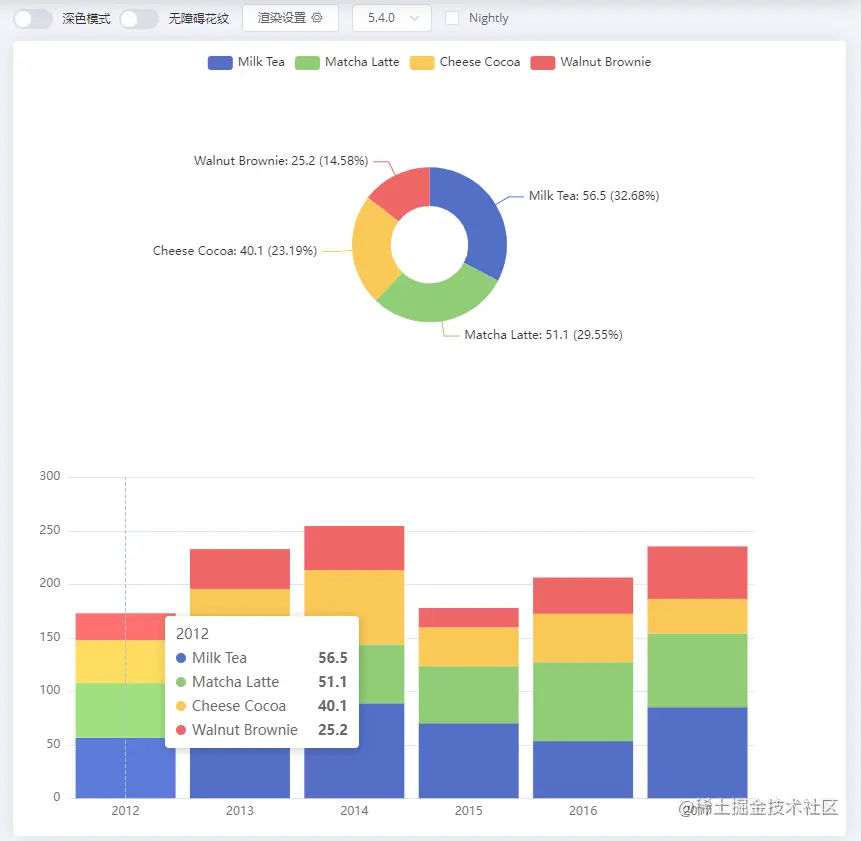
option = {
legend: {},
tooltip: {
trigger: 'axis',
showContent: true
},
dataset: {
source: [
['product', '2012', '2013', '2014', '2015', '2016', '2017'],
['Milk Tea', 56.5, 82.1, 88.7, 70.1, 53.4, 85.1],
['Matcha Latte', 51.1, 51.4, 55.1, 53.3, 73.8, 68.7],
['Cheese Cocoa', 40.1, 62.2, 69.5, 36.4, 45.2, 32.5],
['Walnut Brownie', 25.2, 37.1, 41.2, 18, 33.9, 49.1]
]
},
xAxis: {
type: 'category',
axisLine: {
show: false
},
axisTick: {
show: false
}
},
yAxis: {
gridIndex: 0,
axisLine: {
show: false
},
axisTick: {
show: false
}
},
grid: [
{ bottom: '1%', top: '55%', left: '2%', containLabel: true },
{ top: '55%', left: '5%', right: '5%', containLabel: true }
],
series: [
{
name: 'Milk Tea',
type: 'bar',
stack: 'Emission',
barWidth: 100,
label: {
},
seriesLayoutBy: 'row'
},
{
name: 'Matcha Latte',
type: 'bar',
stack: 'Emission',
barWidth: 100,
label: {
},
seriesLayoutBy: 'row'
},
{
name: 'Cheese Cocoa',
type: 'bar',
stack: 'Emission',
barWidth: 100,
label: {
},
seriesLayoutBy: 'row'
},
{
name: 'Walnut Brownie',
type: 'bar',
stack: 'Emission',
barWidth: 100,
label: {
},
seriesLayoutBy: 'row'
},
{
type: 'pie',
id: 'pie',
radius: ['10%', '20%'],
center: ['50%', '25%'],
label: {
formatter: '{b}: {@2012} ({d}%)'
},
encode: {
itemName: 'product',
value: '2012',
tooltip: '2012'
}
}
]
};
myChart.on('updateAxisPointer', function (event) {
const xAxisInfo = event.axesInfo[0];
if (xAxisInfo) {
const dimension = xAxisInfo.value + 1;
myChart.setOption({
series: {
id: 'pie',
label: {
formatter: '{b}: {@[' + dimension + ']} ({d}%)'
},
encode: {
value: dimension,
tooltip: dimension
}
}
});
}
});
myChart.setOption(option);
});
option && myChart.setOption(option);


