本文已参与「新人创作礼」活动,一起开启掘金创作之路。
获取更多资讯,赶快关注公众号(名称:智能制造与智能调度,公众号:deeprlscheduler)吧!
果蝇优化算法(Fruit Fly Optimization Algorithm,FOA)
2011年台湾亚东技术学院的潘文超受果蝇觅食行为的启发,提出了一种的全局优化算法—果蝇优化算法(Fruit Fly Optimization Algorithm,FOA)。该算法的优点在于计算过程简单、易于编码实现和易于理解等。==关注公众号,后台回复“果蝇”或“FOA”获取Matlab源码!==
启发
果蝇本身在感觉和感知方面优于其他物种,尤其是在嗅觉和视觉方面,如图1所示。
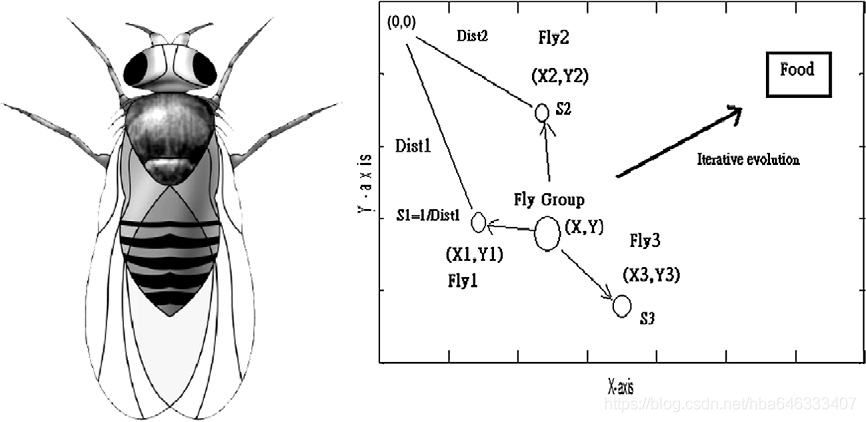
果蝇的嗅觉器官能发现空气中漂浮的各种气味;它甚至能闻到40公里外的食物。然后,当它接近食物位置,也可以用它灵敏的视觉找到食物和同伴聚集的位置,并朝那个方向飞行。
初始化
首先随机初始化果蝇种群位置InitX_axis和InitY_axis。
食物搜索
通过嗅觉给出果蝇寻找食物的随机方向和距离:
计算味道浓度判定值
由于无法得知食物位置,因此先估计与原点的距离,再计算味道浓度判定值,此值为距离倒数:
适应度评估
将味道浓度判定值。代入味道浓度判定函数(或称为适应度函数fitness function),用来求出果蝇个体位置的味道浓度:
确定最优个体
找出该果蝇群体中味道浓度最低的果蝇(最优个体);
飞行
记录并保留最佳味道浓度值bestSmell与其x、y坐标,此时果蝇群体利用视觉向该位置飞去:
循环
重复执行食物搜索、计算味道浓度判定值、应度评估、定最优个体,并判断最佳味道浓度是否优于前一迭代最佳味道浓度。若当前迭代次数小于最大迭代数Maxgen,则执行飞行。
Matlab代码
FOA求极大值
%***設置參數
%清空運行環境
clc
clear
%速度更新參數
X_axis=10*rand();
Y_axis=10*rand();
maxgen=100; %疊代次數
sizepop=20; %種群規模
%個體和速度最大和最小值
for i=1:sizepop
X(i)=X_axis+2*rand()-1;
Y(i)=Y_axis+2*rand()-1;
D(i)=(X(i)^2+Y(i)^2)^0.5;
S(i)=1/D(i);
%類似Fitness適應度函數
Smell(i)=2-S(i)^2;
end
%***根據初始味道濃度值尋找極值
[bestSmell bestindex]=max(Smell);
%***保留最佳值位置
X_axis=X(bestindex);
Y_axis=Y(bestindex);
Smellbest=bestSmell;
%***根據公式更新粒子位置和速度,並且根據新粒子的適應度值更新個體極值和群體極值
%疊代尋優
for g=1:maxgen
%粒子位置和速度更新
for i=1:sizepop
X(i)=X_axis+2*rand()-1;
Y(i)=Y_axis+2*rand()-1;
D(i)=(X(i)^2+Y(i)^2)^0.5;
S(i)=1/D(i);
%類似Fitness適應度函數
Smell(i)=2-S(i)^2;
end
%***根據初始味道濃度值尋找極值
[bestSmell bestindex]=max(Smell);
%***保留最佳值位置
if bestSmell>Smellbest
X_axis=X(bestindex);
Y_axis=Y(bestindex);
Smellbest=bestSmell;
end
%每代最優值紀錄到yy數組中
yy(g)=Smellbest;
Xbest(g)=X_axis;
Ybest(g)=Y_axis;
end
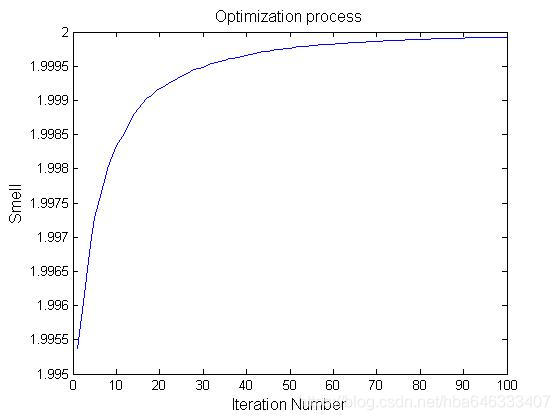
%***繪製最佳化個體適應度值趨勢圖
figure(1)
plot(yy)
title('Optimization process','fontsize',12)
xlabel('Iteration Number','fontsize',12);ylabel('Smell','fontsize',12);
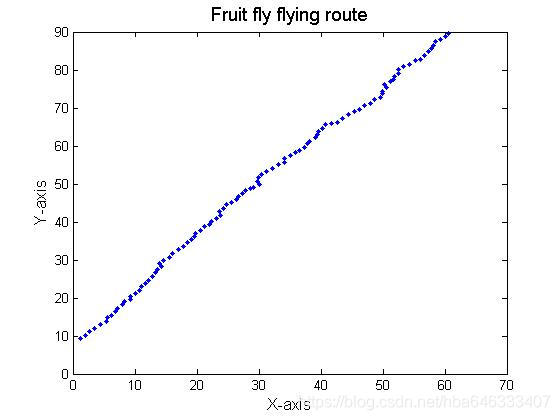
figure(2)
plot(Xbest,Ybest,'b.');
title('Fruit fly flying route','fontsize',14)
xlabel('X-axis','fontsize',12);ylabel('Y-axis','fontsize',12);
结果如下:
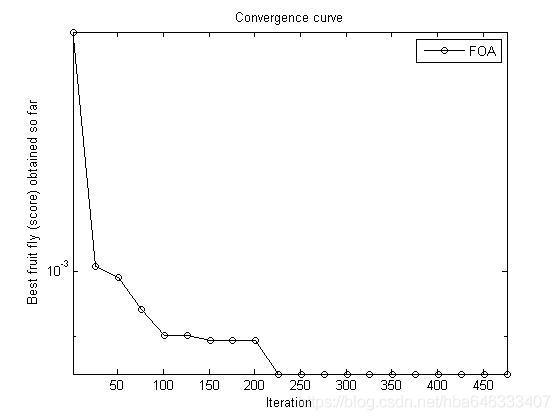
FOA求最小值
上述代码仅能用于测试一个二维函数,失去了通用性。下面提供了一个不同的版本,可能更容易使用和改进,且可以扩展到不同维度。
% Fruit Fly Optimization Algorithm,FOA.

% The standard verison programmed by Prof.Pan is a simplifed version which
% is used to test a very easy function.In my opinion,in order to enhance
% the FOA application field,it is necessary to change it into a general
% version,which may be simple for students and scholars to use.

% Programmed and code by Stephen Zhao from Shanghai University of Engineering Science(China)
% Email:zhaoqihui8193@yundaex.com
% If you have any questions concerning this program,please contact me.

% You might cite this article like this:Wen-Tsao Pan (2011)
% A new fruit fly optimization algorithm: Taking the financial distress
% model as an example, Knowledge-Based Systems, Vol.26, pp.69-74, 2012,
% DOI information: 10.1016/j.knosys.2011.07.001.
function [Smellbest,X,Y] = FOA(n,maxt,lb,ub,dim)

% Parameters setting
if nargin < 1
    n = 20; % Population size
    maxt = 5e2; % Max iterations
    dim = 30; % Dimension of test function
    lb = -100 * ones(1,dim); % Lower bound of test function
    ub = 100 * ones(1,dim); % Upper bound of test function
end


% X = zeros(1 * dim);
% Y = zeros(1 * dim);
% new_X = zeros(1 * dim);
% new_Y = zeros(1 * dim);
% D = zeros(1 * dim);
% Sol = zeros(1 * dim);
% Fitness = zeros(n * 1);

% Initialize the original position
for i = 1:n
    X(i,:) = lb+(ub-lb).*rand(1,dim); % the position of X axis
    Y(i,:) = lb+(ub-lb).*rand(1,dim); % the position of Y axis
    D(i,:) = (X(i,:).^2 + Y(i,:).^2).^0.5; % Caculate the distance
    Sol(i,:) = 1./D(i,:); % the solution set
    Fitness(i) = fun(Sol(i,:)); % Caculate the fitness
end


[bestSmell,index] = min(Fitness); % Get the min fitness and its index
new_X = X(index,:); % the X axis of min fitness
new_Y = Y(index,:); % the Y axis of min fitness
Smellbest = bestSmell;
best = Sol(index,:);

% Start main loop
for t = 1:maxt
    for i = 1:n
        % Refer to the process of initializing
        X(i,:) = new_X + (ub - lb).*rand(1,dim);
        Y(i,:) = new_Y + (ub - lb).*rand(1,dim);
        D(i,:) = (X(i,:).^2 + Y(i,:).^2).^0.5;
        Sol(i,:) = 1./D(i,:);
        Fitness(i) = fun(Sol(i,:));
    end
    [bestSmell,index] = min(Fitness);
    % If the new value is smaller than the best value,update the best value
    if (bestSmell < Smellbest)
        X(i,:) = X(index,:);
        Y(i,:) = Y(index,:);
        Smellbest = bestSmell;
    end

    % Out put result each 100 iterations
    if round(t/100) == (t/100)
        Smellbest;
    end

    cg_curve(t) = Smellbest;
end

% Output/display
disp(['Number of evaluations: ',num2str(maxt)]);
disp(['Best solution=',num2str(best),'   fmin=',num2str(Smellbest)]);

% Draw the picture
semilogy((1:25:maxt),cg_curve(1:25:maxt),'k-o','markersize',5);
title('Convergence curve')
xlabel('Iteration');
ylabel('Best fruit fly (score) obtained so far');

hold on
axis tight
grid off
box on
legend('FOA')

% This is a classcial test function,namely Sphere function,which range is
% from -100 to 100.The dimension can be defined as you want.
function z = fun(u)
z = sum(u.^2);
结果如下: