

本周,Twitter将其单条推文的字符限制从140个提高到280个,据说是基于Twitter工程博客上发表的关于推文长度的有趣分析。该分析的要点是这样的。英语推文的字符数大致呈对数正态分布,但在接近140个字符的限制时,其分布会出现峰值。
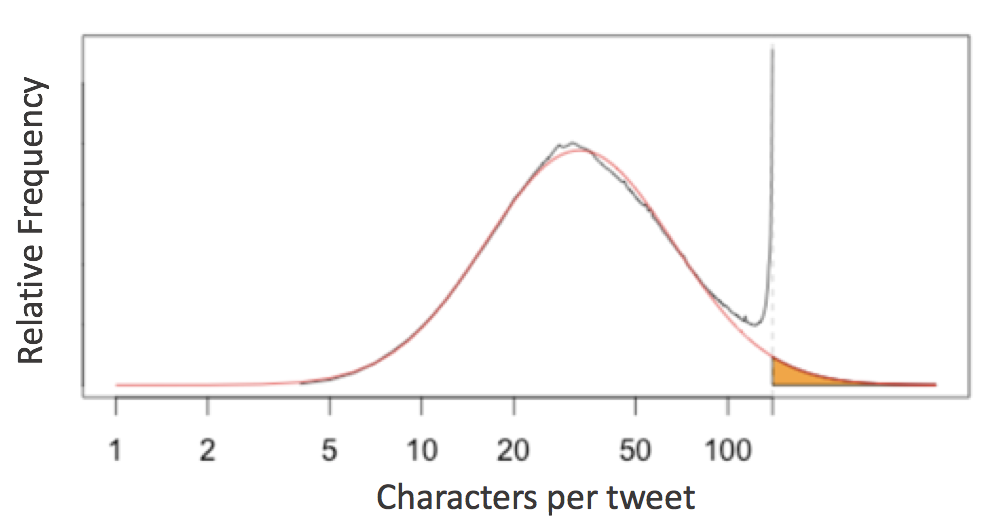
该分析认为,这证明了twitter用户经常将他们较长的想法 "塞进 "140个字符的限制中,并建议280个字符的限制会更自然地适应人们期望的推文长度的分布。
这立刻让人想到许多Python程序员在日常生活中面临的另一个字符限制:Python的PEP8风格指南建议的79个字符的行限制。
将所有行限制在最多79个字符。
我开始想,流行的Python软件包(如NumPy、SciPy、Pandas、Scikit-Learn、Matplotlib、AstroPy)是否显示出类似于在推文长度分布中看到的东西。
剧透一下:它们是这样的分布的细节揭示了写这些文章的社区的编程习惯和风格惯例的一些情况。
在NumPy中计算行数
要看一看这个问题,我们首先需要一种方法来访问任何Python包中的所有原始代码行。在一个标准的系统结构中,如果你已经安装了一个包,那么你的系统中已经储存了Python源代码。例如,我系统中的numpy 源代码就存储在这里。
In [1]:
import numpy
numpy.__path__
Out[1]:
['/Users/jakevdp/anaconda/lib/python3.6/site-packages/numpy']
考虑到这一点,我们可以使用os.walk 函数来编写一个快速生成器函数,它将遍历给定软件包中的所有Python代码行。
In [2]:
# Python 3.X
import os

def iter_lines(module):
    """Iterate over all lines of Python in module"""
    for root, dirs, files in os.walk(module.__path__[0]):
        for filename in files:
            if filename.endswith('.py'):
                with open(os.path.join(root, filename)) as f:
                    yield from f
这将返回一个按顺序遍历所有行的生成器表达式;让我们看看NumPy包含多少行Python代码。
In [3]:
lines = iter_lines(numpy)
len(list(lines))
输出[3]。
179615
鉴于此,我们可以找到所有行的长度,并绘制一个直方图。
In [4]:
%matplotlib inline
import matplotlib.pyplot as plt
import numpy as np

plt.style.use('seaborn-whitegrid')
在[5]中。
lengths = [len(line) for line in iter_lines(numpy)]
plt.hist(lengths, bins=np.arange(max(lengths)), histtype='step', linewidth=1);
分布图中,长度为1的线条(即只包含一个换行符)占主导地位:让我们继续前进,并删除这些线条,同时缩小x的限制。
在[6]中。
lengths = [len(line) for line in iter_lines(numpy) if len(line) > 1]
plt.hist(lengths, bins=np.arange(125), histtype='step', linewidth=1);
现在这看起来很有趣了!
清理分布
让我眼前一亮的第一个特征是0到20个字符之间的巨大峰值。为了探索这些,让我们看一下构成最大峰值的线条。
In [7]:
np.argmax(np.bincount(lengths))
Out[7]:
13
我们可以用一个列表理解法来提取所有长度为13的行。
In [8]:
lines13 = [line for line in iter_lines(numpy) if len(line) == 13]
len(lines13)
Out[8]:
3637
在NumPy中有3637个长度为13个字符的行。探索一下这些短行中有多少是相同的,这很有意思。Pandasvalue_counts 函数在这方面很有用。
In[9]:
import pandas as pd
pd.value_counts(lines13).head(10)
Out[9]。
    --------\n    1349
    Examples\n     646
    See Also\n     645
        try:\n     218
        pass\n      62
    See also\n      59
    return c\n      38
    return a\n      22
        None\n      20
    finally:\n      19
dtype: int64
很明显,这些重复的东西有很多只是模板代码或文档标准,碰巧经常通过软件包出现;我们也许可以通过Python的set 集合,只绘制唯一线条长度的直方图,来清理我们的直方图。
在[10]中。
lengths = [len(line) for line in set(iter_lines(numpy))]
plt.hist(lengths, bins=np.arange(125), histtype='step', linewidth=1);
这是个更干净的分布!
软件包之间的比较
为了帮助软件包之间的比较,让我们快速地将上面的直方图代码重构为一个我们可以重新使用的函数。此外,我们将在PEP8的最大字符数处添加一条垂直线。
在[11]。
def hist_linelengths(module, ax):
    """Plot a histogram of lengths of unique lines in the given module"""
    lengths = [len(line.rstrip('\n')) for line in set(iter_lines(module))]
    h = ax.hist(lengths, bins=np.arange(125) + 0.5, histtype='step', linewidth=1.5)
    ax.axvline(x=79.5, linestyle=':', color='black')
    ax.set(title="{0} {1}".format(module.__name__, module.__version__),
           xlim=(1, 100),
           ylim=(0, None),
           xlabel='characters in line',
           ylabel='number of lines')
    return h
现在我们可以用这个函数来比较一些著名的科学Python包的分布情况。
在[12]中。
import numpy, scipy, matplotlib, pandas, sklearn, astropy
modules = [numpy, scipy, pandas, matplotlib, sklearn, astropy]

fig, ax = plt.subplots(2, 3, figsize=(14, 6), sharex=True)
fig.subplots_adjust(hspace=0.2, wspace=0.2)

for axi, module in zip(ax.flat, modules):
    hist_linelengths(module, ax=axi)

for axi in ax[0]:
    axi.set_xlabel('')
for axi in ax[:, 1:].flat:
    axi.set_ylabel('')
这里的结果相当有趣:与Twitter的推文长度分析类似,我们看到每一个软件包的字符分布都有些平滑,在79个字符的PEP8限制处或附近有一个 "凸起"!在这里,我们可以看到,在PEP8限制处,有些软件包的字符数比PEP8多。此外,很明显,一些软件包(即matplotlib、sklearn,特别是pandas)似乎对这个限制相当严格,而其他软件包(numpy、scipy、astropy)则更宽松一些。
但是有一个包很突出:matplotlib在几个中间行长处显示了一些明显的峰值;让我们看看这些。
In[13]:
lines = set(iter_lines(matplotlib))
counts = np.bincount([len(line) for line in lines])
np.argmax(counts)
Out[13]:
29
这个大的峰值反映了大约2200个正好有29个字符的行;打印所有这些行并检查它们是很有趣的。
In [14]:
[line for line in lines if len(line) == 29][:10]
Out[14]:
[' pick(mouseevent)\n', " if aspect == 'auto':\n", ' for a in alias_list:\n', " 'violet red': '#a50055',\n", ' cache_dir = None\n', " rc('image', cmap='gray')\n", " 'uni2270' : 8816,\n", ' x0t -= delta\n', ' if lolims.any():\n', " 'expanded' : 700,\n"]
我们看到很多行似乎都在定义一些以 "uni "开头的键的字典。
In [15]:
[line for line in lines if 'uni203' in line]
Out[15]:
["    'uni2035'        : 8245,\n",
 "    'uni203E'        : 8254,\n",
 "    'uni2033'        : 8243,\n",
 "    'uni2031'        : 8241,\n",
 "    'uni2037'        : 8247,\n",
 "    'uni203B'        : 8251,\n",
 "    'uni2034'        : 8244,\n",
 "    'uni2032'        : 8242,\n",
 "    'uni203C'        : 8252,\n",
 "    'uni2036'        : 8246,\n",
 "    'uni2038'        : 8248,\n"]
这被证明是一些自动生成的代码,将unicode字符串映射为数字。matplotlib中的其他峰值也是由于类似的人工制品造成的。
在行长为70的情况下,还有一个小的下降;我没有研究过这个问题,但我怀疑这可能是matplotlib的创建者在软件包早期使用的代码风格的遗留物。
建立线长分布模型
在Twitter的字符分析之后,让我们看看我们是否可以用对数正态分布来拟合每个字符数的行数。作为提醒,对数正态可以像这样进行参数化。
LogNorm(x; \\mu, \\sigma) = \\frac{1}{x \\sigma \\sqrt{2\\pi}}.\\exp\\left(-frac{\[\\log(x)- \\mu\]^2}{2\\sigma^2}right)
这里是计数的数量,是分布的峰值的中位数,控制分布的宽度。我们可以用scipy中的lognorm 分布来实现。
在[16]中。
from scipy import stats

def lognorm_model(x, amplitude, mu, sigma):
    return amplitude * stats.lognorm.pdf(x, scale=np.exp(mu), s=sigma)

x = np.linspace(0, 100, 1000)
plt.plot(x, lognorm_model(x, 1000, 3.5, 0.7));
对于我们的数据集的左边部分来说,这似乎是一个合适的形状;让我们试着优化参数以适应长度不超过50的线的计数。
在[17]中。
from scipy import optimize

counts, bins, _ = hist_linelengths(numpy, ax=plt.axes())
lengths = 0.5 * (bins[:-1] + bins[1:])

def minfunc(theta, lengths, counts):
    return np.sum((counts - lognorm_model(lengths, *theta)) ** 2)

opt = optimize.minimize(minfunc, x0=[10000, 4, 1],
                        args=(lengths[:50], counts[:50]),
                        method='Nelder-Mead')
print("optimal parameters:", opt.x)

plt.fill_between(lengths, lognorm_model(lengths, *opt.x), alpha=0.3, color='gray');
optimal parameters: [ 9.92126791e+04 3.75476977e+00 5.19760726e-01]
似乎是一个合理的拟合!由此,你可以认为(就像Twitter工程团队所做的那样),如果不是因为人为地强加了PEP8的最大线长,线长可能 "自然 "地遵循对数正态分布。
为了方便起见,让我们创建一个函数,为任何给定的模块绘制这种对数正态拟合。
在[18]中。
def lognorm_model(x, theta):
    amp, mu, sigma = theta
    return amp * stats.lognorm.pdf(x, scale=np.exp(mu), s=sigma)

def minfunc(theta, lengths, freqs):
    return np.sum((freqs - lognorm_model(lengths, theta)) ** 2)

def lognorm_mode(amp, mu, sigma):
    return np.exp(mu - sigma ** 2)

def lognorm_std(amp, mu, sigma):
    var = (np.exp(sigma ** 2) - 1) * np.exp(2 * mu + sigma ** 2)
    return np.sqrt(var)
在[19]中。
def hist_linelengths_with_fit(module, ax, indices=slice(50)):
    counts, bins, _ = hist_linelengths(module, ax)
    lengths = 0.5 * (bins[:-1] + bins[1:])
    opt = optimize.minimize(minfunc, x0=[1E5, 4, 0.5],
                            args=(lengths[indices], counts[indices]),
                            method='Nelder-Mead')
    model_counts = lognorm_model(lengths, opt.x)
    ax.fill_between(lengths, model_counts, alpha=0.3, color='gray')

    # Add text describing mu and sigma

    A, mu, sigma = opt.x
    mode = np.exp(mu - sigma ** 2)
    ax.text(0.22, 0.15, 'mode = {0:.1f}'.format(lognorm_mode(*opt.x)),
            transform=ax.transAxes, size=14)
    ax.text(0.22, 0.05, 'stdev = {0:.1f}'.format(lognorm_std(*opt.x)),
            transform=ax.transAxes, size=14)

    return opt.x
现在我们可以比较每个包的模型了。
在[20]中。
modules = [numpy, scipy, pandas, matplotlib, sklearn, astropy]

fig, ax = plt.subplots(2, 3, figsize=(14, 6), sharex=True)
fig.subplots_adjust(hspace=0.2, wspace=0.2)

fits = {}

for axi, module in zip(ax.flat, modules):
    fits[module.__name__] = hist_linelengths_with_fit(module, ax=axi)


for axi in ax[0]:
    axi.set_xlabel('')
for axi in ax[:, 1:].flat:
    axi.set_ylabel('')
将这些汇总统计作为描述每个包的 "本质 "的方式也很有趣,以便直接比较。
在[21]中。
ha = {'sklearn': 'right', 'scipy': 'right', 'pandas': 'right'}
va = {'sklearn': 'top'}
for name, fit in sorted(fits.items()):
    mode = lognorm_mode(*fit)
    std = lognorm_std(*fit)
    plt.plot(mode, std, 'ok')
    plt.text(mode, std, ' ' + name + ' ', size=14,
             ha=ha.get(name, 'left'), va=va.get(name, 'bottom'))
plt.xlabel('mode of model', size=14)
plt.ylabel('std. deviation of model', size=14);
plt.xlim(30, 41);
讨论¶:
我发现,对数正态分布同时适合推文和代码行,这一点很奇怪。做了一些调查,我发现了一些关于互联网上信息长度主题的文献。这项研究发现,在不同的语言和媒介中,评论的长度相当接近对数正态分布。他们提出了一个与韦伯-费希纳定律有关的机制,该定律表明感知程度有一个对数刻度。看来,代码行的长度对同样的机制作出反应是合理的。
至于数据,我认为这揭示了每个项目对PEP8行长度的承诺,非常有趣。Pandas、Scikit-Learn和Matplotlib似乎强烈要求将它们的行数保持在79个字符以下;相比之下,AstroPy似乎并不介意偶尔的长行(尽管用Twitter团队的分析术语来说,它仍然显示出一种 "塞满 "的模式)。
比较软件包之间的汇总统计,有趣的是注意到numpy和scipy软件包在行长分布方面的相对相似性。这很有意义,因为历史上这两个包的开发团队有很强的重叠。
相比之下,scikit-learn往往每行多出10个字符左右,而且典型的行长分布更广。我怀疑这些行的长度是由于scikit-learn代码的性质决定的:它有相对较长的类名(例如RandomForestClassifier ),这些类名在整个代码中被频繁使用。类的盛行也给软件包的大部分内容增加了4个空格的缩进。至于更大的标准差,这可能是由于更大的贡献者群体:scikit-learn的贡献者总数大约是numpy或scipy的两倍。
Pandas的有趣之处在于,它没有表现出其他软件包中明显的 "挤 "的效果。长行似乎以一种更分散的方式被分割开来,也许是通过分配临时变量而不是通过换行。
每个软件包在代码行的长度方面都显示出明显的 "指纹",以上的可视化数据表明,PEP8的限制确实影响了人们编写代码的方式,尤其是在每行使用更多字符的软件包中,如Pandas和Scikit-Learn。
请记住,所有这些都是基于几个相当强大的假设。
- 除了PEP8,行长的 "自然 "分布是对数正态的。
- 我们可以从少于50个字符的行的频率进行有意义的推断,找到描述这种 "自然 "对数正态分布的统计数据。
我们可以效仿Twitter工程团队的做法,用这种分析来论证PEP8的行长限制应该取消,这样就不会限制人们对每个分布的高端的 "自然 "倾向。但我认为,无论是PEP8还是Twitter的字符限制,都可以提出很好的论据,认为这种解释过于急切。
撇开这些争议不谈,对这种分析进行更深入的研究会很有趣。我可以想出几个有趣的问题,你可以问。
- 其他Python软件包在模式/分布图上的位置如何?
- 这些包的编码风格,反映在行长上,是否随着时间的推移而演变?
- 个人贡献者是如何表现的?他们在不同的包中是否有类似的习惯?
- 对于用其他语言编写的代码,这些分布情况是怎样的?
所有这些都是有趣的问题,但我已经花了足够多的字来讨论。我将把这些问题留给另一个时间,或者另一个人。谢谢你的阅读!
