from matplotlib import pyplot as plt
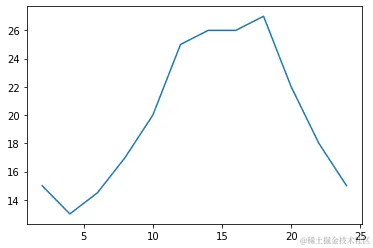
x = range(2,26,2)
y = [15,13,14.5,17,20,25,26,26,27,22,18,15]
plt.figure(figsize=(20,8),dpi=80)
plt.plot(x,y)
_xtick_labels = [i/2 for i in range(4,49)]
plt.xticks(range(25,50))
plt.yticks(range(min(y),max(y)+1))
plt.show()

import matplotlib.pyplot as plt


x = range(2,26,2)
y = [15,13,14.5,17,20,25,26,26,27,22,18,15]

plt.plot(x,y)
plt.savefig("./sig_size.png")
fig = plt.figure(figsize=(20, 8),dpi=80)
plt.show()
<Figure size 1600x640 with 0 Axes>
import matplotlib.pyplot as plt
fig = plt.figure(figsize=(10,5))
x = range(2,26,2)
y = [15,13,14.5,17,20,25,26,26,27,22,18,15]
plt.plot(x,y)
plt.xticks(x[::2])
plt.show()

import numpy as np
import pandas as pd
import matplotlib.pyplot as plt
import seaborn as sb

%matplotlib inline
pokemon = pd.read_csv('pokemon.csv')
print(pokemon.shape)
pokemon.head(15)
(807, 14)
|
id |
species |
generation_id |
height |
weight |
base_experience |
type_1 |
type_2 |
hp |
attack |
defense |
speed |
special-attack |
special-defense |
| 0 |
1 |
bulbasaur |
1 |
0.7 |
6.9 |
64 |
grass |
poison |
45 |
49 |
49 |
45 |
65 |
65 |
| 1 |
2 |
ivysaur |
1 |
1.0 |
13.0 |
142 |
grass |
poison |
60 |
62 |
63 |
60 |
80 |
80 |
| 2 |
3 |
venusaur |
1 |
2.0 |
100.0 |
236 |
grass |
poison |
80 |
82 |
83 |
80 |
100 |
100 |
| 3 |
4 |
charmander |
1 |
0.6 |
8.5 |
62 |
fire |
NaN |
39 |
52 |
43 |
65 |
60 |
50 |
| 4 |
5 |
charmeleon |
1 |
1.1 |
19.0 |
142 |
fire |
NaN |
58 |
64 |
58 |
80 |
80 |
65 |
| 5 |
6 |
charizard |
1 |
1.7 |
90.5 |
240 |
fire |
flying |
78 |
84 |
78 |
100 |
109 |
85 |
| 6 |
7 |
squirtle |
1 |
0.5 |
9.0 |
63 |
water |
NaN |
44 |
48 |
65 |
43 |
50 |
64 |
| 7 |
8 |
wartortle |
1 |
1.0 |
22.5 |
142 |
water |
NaN |
59 |
63 |
80 |
58 |
65 |
80 |
| 8 |
9 |
blastoise |
1 |
1.6 |
85.5 |
239 |
water |
NaN |
79 |
83 |
100 |
78 |
85 |
105 |
| 9 |
10 |
caterpie |
1 |
0.3 |
2.9 |
39 |
bug |
NaN |
45 |
30 |
35 |
45 |
20 |
20 |
| 10 |
11 |
metapod |
1 |
0.7 |
9.9 |
72 |
bug |
NaN |
50 |
20 |
55 |
30 |
25 |
25 |
| 11 |
12 |
butterfree |
1 |
1.1 |
32.0 |
178 |
bug |
flying |
60 |
45 |
50 |
70 |
90 |
80 |
| 12 |
13 |
weedle |
1 |
0.3 |
3.2 |
39 |
bug |
poison |
40 |
35 |
30 |
50 |
20 |
20 |
| 13 |
14 |
kakuna |
1 |
0.6 |
10.0 |
72 |
bug |
poison |
45 |
25 |
50 |
35 |
25 |
25 |
| 14 |
15 |
beedrill |
1 |
1.0 |
29.5 |
178 |
bug |
poison |
65 |
90 |
40 |
75 |
45 |
80 |
sb.countplot(data = pokemon, x = 'generation_id', color = base_color, order = gen_order);
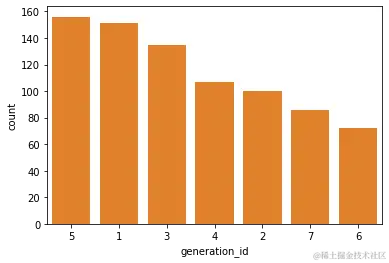
base_color = sb.color_palette()[1]
gen_order = pokemon['generation_id'].value_counts().index
base_color2 = sb.color_palette()[0]
sb.countplot(data = pokemon, y = 'type_1', color = base_color2, order = type_order)
plt.xticks(rotation = 90)
fig = plt.figure(figsize=(20,5))
type_order = pokemon['type_1'].value_counts().index

<Figure size 1440x360 with 0 Axes>
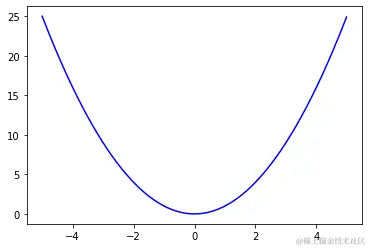
用plot()函数绘制y=x^2函数的图形
import numpy as np
import matplotlib.pyplot as plt
plt.figure()
x=np.arange(-5,5,0.01)
y = x*x
plt.plot(x,y,'b-')
plt.show()
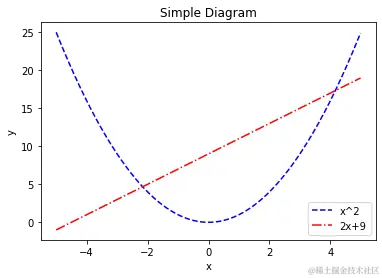
用plot()函数在坐标系中绘制多个图形
import matplotlib.pyplot as plt
import numpy as np
plt.figure()
plt.xlabel('x')
plt.ylabel('y')
plt.title('Simple Diagram')
x = np.arange(-5,5,0.01)
y,y2 = x*x,2*x+9
plt.plot(x,y,'b--',label ='x^2')
plt.plot(x,y2,'r-.',label ='2x+9')
plt.legend()
plt.show()
import matplotlib.pyplot as plt
import numpy as np
plt.figure()
plt.xlabel('x')
plt.ylabel('y')
plt.title('Simple Diagram')
x = np.arange(-5,5,0.01)
y,y2 = x*x,2*x+9
plt.xlim(-8,8)
plt.ylim(0,10)
plt.plot(x,y,'b--',label ='x^2')
plt.plot(x,y2,'r-.',label ='2x+9')
plt.legend()
plt.show()
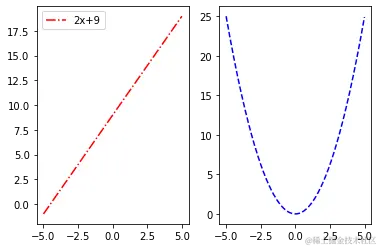
使用subplot() 函数绘制多个子图
plt.figure()
ax1 = plt.subplot(121)
ax2 = plt.subplot(122)
x=np.arange(-5,5,0.01)
y=x*x
plt.sca(ax2)
plt.plot(x,y,'b--',label ='x^2')

x2 = np.arange(-5,5,0.01)
y2=2*x2+9
plt.sca(ax1)
plt.plot(x2,y2,'r-.',label ='2x+9')
plt.legend()
plt.show()
保存图片和输出设置
plt.savefig("tang.svg",dpi=120)
plt.show()
<Figure size 432x288 with 0 Axes>
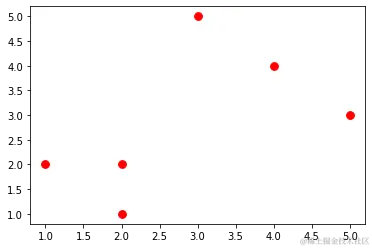
用plt.scatter()绘制散点图
plt.figure()
x=[2,1,2,3,4,5]
y=[1,2,2,5,4,3]
plt.scatter(x,y,s=60,c='r',marker='o')
plt.show()
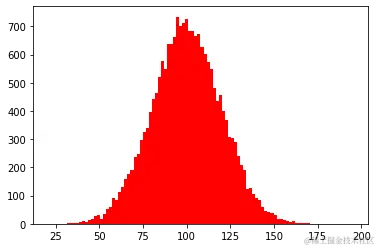
用plt.hist()绘制直方图
mu,sigma = 100,20
x = mu+sigma*np.random.randn(20000)
plt.hist(x,bins=100,color='r')
plt.show()
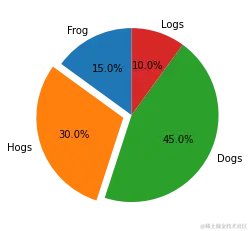
用plt.pie()绘制饼图
labels = 'Frog','Hogs','Dogs','Logs'
sizes =[15,30,45,10]
explode = (0,0.1,0,0)
plt.pie(sizes,explode=explode,labels=labels,autopct='%1.1f%%',shadow=False,startangle=90)
plt.show()
"""该程序中,labels设置每个数据的标签,sizes设置每一块所占的比例,explode设置某一块或多块吐出来显示,突出多少
由值决定,0表示不突出,plt.pie()函数中的shadow设置阴影,这样的显示效果更逼真"""
""" 该程序中,labels设置每个数据的标签,sizes设置每一块所占的比例,explode设置某一块或多块吐出来显示,突出多少\n由值决定,0表示不突出,plt.pie()函数中的shadow设置阴影,这样的显示效果更逼真 """
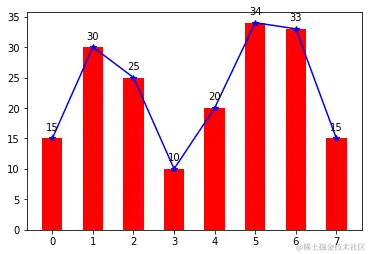
用plt.bar绘制条形图
y = [15,30,25,10,20,34,33,15]
x=np.arange(8)
plt.bar(x,y,color='r',width=0.5)
plt.plot(x,y,'b',marker='*')
for x1,yy in zip(x,y):
    plt.text(x1,yy+1,str(yy),ha='center',va='bottom')
plt.show()
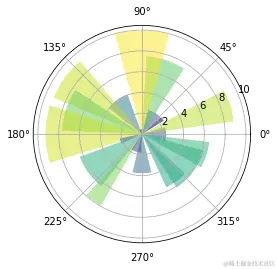
用plt.viridis()绘制极坐标图
N = 20
theta = np.linspace(0.0,2*np.pi,N,endpoint=False)
radii = 10*np.random.rand(N)
width = np.pi /4 * np.random.rand(N)
ax = plt.subplot(111,projection='polar')
bars = ax.bar(theta,radii,width=width,bottom = (0.0))
for r,bar in zip(radii,bars):
bar.set_facecolor(plt.cm.viridis(r/10.))
bar.set_alpha(0.5)
plt.show()
绝对频率与相对频率
pkmn_types = pokemon.melt(id_vars = ['id','species'],
                         value_vars = ['type_1','type_2'],
                         var_name = 'type_level',value_name = 'type').dropna()
pkmn_types[802:812]
|
id |
species |
type_level |
type |
| 802 |
803 |
poipole |
type_1 |
poison |
| 803 |
804 |
naganadel |
type_1 |
poison |
| 804 |
805 |
stakataka |
type_1 |
rock |
| 805 |
806 |
blacephalon |
type_1 |
fire |
| 806 |
807 |
zeraora |
type_1 |
electric |
| 807 |
1 |
bulbasaur |
type_2 |
poison |
| 808 |
2 |
ivysaur |
type_2 |
poison |
| 809 |
3 |
venusaur |
type_2 |
poison |
| 812 |
6 |
charizard |
type_2 |
flying |
| 818 |
12 |
butterfree |
type_2 |
flying |
type_counts = pkmn_types['type'].value_counts()
type_order = type_counts.index
base_color = sb.color_palette()[0]
sb.countplot(data = pkmn_types,y = 'type', color = base_color, order = type_order);
for i in range(type_counts.shape[0]):
count = type_counts[i]
pct_string = '{:0.1f}%' .format(100*count/n_pokemon)
plt.text(count+1,i,pct_string,va = 'center')
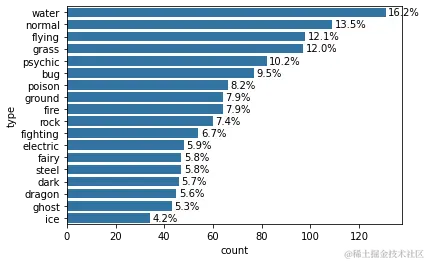
n_pokemon = pokemon.shape[0]
     print(n_pokemon)
max_type_count = type_counts[0]
max_prop = max_type_count / n_pokemon
print(max_prop)
807
0.1623296158612144
tick_props = np.arange(0, max_prop,0.02)
tick_names = ['{:0.2f}'.format(v) for v in tick_props]
为离散数据选择图表
pokemon = pd.read_csv('pokemon.csv')
print(pokemon.shape)
pokemon.head(10)
(807, 14)
|
id |
species |
generation_id |
height |
weight |
base_experience |
type_1 |
type_2 |
hp |
attack |
defense |
speed |
special-attack |
special-defense |
| 0 |
1 |
bulbasaur |
1 |
0.7 |
6.9 |
64 |
grass |
poison |
45 |
49 |
49 |
45 |
65 |
65 |
| 1 |
2 |
ivysaur |
1 |
1.0 |
13.0 |
142 |
grass |
poison |
60 |
62 |
63 |
60 |
80 |
80 |
| 2 |
3 |
venusaur |
1 |
2.0 |
100.0 |
236 |
grass |
poison |
80 |
82 |
83 |
80 |
100 |
100 |
| 3 |
4 |
charmander |
1 |
0.6 |
8.5 |
62 |
fire |
NaN |
39 |
52 |
43 |
65 |
60 |
50 |
| 4 |
5 |
charmeleon |
1 |
1.1 |
19.0 |
142 |
fire |
NaN |
58 |
64 |
58 |
80 |
80 |
65 |
| 5 |
6 |
charizard |
1 |
1.7 |
90.5 |
240 |
fire |
flying |
78 |
84 |
78 |
100 |
109 |
85 |
| 6 |
7 |
squirtle |
1 |
0.5 |
9.0 |
63 |
water |
NaN |
44 |
48 |
65 |
43 |
50 |
64 |
| 7 |
8 |
wartortle |
1 |
1.0 |
22.5 |
142 |
water |
NaN |
59 |
63 |
80 |
58 |
65 |
80 |
| 8 |
9 |
blastoise |
1 |
1.6 |
85.5 |
239 |
water |
NaN |
79 |
83 |
100 |
78 |
85 |
105 |
| 9 |
10 |
caterpie |
1 |
0.3 |
2.9 |
39 |
bug |
NaN |
45 |
30 |
35 |
45 |
20 |
20 |
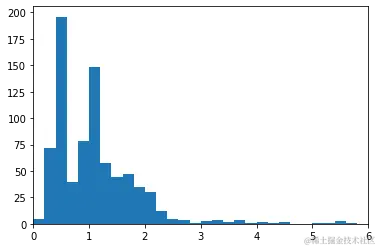
bins = np.arange(0, pokemon['height'].max()+0.2,0.2)
plt.hist(data = pokemon,x = 'height',bins = bins)
plt.xlim((0,6))
(0.0, 6.0)
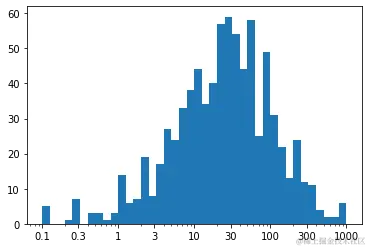
标尺和变换
bins = 10 ** np.arange(-1,3+0.1,0.1)
ticks = [0.1,0.3,1,3,10,30,100,300,1000]
labels = ['{}'.format(v) for v in ticks]
plt.hist(data = pokemon, x= 'weight', bins = bins)
plt.xscale('log')
plt.xticks(ticks,labels)
([<matplotlib.axis.XTick at 0x7faaa989c7c0>,
  <matplotlib.axis.XTick at 0x7faaae6432b0>,
  <matplotlib.axis.XTick at 0x7faaad9000a0>,
  <matplotlib.axis.XTick at 0x7faaade3fb80>,
  <matplotlib.axis.XTick at 0x7faaade33310>,
  <matplotlib.axis.XTick at 0x7faaade33a60>,
  <matplotlib.axis.XTick at 0x7faaade33d30>,
  <matplotlib.axis.XTick at 0x7faaade3fc40>,
  <matplotlib.axis.XTick at 0x7faaade31700>],
 [Text(0.1, 0, '0.1'),
  Text(0.3, 0, '0.3'),
  Text(1.0, 0, '1'),
  Text(3.0, 0, '3'),
  Text(10.0, 0, '10'),
  Text(30.0, 0, '30'),
  Text(100.0, 0, '100'),
  Text(300.0, 0, '300'),
  Text(1000.0, 0, '1000')])
np.log10(pokemon['weight'].describe())
count 2.906874
mean 1.790786
std 2.047350
min -1.000000
25
50
75
max 2.999957
Name: weight, dtype: float64


