炫酷Echarts可视化图标
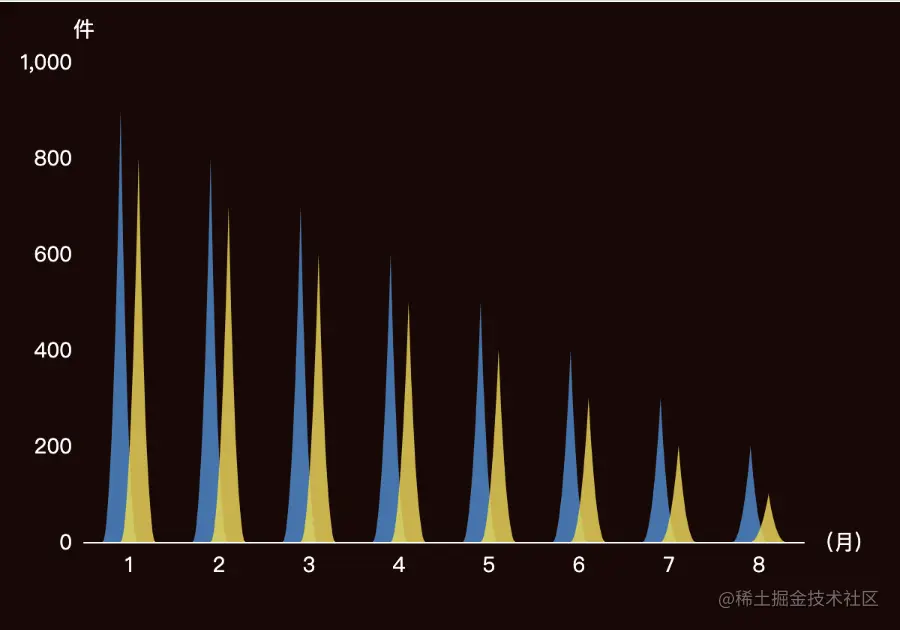
1.柱状图
<template>
<div>
<div id="main" style="width: 600px; height: 400px"></div>
</div>
</template>
<script>
var echarts = require("echarts");
export default {
mounted() {
this.init();
},
methods: {
init() {
var option = {
grid: {
show: false,
top: 40,
left: 60,
right: 60,
bottom: 40,
},
tooltip: {},
xAxis: {
color: "white",
type: "category",
name: "(月)",
nameTextStyle: {
fontSize: 14,
color: "#fff",
},
data: [1, 2, 3, 4, 5, 6, 7, 8],
axisLabel: {
interval: 0,
color: "#fff",
fontSize: 14,
},
axisTick: {
show: false,
},
axisLine: {
lineStyle: {
color: "#fff",
},
},
splitArea: {
show: false,
},
},
yAxis: {
type: "value",
name: "件",
nameTextStyle: {
fontSize: 14,
color: "#fff",
},
min: 0,
axisLabel: {
color: "#fff",
fontSize: 14,
},
axisTick: {
show: false,
},
axisLine: {
lineStyle: {
color: "#fff",
},
},
splitLine: {
show: false,
},
splitArea: {
show: false,
},
},
series: [
{
data: [900, 800, 700, 600, 500, 400, 300, 200],
barWidth: "40%",
type: "pictorialBar",
symbol:
"path://M12.000,-0.000 C12.000,-0.000 16.074,60.121 22.731,60.121 C26.173,60.121 -3.234,60.121 0.511,60.121 C7.072,60.121 12.000,-0.000 12.000,-0.000 Z",
showBackground: false,
color: ["#3BAAFF"],
itemStyle: {
opacity: 0.68,
},
},
{
data: [800, 700, 600, 500, 400, 300, 200, 100],
barWidth: "40%",
barGap: "-50%",
type: "pictorialBar",
symbol:
"path://M12.000,-0.000 C12.000,-0.000 16.074,60.121 22.731,60.121 C26.173,60.121 -3.234,60.121 0.511,60.121 C7.072,60.121 12.000,-0.000 12.000,-0.000 Z",
showBackground: false,
color: ["#F9DC3A"],
itemStyle: {
opacity: 0.8,
},
},
],
};
let myChart = echarts.init(document.getElementById("main"));
myChart.clear();
myChart.setOption(option);
},
},
};
</script>
<style></style>
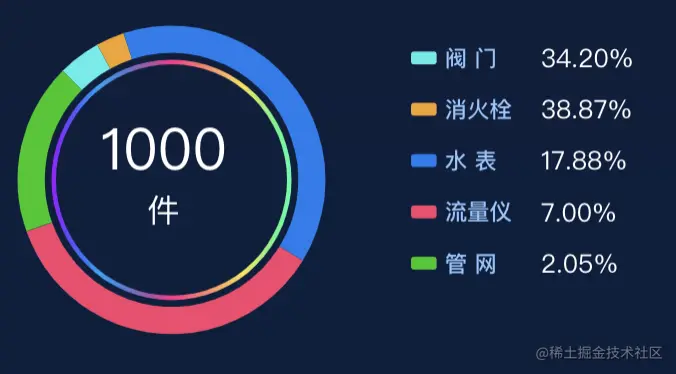
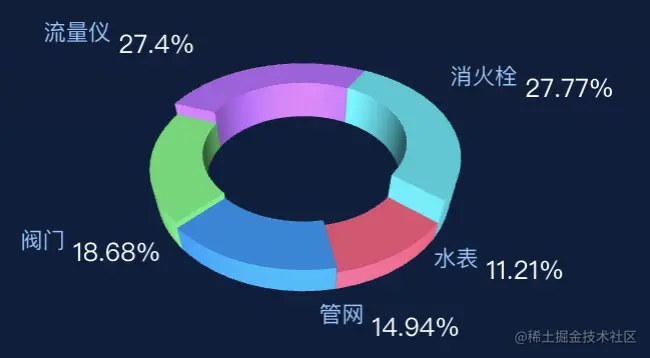
2.饼状图
<template>
<div>
<div id="main" style="width: 600px; height: 400px"></div>
</div>
</template>
<script>
var echarts = require("echarts");
export default {
mounted() {
this.init();
},
methods: {
init() {
let getname = ['阀 门', '消火栓', '水 表', '流量仪', '管 网']
var getvalue = [34.2, 38.87, 17.88, 7.00, 2.05]
var getbl = [34.2, 38.87, 17.88, 7.00, 2.05]
var data = []
for (var i = 0; i < getname.length; i++) {
data.push({ name: getname[i], value: getvalue[i] })
}
let option = {
backgroundColor: '',
animation: true,
title: {
text: 1000,
subtext: '件',
left: '28%',
top: '35%',
textStyle: {
color: '#fff',
fontSize: 36,
fontWeight: 'normal',
align: 'center'
},
subtextStyle: {
color: '#fff',
fontSize: 20,
fontWeight: 'normal',
align: 'center'
},
textAlign: 'center'
},
legend: {
width: '40%',
left: '60%',
top: '15%',
itemWidth: 16,
itemHeight: 8,
orient: 'vertical',
x: 'left',
right: '0',
bottom: '0',
padding: [15, 0],
itemGap: 16,
data: getname,
formatter: function (name) {
for (var i = 0; i < getname.length; i++) {
if (name === data[i].name) {
return '{rate|' + name + ' }{name|' + getbl[i].toFixed(2) + '%}'
}
}
},
textStyle: {
rich: {
name: {
fontSize: 16,
fontWeight: 400,
width: 200,
height: 15,
padding: [0, 0, 0, 50],
color: '#fff'
},
rate: {
fontSize: 14,
fontWeight: 500,
height: 15,
width: 10,
padding: [0, 0, 0, 0],
color: '#8FC6FF'
}
}
}
},
series: [{
type: 'pie',
center: ['30%', '50%'],
radius: ['56%', '68%'],
color: ['#42EDEB', '#F2A221', '#027DEF', '#F8426D', '#00C800', '#F76F01', '#01A4F7', '#FE2C8A'],
startAngle: 135,
labelLine: {
normal: {
length: 25
}
},
label: {
normal: {
show: false,
formatter: '{b|{b}:} {per|{d}%} ',
backgroundColor: 'rgba(255, 147, 38, 0)',
borderColor: 'transparent',
borderRadius: 4,
rich: {
a: {
color: '#999',
lineHeight: 22,
align: 'center'
},
hr: {
borderColor: '#aaa',
width: '100%',
borderWidth: 1,
height: 0
},
b: {
color: '#b3e5ff',
fontSize: 16,
lineHeight: 33
},
c: {
fontSize: 14,
color: '#eee'
},
per: {
color: '#FDF44E',
fontSize: 14,
padding: [5, 8],
borderRadius: 2
}
},
textStyle: {
color: '#fff',
fontSize: 16
}
}
},
emphasis: {
label: {
show: false,
formatter: '{b|{b}:} {per|{d}%} ',
backgroundColor: 'rgba(255, 147, 38, 0)',
borderColor: 'transparent',
borderRadius: 4,
rich: {
a: {
color: '#999',
lineHeight: 10,
align: 'center'
},
hr: {
borderColor: '#aaa',
width: '100%',
borderWidth: 1,
height: 0
},
b: {
color: '#fff',
fontSize: 10,
lineHeight: 33
},
c: {
fontSize: 14,
color: '#eee'
},
per: {
color: '#FDF44E',
fontSize: 122,
padding: [5, 6],
borderRadius: 2
}
}
}
},
data: [{
name: '阀 门',
value: 3
}, {
name: '消火栓',
value: 2
}, {
name: '水 表',
value: 26
}, {
name: '流量仪',
value: 24
}, {
name: '管 网',
value: 12
}]
}, {
type: 'pie',
center: ['30%', '50%'],
radius: ['53%', '51%'],
label: {
show: false
},
data: [{
value: 78,
name: '实例1',
itemStyle: {
normal: {
color: {
x: 0,
y: 0,
x2: 1,
y2: 0,
type: 'linear',
global: false,
colorStops: [{
offset: 0,
color: '#9F17FF'
}, {
offset: 0.2,
color: '#01A4F7'
}, {
offset: 0.5,
color: '#FE2C8A'
}, {
offset: 0.8,
color: '#FEE449'
}, {
offset: 1,
color: '#00FFA8'
}]
}
}
}
}]
}]
}
let myChart = echarts.init(document.getElementById("main"));
myChart.clear();
myChart.setOption(option);
},
},
};
</script>
<style></style>
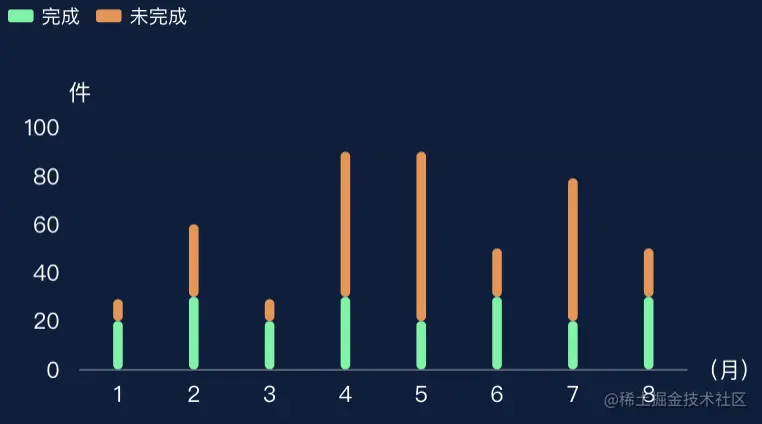
柱状图
<template>
<div class='ysslEarcts'>
<main-echarts
v-if="Object.keys(xjjschartState).length > 0"
id="xjjsEcharts"
:chartData='xjjschartState'
></main-echarts>
</div>
</template>
<script>
import MainEcharts from '@/components/mainEcharts'
export default {
name: '',
components: {
MainEcharts
},
props: {
className: {
type: String,
default: 'chart'
},
width: {
type: String,
default: '100%'
},
height: {
type: String,
default: '100%'
},
idName: {
default: 0
},
chartData: {
type: Object
}
},
data() {
return {
actualData: [],
pieData: [],
distance: 20,
xjjschartState: {}
}
},
mounted() {
this.init()
},
methods: {
init() {
var data1 = [20, 30, 20, 30, 20, 30, 20, 30, 20, 30]
var data2 = [9, 30, 9, 60, 70, 20, 59, 20, 49, 20]
var datacity = [
'1', '2', '3', '4', '5', '6', '7', '8'
]
let option = {
color: ['#4DF5A0', '#F19149', '#F6931C', '#FFD52E'],
tooltip: {
trigger: 'axis',
show: false
},
legend: {
left: '2%',
top: '2%',
data: ['完成', '未完成'],
itemWidth: 16,
itemHeight: 8,
textStyle: {
fontSize: 12,
color: '#fff'
}
},
grid: {
top: '30%',
left: '5%',
right: '12%',
bottom: '10%',
containLabel: true
},
yAxis: [
{
name: '件',
nameTextStyle: {
fontSize: 14,
color: '#fff'
},
type: 'value',
axisLabel: {
show: true,
interval: 'auto',
formatter: '{value} ',
textStyle: {
fontSize: 14,
color: '#fff'
}
},
axisTick: {
show: false
},
splitLine: {
show: false
},
show: true
}
],
xAxis: [
{
name: '(月)',
nameTextStyle: {
fontSize: 14,
color: '#fff'
},
type: 'category',
axisLabel: {
interval: 0,
show: true,
splitNumber: 8,
textStyle: {
fontSize: 14,
color: '#fff'
}
},
data: datacity,
axisTick: {
show: false
},
splitLine: {
show: false
}
}
],
series: [
{
name: '完成',
type: 'bar',
stack: 'sum',
barWidth: '6px',
data: data1,
itemStyle: {
emphasis: {
barBorderRadius: 6
},
normal: {
barBorderRadius: 6
}
}
},
{
name: '未完成',
type: 'bar',
barWidth: '6px',
stack: 'sum',
data: data2,
itemStyle: {
emphasis: {
barBorderRadius: 6
},
normal: {
barBorderRadius: 6
}
}
}
]
}
this.xjjschartState = option
}
},
watch: {
chartData: {
deep: true,
handler(val) {
this.setOptions(val)
}
}
}
}
</script>
<style scoped lang="scss">
.ysslEarcts {
height: 100%;
}
.pageEcharts> div,.pageEcharts canvas{
// width: 100% !important;
// height: 100% !important;
font-size: initial;
}
</style>
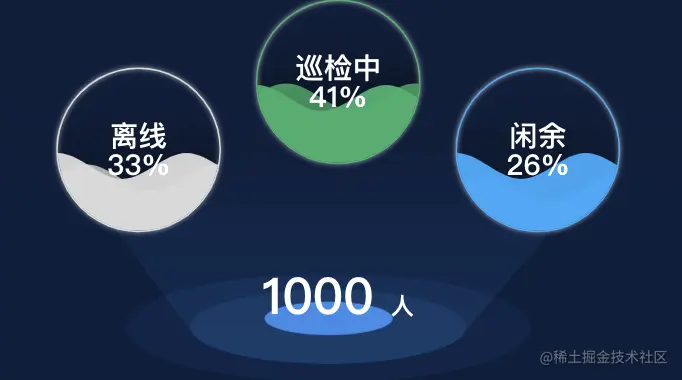
水位线饼状图
<template>
<div class="pensonState">
<div class="pensontb">
<main-echarts
v-if="Object.keys(ryztchartState).length > 0"
id="pensontbEcharts"
:chartData='ryztchartState'
></main-echarts>
</div>
<div class="div_total">1000 <span>人</span></div>
</div>
</template>
<script>
import MainEcharts from '@/components/mainEcharts'
export default {
name: 'pensonState',
components: {
MainEcharts
},
data() {
return {
ryztchartState: {}
}
},
methods: {
init() {
let option = {
backgroundColor: '',
grid: {
top: '2%',
left: '5%',
right: '5%',
bottom: '2%'
},
xAxis: [],
yAxis: {
type: 'value',
show: false,
max: 1000
},
series: [
{
type: 'liquidFill',
radius: '60%',
center: ['25%', '65%'],
data: [0.33, 0.4],
color: ['#DCDCDC'],
outline: {
show: true,
borderDistance: 0,
itemStyle: {
borderWidth: 1,
borderColor: '#DCDCDC',
shadowBlur: 3,
shadowColor: '#fff'
}
},
backgroundStyle: {
shadowColor: 'rgba(0, 0, 0, 0)',
opacity: 0
},
label: {
formatter: function(param) {
return '离线' + '\n' + param.data * 100 + '%'
},
textStyle: {
color: '#fff',
fontSize: 18
}
}
}, {
type: 'liquidFill',
radius: '60%',
center: ['50%', '40%'],
data: [0.41, 0.4],
color: ['#32B16C'],
outline: {
show: true,
borderDistance: 0,
itemStyle: {
borderWidth: 1,
borderColor: '#32B16C',
shadowBlur: 3,
shadowColor: '#fff'
}
},
backgroundStyle: {
shadowColor: 'rgba(0, 0, 0, 0)',
opacity: 0
},
label: {
formatter: function(param) {
return '巡检中' + '\n' + param.data * 100 + '%'
},
textStyle: {
color: '#fff',
fontSize: 18
}
}
}, {
type: 'liquidFill',
radius: '60%',
center: ['75%', '65%'],
data: [0.26, 0.4],
color: ['#28ACFF'],
outline: {
show: true,
borderDistance: 0,
itemStyle: {
borderWidth: 1,
borderColor: '#28ACFF',
shadowBlur: 3,
shadowColor: '#fff'
}
},
backgroundStyle: {
shadowColor: 'rgba(0, 0, 0, 0)',
opacity: 0
},
label: {
formatter: function(param) {
return '闲余' + '\n' + param.data * 100 + '%'
},
textStyle: {
color: '#fff',
fontSize: 18
}
}
}
]
}
this.ryztchartState = option
}
},
mounted() {
this.init()
}
}
</script>
<style scoped lang="scss">
.pensontb{
width: 100%;
height: 60%;
}
.pensonState{
width: 100%;
height: 100%;
background: url("../images/stste_bg.png") center 80% no-repeat;
background-size: 70% auto;
.div_total{
font-size: 0.30rem;
font-family: PingFangSC, PingFangSC-Semibold;
font-weight: 600;
text-align: left;
color: #ffffff;
line-height: 0.6rem;
text-align: center;
span{
font-size: 0.14rem;
color:#fff;
}
}
}
</style>
3D饼状图
<template>
<div class="pensonState">
<div class="pensontb">
<main-echarts
v-if="Object.keys(ryztchartState).length > 0"
id="pensontbEcharts"
:chartData='ryztchartState'
></main-echarts>
</div>
<div class="div_total">1000 <span>人</span></div>
</div>
</template>
<script>
import MainEcharts from '@/components/mainEcharts'
export default {
name: 'pensonState',
components: {
MainEcharts
},
data() {
return {
ryztchartState: {}
}
},
methods: {
init() {
let option = {
backgroundColor: '',
grid: {
top: '2%',
left: '5%',
right: '5%',
bottom: '2%'
},
xAxis: [],
yAxis: {
type: 'value',
show: false,
max: 1000
},
series: [
{
type: 'liquidFill',
radius: '60%',
center: ['25%', '65%'],
data: [0.33, 0.4],
color: ['#DCDCDC'],
outline: {
show: true,
borderDistance: 0,
itemStyle: {
borderWidth: 1,
borderColor: '#DCDCDC',
shadowBlur: 3,
shadowColor: '#fff'
}
},
backgroundStyle: {
shadowColor: 'rgba(0, 0, 0, 0)',
opacity: 0
},
label: {
formatter: function(param) {
return '离线' + '\n' + param.data * 100 + '%'
},
textStyle: {
color: '#fff',
fontSize: 18
}
}
}, {
type: 'liquidFill',
radius: '60%',
center: ['50%', '40%'],
data: [0.41, 0.4],
color: ['#32B16C'],
outline: {
show: true,
borderDistance: 0,
itemStyle: {
borderWidth: 1,
borderColor: '#32B16C',
shadowBlur: 3,
shadowColor: '#fff'
}
},
backgroundStyle: {
shadowColor: 'rgba(0, 0, 0, 0)',
opacity: 0
},
label: {
formatter: function(param) {
return '巡检中' + '\n' + param.data * 100 + '%'
},
textStyle: {
color: '#fff',
fontSize: 18
}
}
}, {
type: 'liquidFill',
radius: '60%',
center: ['75%', '65%'],
data: [0.26, 0.4],
color: ['#28ACFF'],
outline: {
show: true,
borderDistance: 0,
itemStyle: {
borderWidth: 1,
borderColor: '#28ACFF',
shadowBlur: 3,
shadowColor: '#fff'
}
},
backgroundStyle: {
shadowColor: 'rgba(0, 0, 0, 0)',
opacity: 0
},
label: {
formatter: function(param) {
return '闲余' + '\n' + param.data * 100 + '%'
},
textStyle: {
color: '#fff',
fontSize: 18
}
}
}
]
}
this.ryztchartState = option
}
},
mounted() {
this.init()
}
}
</script>
<style scoped lang="scss">
.pensontb{
width: 100%;
height: 60%;
}
.pensonState{
width: 100%;
height: 100%;
background: url("../images/stste_bg.png") center 80% no-repeat;
background-size: 70% auto;
.div_total{
font-size: 0.30rem;
font-family: PingFangSC, PingFangSC-Semibold;
font-weight: 600;
text-align: left;
color: #ffffff;
line-height: 0.6rem;
text-align: center;
span{
font-size: 0.14rem;
color:#fff;
}
}
}
</style>
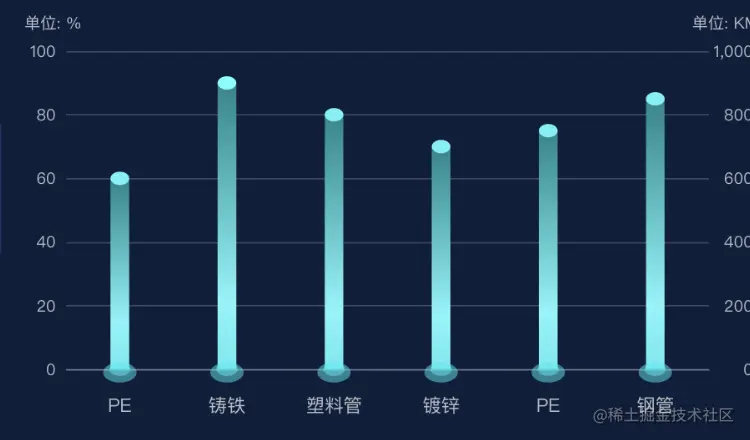
柱状图
<template>
<div class='ysslEarcts'>
<main-echarts
v-if="Object.keys(gwwxState).length > 0"
id="gwwxState"
:chartData='gwwxState'
></main-echarts>
</div>
</template>
<script>
import MainEcharts from '@/components/mainEcharts'
export default {
name: '',
components: {
MainEcharts
},
props: {
className: {
type: String,
default: 'chart'
},
width: {
type: String,
default: '100%'
},
height: {
type: String,
default: '100%'
},
idName: {
default: 0
},
chartData: {
type: Object
}
},
data() {
return {
gwwxState: {}
}
},
mounted() {
this.init()
},
methods: {
init() {
var data = [60, 90, 80, 70, 75, 85]
let option = {
xAxis: [
{
type: 'category',
data: ['PE', '铸铁', '塑料管', '镀锌', 'PE', '钢管'],
axisPointer: {
type: 'shadow'
},
axisLabel: {
textStyle: {
color: 'rgba(255,255,255,0.7)',
fontSize: 14
},
margin: 20
},
axisTick: {
show: false
},
axisLine: {
show: true,
lineStyle: {
color: 'rgba(255, 255, 255, 1)',
opacity: 0.3
}
}
}
],
yAxis: [
{
type: 'value',
name: '单位: %',
position: 'left',
min: 0,
max: 100,
interval: 20,
nameTextStyle: {
color: 'rgba(255, 255, 255, 0.7)',
padding: [0, 0, 0, -20]
},
axisLabel: {
formatter: '{value}',
textStyle: {
color: 'rgba(255, 255, 255, 0.7)'
}
},
splitLine: {
show: true,
lineStyle: {
color: 'rgba(255, 255, 255, 1)',
opacity: 0.1
}
}
},
{
type: 'value',
name: '单位: KM',
position: 'right',
min: 0,
max: 1000,
interval: 200,
nameTextStyle: {
color: 'rgba(255, 255, 255, 0.7)',
padding: [0, 0, 0, 25]
},
axisLabel: {
formatter: '{value}',
align: 'right',
padding: [0, -25, 0, 0],
textStyle: {
color: 'rgba(255, 255, 255, 0.7)'
}
},
splitLine: {
show: true,
lineStyle: {
color: 'rgba(255, 255, 255, 1)',
opacity: 0.1
}
}
}
],
series: [
{
type: 'pictorialBar',
symbolSize: [14, 10],
symbolOffset: [0, -5],
z: 12,
symbolPosition: 'end',
itemStyle: {
normal: {
color: '#5cf1f7'
}
},
data
},
{
type: 'pictorialBar',
symbolSize: [16, 10],
symbolOffset: [0, 5],
z: 12,
itemStyle: {
normal: {
color: 'rgba(28,234,242,0.49)'
}
},
data
},
{
type: 'pictorialBar',
symbolSize: [25, 15],
symbolOffset: [0, 10],
z: 11,
itemStyle: {
normal: {
color: 'rgba(28,234,242,0.49)'
}
},
data
},
{
type: 'bar',
silent: true,
barWidth: 14,
itemStyle: {
normal: {
color: {
x: 0,
y: 0,
x2: 0,
y2: 1,
type: 'linear',
global: false,
colorStops: [
{
offset: 0,
color: '#0c858a'
},
{
offset: 0.76,
color: '#79f6fb'
},
{
offset: 1,
color: '#57e9ef'
}
]
}
}
},
data
}
]
}
this.gwwxState = option
}
},
watch: {
chartData: {
deep: true,
handler(val) {
this.setOptions(val)
}
}
}
}
</script>
<style scoped lang="scss">
.ysslEarcts {
height: 100%;
}
.pageEcharts> div,.pageEcharts canvas{
// width: 100% !important;
// height: 100% !important;
font-size: initial;
}
</style>


