

Matplotlib是一个显示图形的绘图库,它是Numpy库的数字-数学扩展。Pyplot是Matplotlib模块的一个基于状态的接口,它提供了一个类似MATLAB的接口。让我们深入了解一下matplotlib.pyplot.plot() 函数。
matplotlib plot
matplotlib.pyplot.plot() 是一个内置的库函数,它为给定的点创建一个图形并将该图形作为输出显示。matplotlib.plot() 函数以线和标记的形式绘制y与x的关系。
语法
matplotlib.pyplot.plot(*args, scalex=True, scaley=True, data=None, **kwargs)
参数
matplotlib.pyplot.plot() 函数有一个必要参数和四个可选参数作为参数。
- args - x,y:这个参数有两个值,x和y。点在x和y参数中传递。这个x和y的值可以是数字或数字的列表。
- fmt: fmt代表格式。这是一个可选的参数。这个参数需要一个字符串作为参数。这个字符串表示必须以何种格式来创建图形。例如,字符串格式中使用的一些颜色代码是r代表红色,b代表蓝色,g代表绿色,y代表黄色。同样,字符串格式中使用的一些标记是 "o "代表圆,". "代表点,"*"代表星,"+"代表加。
- *数据:一个带有标记数据的对象作为参数被传递。这是一个可选的参数。
返回值
matplotlib.pyplot.lib() 函数返回一个代表绘图数据的2d线的列表。
使用matplotlib.pyplot.plot创建一个绘图的程序
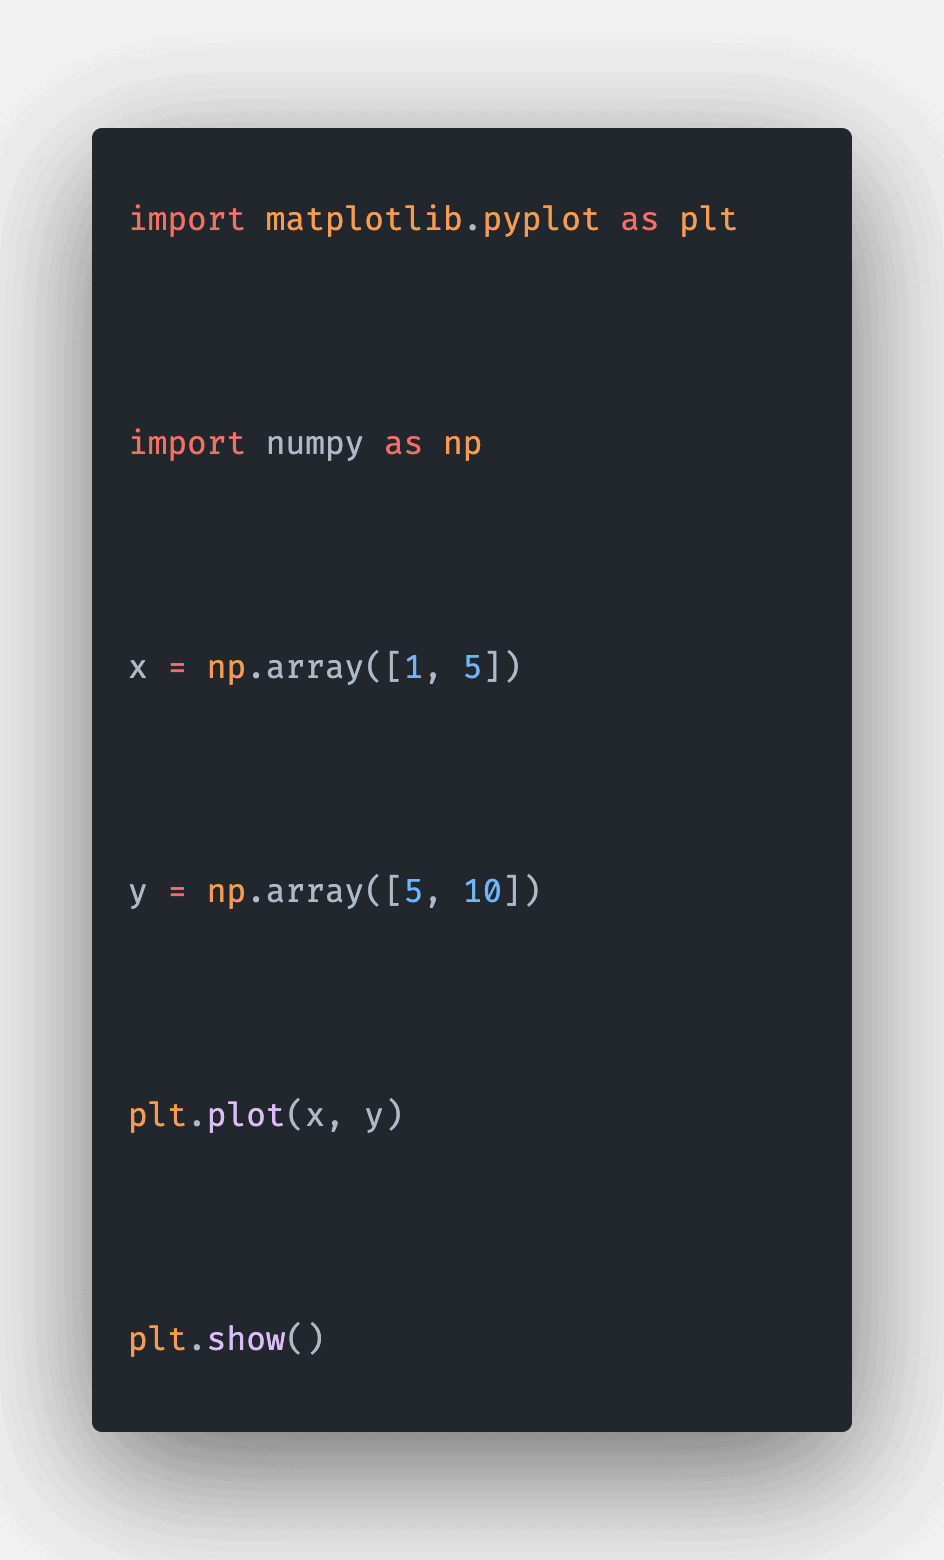
# Importing matplotlib.pyplot as plt.
import matplotlib.pyplot as plt

# Importing numpy as np
import numpy as np

# create a numpy array for storing the x coordinates
x = np.array([1, 5])

# create a numpy array for storing the y coordinates
y = np.array([5, 10])

# pass the x coordinates and y coordinates into the plot() function
plt.plot(x, y)

# displaying the created graph using the show method
plt.show()
输出
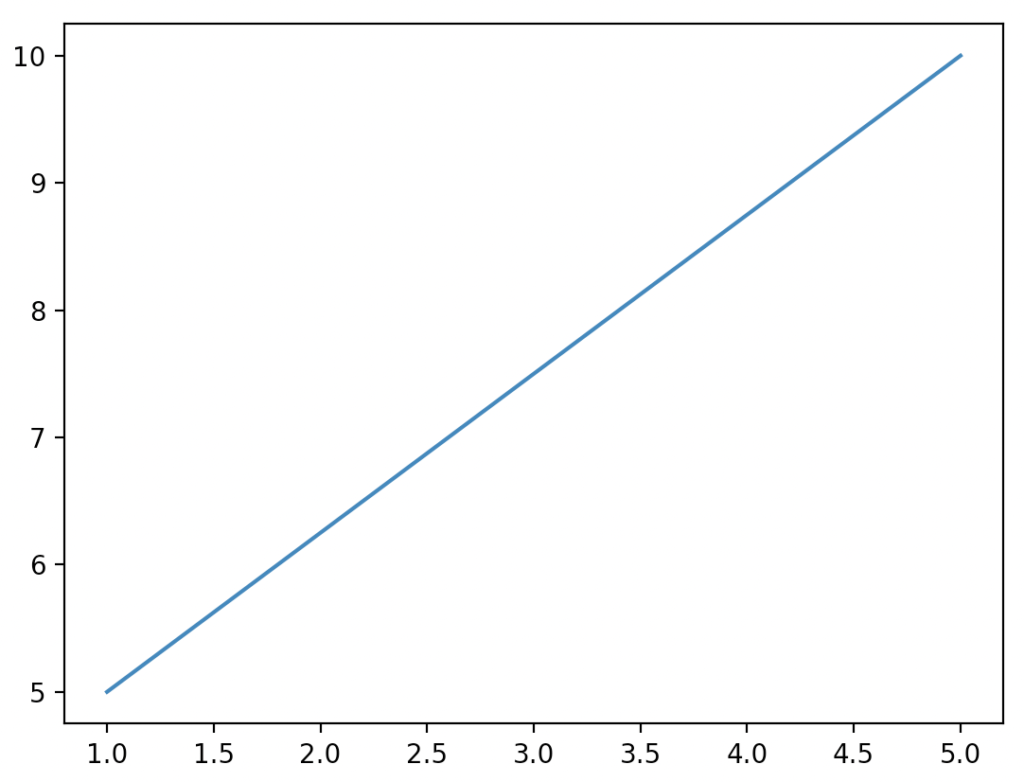
我们在这个程序中导入了matplotlib.pyplot() 函数来绘制图形。matplotlib 库包含了所有用于绘制不同类型的图形的函数。然后,我们导入了numpy库来创建x和y坐标。
在接下来的步骤中,我们创建了x和y坐标,并将这个numpy数组存储在x和y变量中。然后,我们将这两个坐标传递给plot()函数。
这个函数在x轴和y轴上绘制了图形。然后,用**show()**函数来显示该图。
使用matplotlib.pyplot.plot创建两个绘图图的程序
# Importing matplotlib.pyplot as plt.
import matplotlib.pyplot as plt

# Importing numpy as np
import numpy as np

# create a numpy array for storing the x coordinates
x = np.array([1, 3, 5, 7, 9, 11, 13])

# create a numpy array for storing the y coordinates
y = np.array([0, 2, 4, 6, 8, 10, 12])

# x and y coorindates for the second line is stored in the variable
u = np.array([13, 11, 9, 7, 5, 3, 1])
v = np.array([0, 2, 4, 6, 8, 10, 12])

# the plot function is called with coordinates x,y,u,v
plt.plot(x, y, 'yo', u, v, 'g*')

# displaying the created graph using the show method
plt.show()
输出
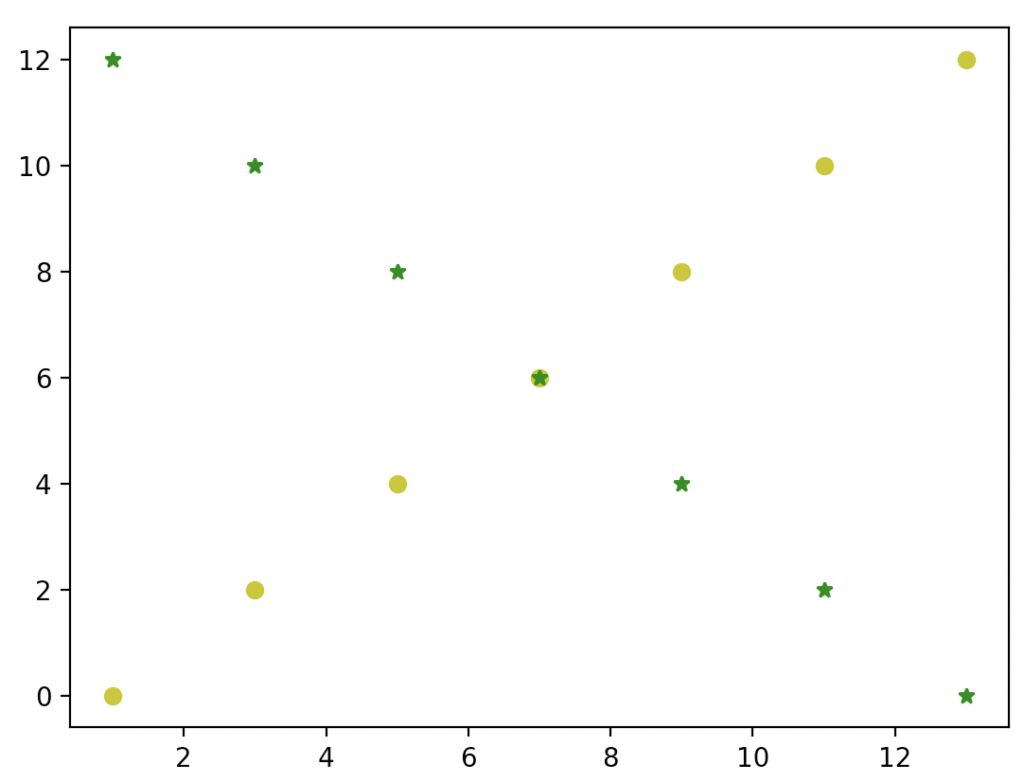
在这个程序中,我们导入了matplotlib.pyplot来绘制图形。matplotlib库包含了所有用于绘制不同类型的图形的函数。然后我们导入numpy来创建x和y坐标。
在接下来的步骤中,我们创建了x和y坐标,并将这个numpy 数组 存储在x和y变量中。
然后,我们创建了第二行的x和y坐标,并将它们存储在u和v变量中。
然后,我们以x和y为第一个参数调用了绘图函数,然后我们给出了直线的格式为黄色的圆。
最后,我们传递了第二行的坐标,字符串的格式是绿色的星形。
本教程到此结束。
