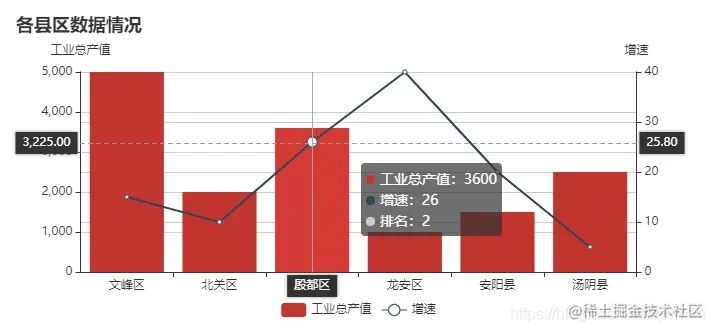
直接上效果图,双Y轴,双系列+额外tooltip信息
<script type="text/javascript">
var myChart = echarts.init(document.getElementById('myAreaChart'));
var option = {
title: {
text: '各县区数据情况'
},
tooltip: {
trigger: 'axis',
axisPointer: {
type: 'cross'
},
formatter: function (param) {
var item1 = param[0];
var item2 = param[1];
var dot1 = '<span style="display:inline-block;margin-right:5px;border-radius:10px;width:9px;height:9px;background-color:' + item1.color + '"></span>';
var dot2 = '<span style="display:inline-block;margin-right:5px;border-radius:10px;width:9px;height:9px;background-color:' + item2.color + '"></span>';
var dot3 = '<span style="display:inline-block;margin-right:5px;border-radius:10px;width:9px;height:9px;background-color:#ccc"></span>';
return dot1 + '工业总产值:' + item1.data.value + '<br/>' + dot2 + '增速:' + item2.data + '<br/>' + dot3 + '排名:' + item1.data.rank;
}
},
legend: {
data: ['工业总产值', '增速'],
bottom: 10,
left: 'center',
},
xAxis: {
data: ["文峰区", "北关区", "殷都区", "龙安区", "安阳县", "汤阴县"]
},
yAxis: [{
name: '工业总产值',
type: 'value'
}, {
name: '增速',
type: 'value'
}],
series: [{
name: '工业总产值',
type: 'bar',
yAxisIndex: 0,
data: [{ value: 5000, rank: 1 }, { value: 2000, rank: 5 }, { value: 3600, rank: 2 }, { value: 1000, rank: 4 }, { value: 1500, rank: 6 }, { value: 2500, rank: 3 }]
}, {
name: '增速',
type: 'line',
yAxisIndex: 1,
data: [15, 10, 26, 40, 20, 5]
}
]
};
myChart.setOption(option);
</script>


