从 npm 获取
npm install echarts --save
main.js中
import echarts from 'echarts'
Vue.prototype.$echarts = echarts
页面
<h5 class="tongji_box_div">
<div class="clearfix">
<div class="tongji_dev">
<span><i class="fa fa-file"></i>询盘线索统计</span>
</div>
<div class="tongji_time">
<span :class="{'gaolian': falg2 == 3}" @click="getLineWeek">本周</span>
<span :class="{'gaolian': falg2 == 2}" @click="getLineMonth">本月</span>
<span :class="{'gaolian': falg2 == 1}" @click="getLineYear">全年</span></div>
</div>
<div ref="echart_tran2" class="echart_tran2" :style="{width: '100%', height: '330px'}"></div>
</h5>
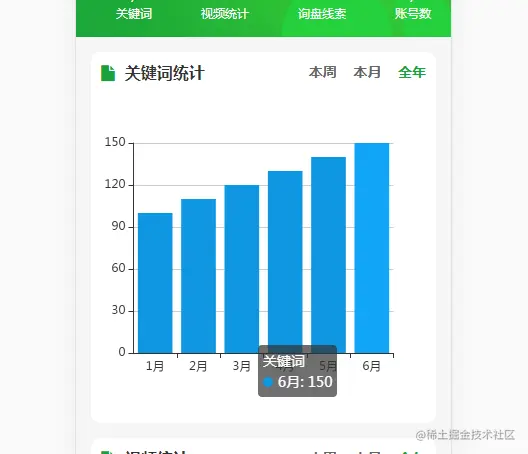
option: {
tooltip: {},
xAxis: {
y: '20',
data: ["1月", "2月", "3月", "4月", "5月", "6月", "7月", "8月", "9月", "10月", "11月", "12月"]
},
yAxis: {},
series: [{
name: '关键词',
type: 'bar',
data: [100000, 200, 360, 100, 100, 20, 100, 200, 360, 100, 100, 200],
itemStyle: {
normal: {
color: '#1097e2',
lineStyle: {
color: '#1097e2'
}
}
}
}]
},
获取dome和数据(关键)
  drawEchart(ref, option) {
    const _this = this
    const myChart = _this.$echarts.init(ref)
    myChart.setOption(option)
    window.addEventListener('resize', function() {
      myChart.resize()
    })
  },
获取全年的关键词统计数据
  getYear() {
    var date = new Date;
    var month = date.getMonth() + 1;
    this.option.xAxis.data = [];
    this.option.series[0].data = [];
    for (var i = 0; i < month; i++) {
      this.option.xAxis.data.push(i + 1 + '月')
      this.option.series[0].data.push(100 + i*10)
    }
    console.log(this.option.series)
    this.drawEchart(this.$refs.echart_tran, this.option)
    this.falg = 1;
  },


