基础组件封装
<template>
<div id="contentId" ref="graph"></div>
</template>
<script>
export default {
name: 'BaseGraph',
props: {
options: {
type: Object,
default: () => { }
},
graphType: {
type: String,
default: 'Graph'
},
hoverFlag: {
type: String,
default: undefined
}
},
data () {
return {
myGraph: null,
graphHeigth: 0,
graphWidth: 0
}
},
watch: {
options: {
handler (newValue, oldValue) {
this._initGraph(newValue)
},
deep: true
}
},
mounted () {
this._initGraphWithAndHeight()
this._initGraph(this.options)
this.graphCollapseClick()
!this.hoverFlag && this.handleStateSet()
this.nodeClick()
},
destroyed () {
if (this.myGraph) {
this.myGraph.destroy()
}
},
methods: {
nodeClick () {
this.myGraph.on('node:click', (e) => {
this.$emit('getDetails', e)
})
},
graphCollapseClick () {
this.myGraph.on('collapse-text:click', (e) => {
this.handleCollapse(e)
})
this.myGraph.on('collapse-back:click', (e) => {
this.handleCollapse(e)
})
},
handleStateSet () {
this.myGraph.on('node:mouseenter', (evt) => {
const { item } = evt
this.myGraph.setItemState(item, 'nodeHover', true)
this.handleEdgeHighLight(item)
})
this.myGraph.on('node:mouseleave', (evt) => {
const { item } = evt
this.myGraph.setItemState(item, 'nodeHover', false)
this.hanldeClearHighLight()
})
},
handleEdgeHighLight (item) {
this.myGraph.getNodes().forEach((node) => {
this.myGraph.setItemState(node, 'dark', true)
})
this.myGraph.getEdges().forEach((edge, index) => {
if (edge.getSource() === item) {
this.myGraph.setItemState(edge.getTarget(), 'highlight', true)
this.myGraph.setItemState(edge, 'highlight', true)
edge.toFront()
this.$emit('edgeActive', { edge, data: this.options.data.edges[index] })
} else if (edge.getTarget() === item) {
this.myGraph.setItemState(edge.getSource(), 'highlight', true)
this.myGraph.setItemState(edge, 'highlight', true)
edge.toFront()
this.$emit('edgeActive', { edge, data: this.options.data.edges[index] })
} else {
this.myGraph.setItemState(edge, 'highlight', false)
}
})
},
hanldeClearHighLight () {
this.myGraph.getNodes().forEach(node => {
this.myGraph.clearItemStates(node)
})
this.myGraph.getEdges().forEach((edge, index) => {
this.myGraph.clearItemStates(edge)
this.$emit('edgeUnActive', { edge, data: this.options.data.edges[index] })
})
},
_initGraph (options) {
this.myGraph = new G6[this.graphType]({
container: 'contentId',
width: this.$refs.graph.scrollWidth,
height: this.$refs.graph.scrollHeight,
fitView: true,
animate: true,
...options.config
})
this.myGraph.data(options.data)
this.myGraph.render()
window.addEventListener('resize', () => {
this._initGraphWithAndHeight()
this.myGraph.changeSize(this.myGraphWidth, this.myGraphHeigth)
})
},
_initGraphWithAndHeight () {
this.myGraphWidth = this.$refs.graph.scrollWidth
this.myGraphHeigth = this.$refs.graph.scrollHeight
},
handleCollapse (e) {
const target = e.target
const id = target.get('modelId')
const item = this.myGraph.findById(id)
const nodeModel = item.getModel()
nodeModel.collapsed = !nodeModel.collapsed
this.myGraph.layout()
this.myGraph.setItemState(item, 'collapse', nodeModel.collapsed)
}
}
}
</script>
<style scoped>
#contentId {
height: 100%;
}
</style>
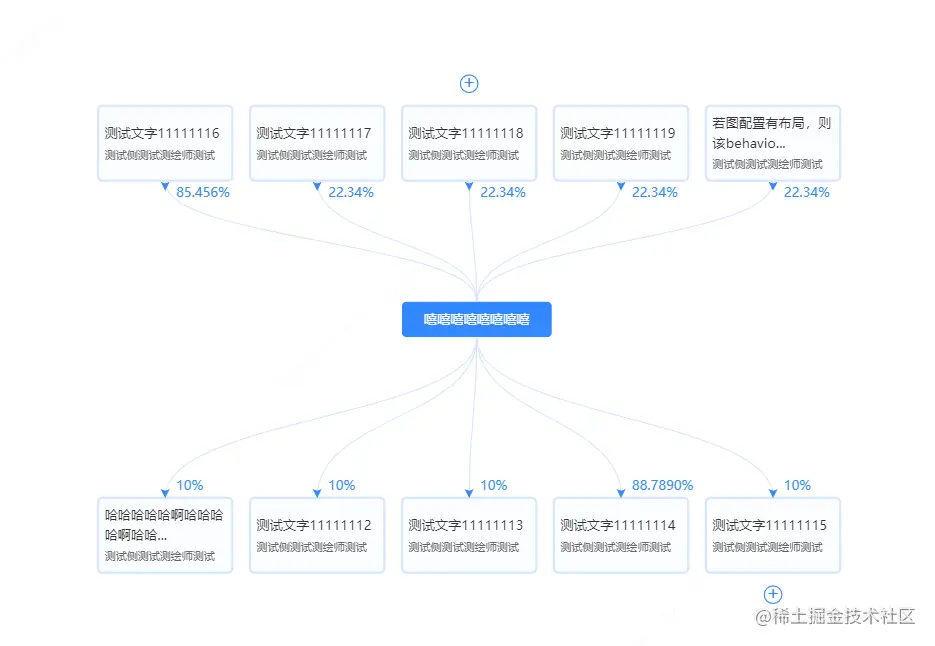
图表示例1
<template>
<div class="container">
<base-graph :options="options" graphType="TreeGraph" hoverFlag="1" ref="graph1" />
</div>
</template>
<script>
import { graph1 } from '@/assets/index.js'
import BaseGraph from '@/components/BaseGraph.vue'
import { fittingString } from '../utils/formatLabel.js'
export default {
components: {
BaseGraph
},
data () {
return {
options: {
data: graph1,
config: {
modes: {
default: [
'drag-canvas',
'zoom-canvas',
{
type: 'tooltip',
formatText (model) {
return model.name
},
offset: 10
}
]
},
defaultNode: {
type: 'flow-rect'
},
defaultEdge: {
type: 'cubic-vertical',
style: {
stroke: '#d6e7ff'
}
},
layout: {
type: 'compactBox',
direction: 'V',
preventOverlap: true,
getVGap: function getVGap () {
return 71
},
getHGap: function getHGap () {
return 60
}
}
}
}
}
},
created () {
this.renderNode()
this.$nextTick(() => {
this.collapsedRender()
})
},
methods: {
renderNode () {
G6.registerNode(
'flow-rect',
{
draw (cfg, group) {
const { name, collapsed, percent, root } = cfg
const rectConfig = {
width: root ? G6.Util.getTextSize(name, 12)[0] + 40 : 122,
height: root ? 32 : 68,
lineWidth: 2,
fontSize: 12,
fill: root ? '#3388ff' : '#f9fcff',
radius: 4,
stroke: root ? 'transparent' : '#d6e7ff',
fillOpacity: root ? 1 : 0.8,
cursor: 'pointer'
}
const textConfig = {
textAlign: 'left',
textBaseline: 'middle'
}
// 绘制矩形框
const rect = group.addShape('rect', {
attrs: {
...rectConfig,
x: 0,
y: 0
}
})
// 绘制公司名称
group.addShape('text', {
attrs: {
...textConfig,
x: root ? 20 : 6,
y: root ? 17 : rectConfig.height / 2 - 8,
text: root ? name : fittingString(name, rectConfig.width, 12).res,
fontSize: 12,
fill: root ? '#fff' : '#333',
lineHeight: '18',
cursor: 'pointer'
},
name: 'name-shape'
})
// 绘制持股数或认缴金额
const textWidth = fittingString(name, rectConfig.width, 12).currentWidth
const textY = (textWidth > rectConfig.width) ? rectConfig.height / 2 + 20 : rectConfig.height / 2 + 12
group.addShape('text', {
attrs: {
...textConfig,
x: 6,
y: textY,
text: root ? '' : '持股数:328,427,012股',
fontSize: 10,
fill: '#666',
cursor: 'pointer'
},
name: 'name-finacial'
})
group.addShape('text', {
attrs: {
...textConfig,
x: rectConfig.width / 2 + 10,
y: cfg.y > 0 ? -10 : rectConfig.height + 12,
text: percent,
fontSize: 12,
fill: '#3388ff'
},
name: 'name-percent'
})
if (!root) {
group.addShape('marker', {
attrs: {
x: rectConfig.width / 2,
y: cfg.y > 0 ? -1 : rectConfig.height + 8,
r: 3,
stroke: '#3388ff',
fill: '#3388ff',
symbol: function (x, y, r) {
return [['M', x, y], ['L', x + r, y - 2 * r], ['L', x, y - 2 * r + 1], ['L', x - r, y - 2 * r], ['Z']]
}
},
name: 'marker-shape'
})
}
const iconX = rectConfig.width / 2
const iconY = cfg.y > 0 ? rectConfig.height + 20 : -20
if (cfg.children && cfg.children.length && !root) {
group.addShape('circle', {
attrs: {
x: iconX,
y: iconY,
r: 8,
stroke: '#3388ff',
cursor: 'pointer',
fill: '#fff'
},
name: 'collapse-back',
modelId: cfg.id
})
group.addShape('text', {
attrs: {
x: iconX,
y: iconY,
textAlign: 'center',
textBaseline: 'middle',
text: (collapsed || collapsed === undefined) ? '+' : '-',
fontSize: 16,
cursor: 'pointer',
fill: '#3388ff'
},
name: 'collapse-text',
modelId: cfg.id
})
}
this.drawLinkPoints(cfg, group)
return rect
},
update (cfg, item) {
const group = item.getContainer()
this.updateLinkPoints(cfg, group)
},
setState (name, value, item) {
if (name === 'collapse') {
const group = item.getContainer()
const collapseText = group.find((e) => e.get('name') === 'collapse-text')
if (collapseText) {
if (!value) {
collapseText.attr({
text: '-'
})
} else {
collapseText.attr({
text: '+'
})
}
}
}
},
getAnchorPoints () {
return [
[0.5, 0],
[0.5, 1]
]
}
},
'rect'
)
},
collapsedRender () {
G6.Util.traverseTree(graph1, function (item) {
if (item.depth === 1) {
item.collapsed = true
}
})
this.$refs.graph1.myGraph.layout()
}
}
}
</script>
<style>
.container {
width: 100%;
height: 100%;
}
.g6-tooltip {
border: 1px solid
border-radius: 4px;
font-size: 12px;
color:
background-color: rgba(255, 255, 255, 0.9);
padding: 10px 8px;
box-shadow: rgb(174, 174, 174) 0px 0px 10px;
}
</style>
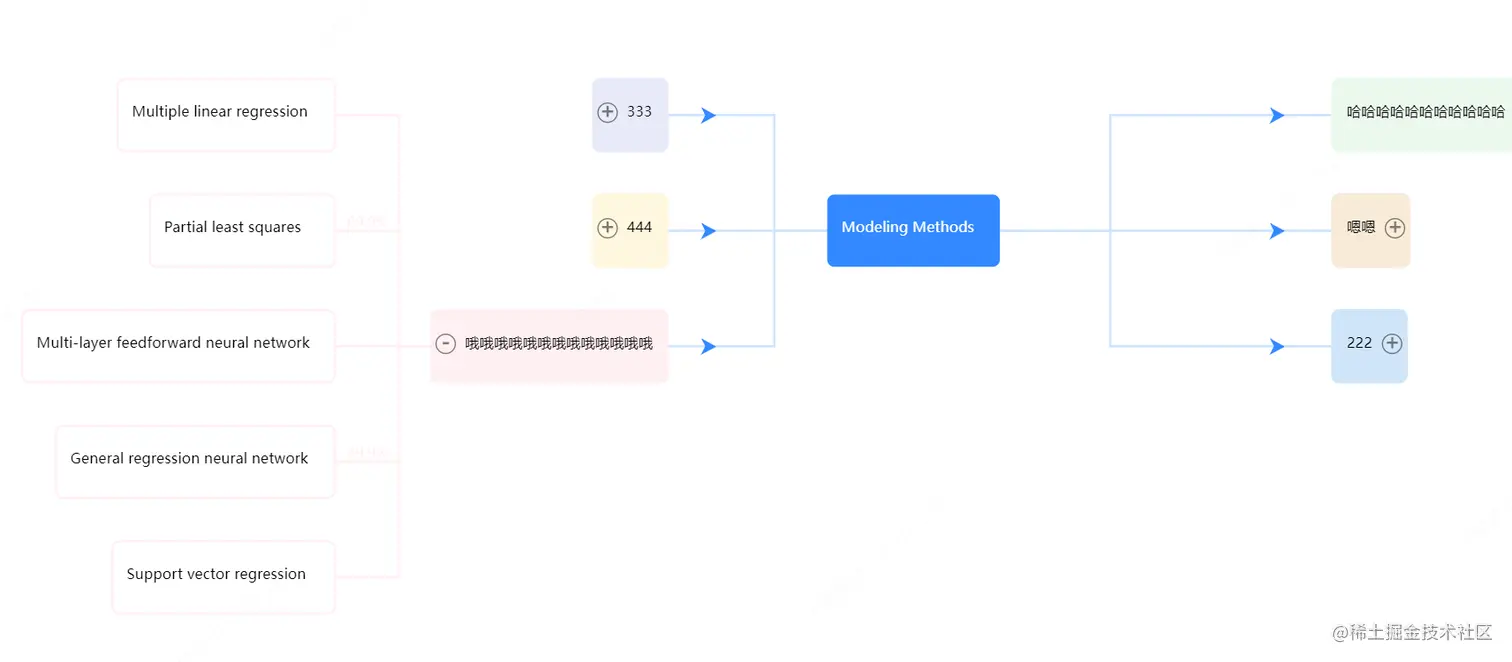
3.图表示例2
<template>
<div class="container">
<base-graph :options="options" graphType="TreeGraph" ref="graph2" />
</div>
</template>
<script>
import { graph2 } from '@/assets/index.js'
import BaseGraph from '@/components/BaseGraph.vue'
export default {
components: {
BaseGraph
},
data () {
return {
options: {
data: graph2,
config: {
modes: {
default: ['drag-canvas', 'zoom-canvas']
},
layout: {
type: 'compactBox',
direction: 'H',
getHeight: function getHeight () {
return 16
},
getWidth: function getWidth () {
return 16
},
getVGap: function getVGap () {
return 40
},
getHGap: function getHGap () {
return 130
}
},
defaultNode: {
type: 'flow-rect'
},
defaultEdge: {
type: 'flow-line'
}
}
}
}
},
created () {
this.registerFn()
},
methods: {
registerFn () {
const _this = this
G6.registerNode(
'flow-rect',
{
shapeType: 'flow-rect',
draw (cfg, group) {
const { name, collapsed, root, percent } = cfg
const width = G6.Util.getTextSize(cfg.name, 12)[0] + 40
const obj = _this.formatColor(cfg)
const rectConfig = {
width: width,
height: 60,
lineWidth: 2,
fontSize: 12,
fill: obj.rectFillColor,
radius: 6,
stroke: obj.rectStrokeColor,
opacity: 1
}
const textConfig = {
textAlign: 'left',
textBaseline: 'bottom'
}
const rectX = cfg.x > 0 ? 0 : -width
const rect = group.addShape('rect', {
attrs: {
x: rectX,
y: 0,
...rectConfig
}
})
// name title
const hasChildren = cfg.children && cfg.children.length && !cfg.root
const iconX = cfg.x > 0 ? width - 12 : -width + 12
group.addShape('text', {
attrs: {
...textConfig,
x: cfg.x > 0 ? 12 : (hasChildren ? -width + 28 : -width + 12),
y: 34,
text: name,
fontSize: 12,
fill: root ? '#fff' : '#000',
cursor: 'pointer'
},
name: 'name-shape'
})
group.addShape('text', {
attrs: {
...textConfig,
x: cfg.x > 0 ? -width / 2 : 10,
y: 30,
text: percent,
fontSize: 12,
fill: obj.rectStrokeColor
},
name: 'name-shape'
})
if (cfg.depth === 1) {
group.addShape('marker', {
attrs: {
x: cfg.x > 0 ? -40 : 40,
y: 30,
r: 6,
stroke: '#3388ff',
fill: '#3388ff',
symbol: function (x, y, r) {
return [['M', x, y], ['L', x - r - 5, y + r], ['L', x - r - 2, y], ['L', x - r - 5, y - r]]
}
},
name: 'marker-shape'
})
}
if (hasChildren) {
group.addShape('circle', {
attrs: {
x: iconX,
y: 28,
r: 8,
stroke: 'rgba(0, 0, 0, 0.5)',
cursor: 'pointer',
fill: 'rgba(255, 255, 255, 0.1)'
},
name: 'collapse-back',
modelId: cfg.id
})
group.addShape('text', {
attrs: {
x: iconX,
y: 28,
textAlign: 'center',
textBaseline: 'middle',
text: collapsed ? '+' : '-',
fontSize: 18,
fontWeight: 700,
cursor: 'pointer',
fill: 'rgba(0, 0, 0, 0.5)'
},
name: 'collapse-text',
modelId: cfg.id
})
}
this.drawLinkPoints(cfg, group)
return rect
},
update (cfg, item) {
const group = item.getContainer()
this.updateLinkPoints(cfg, group)
},
setState (name, value, item) {
if (name === 'collapse') {
const group = item.getContainer()
const collapseText = group.find((e) => e.get('name') === 'collapse-text')
if (collapseText) {
if (!value) {
collapseText.attr({
text: '-'
})
} else {
collapseText.attr({
text: '+'
})
}
}
}
},
getAnchorPoints () {
return [
[0, 0.5],
[1, 0.5]
]
}
},
'rect'
)
G6.registerEdge('flow-line', {
draw (cfg, group) {
const startPoint = cfg.startPoint
const endPoint = cfg.endPoint
const shape = group.addShape('path', {
attrs: {
lineWidth: 2,
stroke: _this.formatColor(cfg).edgeColor,
path: [
['M', startPoint.x, startPoint.y],
['L', endPoint.x / 3 + (2 / 3) * startPoint.x, startPoint.y],
['L', endPoint.x / 3 + (2 / 3) * startPoint.x, endPoint.y],
['L', endPoint.x, endPoint.y]
]
}
})
return shape
}
})
},
formatColor ({ root, flag, children, source }) {
const colorArr = ['#ecf8ee', '#f8ebd8', '#d0e5fa', '#e7eaf9', '#fff7df', '#fff0f3']
let rectFillColor = ''
let rectStrokeColor = ''
let edgeColor = ''
const colorItem = colorArr[+flag % colorArr.length]
if (root) {
rectFillColor = '#3388ff'
} else {
rectStrokeColor = colorItem
children?.length ? (rectFillColor = colorItem) : (rectFillColor = '#fff')
}
if (source === graph2.id) {
edgeColor = '#d0e4ff'
} else {
edgeColor = colorArr[+source % colorArr.length]
}
return {
rectFillColor,
rectStrokeColor,
edgeColor
}
}
}
}
</script>
<style scoped>
.container {
width: 100%;
height: 100%;
}
</style>
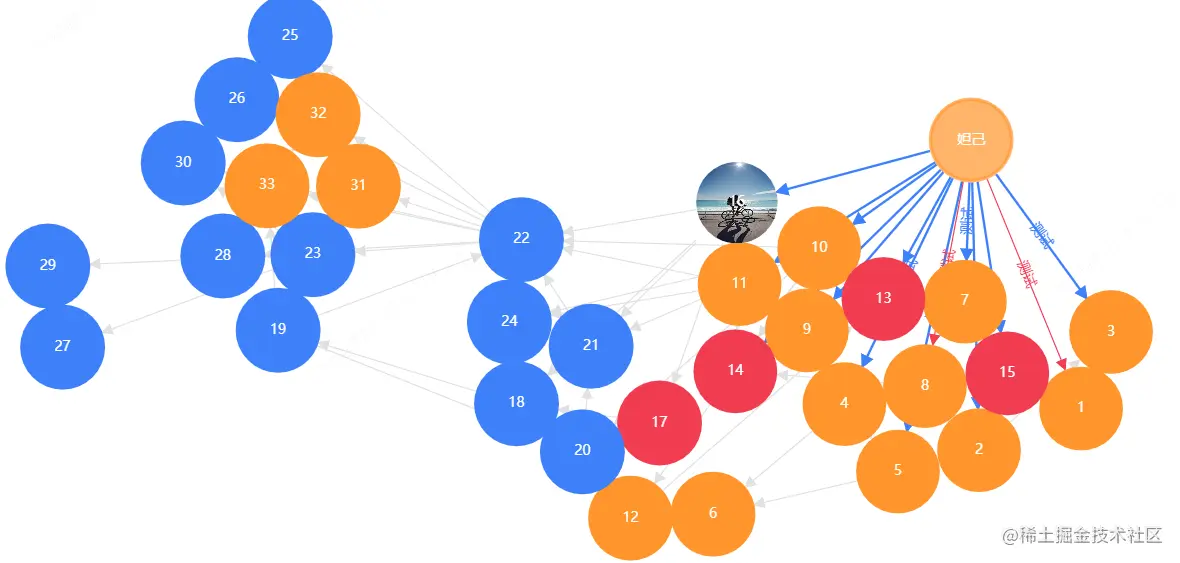
4.图表示例3
<template>
<div class="container">
<base-graph :options="options" graphType="Graph" @getDetails="hanleShowDetails" @edgeActive="handleEdgeActive" @edgeUnActive="handleEdgeUnActive" ref="graph3" />
<div v-if="showDetails" class="details-con">
<div class="close-item" @click="showDetails=false">关闭</div>
<div>提示信息</div>
</div>
</div>
</template>
<script>
import { graph3 } from '@/assets/index.js'
import BaseGraph from '@/components/BaseGraph.vue'
export default {
components: {
BaseGraph
},
data () {
return {
showDetails: false,
options: {
data: graph3,
config: {
modes: {
default: ['drag-canvas', 'drag-node', 'zoom-canvas']
},
layout: {
type: 'radial',
unitRadius: 200,
nodeSize: 70,
preventOverlap: true,
strictRadial: false
},
defaultNode: {
size: 70,
style: {
lineWidth: 3,
cursor: 'pointer'
},
labelCfg: {
position: 'center',
style: {
fill: '#fff',
fontSize: 12,
cursor: 'pointer'
}
},
clipCfg: {
show: true,
type: 'circle',
r: 35
}
},
defaultEdge: {
style: {
endArrow: {
path: 'M 0,0 L 8,4 L 8,-4 Z',
fill: '#e2e2e2'
}
},
labelCfg: {
autoRotate: true,
style: {
fill: '#e2e2e2'
}
}
}
}
}
}
},
created () {
this.colorConfig()
},
methods: {
hanleShowDetails (e) {
this.showDetails = true
},
colorConfig () {
const _this = this
const colorArr = ['#ff952c', '#f23c51', '#3e80fa']
const nodes = graph3.nodes
const clusterMap = new Map()
let clusterId = 0
nodes.forEach(function (node) {
node.label = _this.fittingString(node.label, 60, 12)
if (node.cluster && clusterMap.get(node.cluster) === undefined) {
clusterMap.set(node.cluster, clusterId)
clusterId++
}
const cid = clusterMap.get(node.cluster)
if (!node.style) {
node.style = {}
}
const colorItem = colorArr[cid % colorArr.length]
if (node.img) {
node.style.fill = 'transparent'
} else {
node.style.fill = colorItem
}
node.style.stroke = colorItem
node.stateStyles = {
nodeHover: {
opacity: 0.7
},
highlight: {
fill: node.img ? 'transparent' : colorItem,
stroke: colorItem
}
}
})
graph3.edges.forEach(edge => {
const stateStyles = {
highlight: {
stroke: '#e2e2e2'
}
}
if (edge.type === 1) {
stateStyles.highlight.stroke = '#f23c51'
} else {
stateStyles.highlight.stroke = '#3e80fa'
}
edge.stateStyles = stateStyles
})
},
fittingString (str, maxWidth, fontSize) {
let currentWidth = 0
let res = str
str = str.length > 10 ? str.substr(0, 10) + '...' : str
const pattern = new RegExp('[\u4E00-\u9FA5]+')
str.split('').forEach((letter, i) => {
if (currentWidth > maxWidth) return
if (pattern.test(letter)) {
currentWidth += fontSize
} else {
currentWidth += G6.Util.getLetterWidth(letter, fontSize)
}
if (currentWidth > maxWidth) {
res = `${str.substr(0, i)}\n${str.substr(i)}`
}
})
return res
},
handleEdgeActive ({ edge, data }) {
data.style.endArrow.fill = data.type === 1 ? '#f23c51' : '#3e80fa'
this.$refs.graph3.myGraph.updateItem(edge, {
labelCfg: {
style: {
fill: data.type === 1 ? '#f23c51' : '#3e80fa'
}
}
})
},
handleEdgeUnActive ({ edge, data }) {
data.style.endArrow.fill = '#e2e2e2'
this.$refs.graph3.myGraph.updateItem(edge, {
labelCfg: {
style: {
fill: '#e2e2e2'
}
}
})
}
}
}
</script>
<style scoped>
.container {
width: 100%;
height: 100%;
}
.details-con {
position: fixed;
right: 0;
top: 50%;
transform: translateY(-50%);
width: 200px;
padding: 10px;
background-color: #fff;
border: 1px solid #ddd;
}
.close-item {
cursor: pointer;
text-align: right;
color: #ccc;
}
</style>