Pandas Tutorial
import pandas as pd
print(pd.__version__)
1.3.4
Series create, manipulate, query, delete
arr = [0, 1, 2, 3, 4]
s1 = pd.Series(arr)
s1
0    0
1    1
2    2
3    3
4    4
dtype: int64
order = [1,2,3,4,5]
s2 = pd.Series(arr, index=order)
s2
1    0
2    1
3    2
4    3
5    4
dtype: int64
import numpy as np
n = np.random.randn(5)
index = ['a', 'b', 'c', 'd', 'e']
s2 = pd.Series(n, index=index)
s2
a    1.261043
b    0.442851
c    0.939324
d   -0.160791
e   -0.363838
dtype: float64
d = {'a':1, 'b': 2, 'c': 3, 'd': 4, 'e':5}
s3 = pd.Series(d)
s3
a    1
b    2
c    3
d    4
e    5
dtype: int64
print(s1)
s1.index = ['A', 'B', 'C', 'D', 'E']
s1
0    0
1    1
2    2
3    3
4    4
dtype: int64


A    0
B    1
C    2
D    3
E    4
dtype: int64
s1[:3]
A    0
B    1
C    2
dtype: int64
s4 = s1.append(s3)
s4
A    0
B    1
C    2
D    3
E    4
a    1
b    2
c    3
d    4
e    5
dtype: int64
s4.drop('e')
A    0
B    1
C    2
D    3
E    4
a    1
b    2
c    3
d    4
dtype: int64
Series Operations
arr1 = [0, 1, 2, 3, 4, 5, 7]
arr2 = [6, 7, 8, 9, 5]
s5 = pd.Series(arr2)
s5
0    6
1    7
2    8
3    9
4    5
dtype: int64
s6 = pd.Series(arr1)
s6
0    0
1    1
2    2
3    3
4    4
5    5
6    7
dtype: int64
s5.add(s6)
0     6.0
1     8.0
2    10.0
3    12.0
4     9.0
5     NaN
6     NaN
dtype: float64
s5.sub(s6)
0    6.0
1    6.0
2    6.0
3    6.0
4    1.0
5    NaN
6    NaN
dtype: float64
s7 = s5.mul(s6)
s7
0     0.0
1     7.0
2    16.0
3    27.0
4    20.0
5     NaN
6     NaN
dtype: float64
s5.div(s6)
0     inf
1    7.00
2    4.00
3    3.00
4    1.25
5     NaN
6     NaN
dtype: float64
print('median', s7.median())
print('max', s7.max())
print('min', s7.min())
median 16.0
max 27.0
min 0.0
Create Dataframe
dates = pd.date_range('today', periods = 6)
num_arr = np.random.randn(6, 4)
columns = ['A', 'B', 'C', 'D']
df1 = pd.DataFrame(num_arr, index = dates, columns = columns)
df1
.dataframe tbody tr th:only-of-type {
vertical-align: middle;
}
.dataframe tbody tr th {
vertical-align: top;
}
.dataframe thead th {
text-align: right;
}
|
A |
B |
C |
D |
| 2022-05-08 11:11:26.445554 |
0.430949 |
-1.806445 |
0.136876 |
-0.857627 |
| 2022-05-09 11:11:26.445554 |
0.512011 |
-0.380010 |
-2.540681 |
0.358170 |
| 2022-05-10 11:11:26.445554 |
-0.157581 |
-1.148175 |
1.218106 |
-0.137538 |
| 2022-05-11 11:11:26.445554 |
-0.790422 |
-0.234266 |
-0.241610 |
1.837469 |
| 2022-05-12 11:11:26.445554 |
-0.350637 |
0.046912 |
1.377825 |
2.307167 |
| 2022-05-13 11:11:26.445554 |
1.221375 |
-0.356688 |
-0.025396 |
0.389986 |
data = {'animal': ['cat','cat','snake','dog','dog','cat','snake','cat','dog','dog'],
'age': [2.5,3,0.5,np.nan,5,2,4.5,np.nan,7,3],
'visits': [1,3,2,3,2,3,1,1,2,1],
'priority': ['yes', 'yes', 'no', 'yes','no','no','no','yes','no','no']}
labels = ['a','b','c','d','e','f','g','h','i','j']
df2 = pd.DataFrame(data, index = labels)
df2
.dataframe tbody tr th:only-of-type {
vertical-align: middle;
}
.dataframe tbody tr th {
vertical-align: top;
}
.dataframe thead th {
text-align: right;
}
|
animal |
age |
visits |
priority |
| a |
cat |
2.5 |
1 |
yes |
| b |
cat |
3.0 |
3 |
yes |
| c |
snake |
0.5 |
2 |
no |
| d |
dog |
NaN |
3 |
yes |
| e |
dog |
5.0 |
2 |
no |
| f |
cat |
2.0 |
3 |
no |
| g |
snake |
4.5 |
1 |
no |
| h |
cat |
NaN |
1 |
yes |
| i |
dog |
7.0 |
2 |
no |
| j |
dog |
3.0 |
1 |
no |
df2.dtypes
animal       object
age         float64
visits        int64
priority     object
dtype: object
df2.head()
.dataframe tbody tr th:only-of-type {
vertical-align: middle;
}
.dataframe tbody tr th {
vertical-align: top;
}
.dataframe thead th {
text-align: right;
}
|
animal |
age |
visits |
priority |
| a |
cat |
2.5 |
1 |
yes |
| b |
cat |
3.0 |
3 |
yes |
| c |
snake |
0.5 |
2 |
no |
| d |
dog |
NaN |
3 |
yes |
| e |
dog |
5.0 |
2 |
no |
df2.tail(3)
.dataframe tbody tr th:only-of-type {
vertical-align: middle;
}
.dataframe tbody tr th {
vertical-align: top;
}
.dataframe thead th {
text-align: right;
}
|
animal |
age |
visits |
priority |
| h |
cat |
NaN |
1 |
yes |
| i |
dog |
7.0 |
2 |
no |
| j |
dog |
3.0 |
1 |
no |
print(df2.index)
df2.columns
Index(['a', 'b', 'c', 'd', 'e', 'f', 'g', 'h', 'i', 'j'], dtype='object')


Index(['animal', 'age', 'visits', 'priority'], dtype='object')
df2.values
array([['cat', 2.5, 1, 'yes'],
       ['cat', 3.0, 3, 'yes'],
       ['snake', 0.5, 2, 'no'],
       ['dog', nan, 3, 'yes'],
       ['dog', 5.0, 2, 'no'],
       ['cat', 2.0, 3, 'no'],
       ['snake', 4.5, 1, 'no'],
       ['cat', nan, 1, 'yes'],
       ['dog', 7.0, 2, 'no'],
       ['dog', 3.0, 1, 'no']], dtype=object)
df2.describe()
.dataframe tbody tr th:only-of-type {
vertical-align: middle;
}
.dataframe tbody tr th {
vertical-align: top;
}
.dataframe thead th {
text-align: right;
}
|
age |
visits |
| count |
8.000000 |
10.000000 |
| mean |
3.437500 |
1.900000 |
| std |
2.007797 |
0.875595 |
| min |
0.500000 |
1.000000 |
| 25% |
2.375000 |
1.000000 |
| 50% |
3.000000 |
2.000000 |
| 75% |
4.625000 |
2.750000 |
| max |
7.000000 |
3.000000 |
df2.T
.dataframe tbody tr th:only-of-type {
vertical-align: middle;
}
.dataframe tbody tr th {
vertical-align: top;
}
.dataframe thead th {
text-align: right;
}
|
a |
b |
c |
d |
e |
f |
g |
h |
i |
j |
| animal |
cat |
cat |
snake |
dog |
dog |
cat |
snake |
cat |
dog |
dog |
| age |
2.5 |
3.0 |
0.5 |
NaN |
5.0 |
2.0 |
4.5 |
NaN |
7.0 |
3.0 |
| visits |
1 |
3 |
2 |
3 |
2 |
3 |
1 |
1 |
2 |
1 |
| priority |
yes |
yes |
no |
yes |
no |
no |
no |
yes |
no |
no |
df2.sort_values(by='age')
.dataframe tbody tr th:only-of-type {
vertical-align: middle;
}
.dataframe tbody tr th {
vertical-align: top;
}
.dataframe thead th {
text-align: right;
}
|
animal |
age |
visits |
priority |
| c |
snake |
0.5 |
2 |
no |
| f |
cat |
2.0 |
3 |
no |
| a |
cat |
2.5 |
1 |
yes |
| b |
cat |
3.0 |
3 |
yes |
| j |
dog |
3.0 |
1 |
no |
| g |
snake |
4.5 |
1 |
no |
| e |
dog |
5.0 |
2 |
no |
| i |
dog |
7.0 |
2 |
no |
| d |
dog |
NaN |
3 |
yes |
| h |
cat |
NaN |
1 |
yes |
df2[1:3]
.dataframe tbody tr th:only-of-type {
vertical-align: middle;
}
.dataframe tbody tr th {
vertical-align: top;
}
.dataframe thead th {
text-align: right;
}
|
animal |
age |
visits |
priority |
| b |
cat |
3.0 |
3 |
yes |
| c |
snake |
0.5 |
2 |
no |
df2[['age', 'visits']]
.dataframe tbody tr th:only-of-type {
vertical-align: middle;
}
.dataframe tbody tr th {
vertical-align: top;
}
.dataframe thead th {
text-align: right;
}
|
age |
visits |
| a |
2.5 |
1 |
| b |
3.0 |
3 |
| c |
0.5 |
2 |
| d |
NaN |
3 |
| e |
5.0 |
2 |
| f |
2.0 |
3 |
| g |
4.5 |
1 |
| h |
NaN |
1 |
| i |
7.0 |
2 |
| j |
3.0 |
1 |
df2.iloc[1:3]
.dataframe tbody tr th:only-of-type {
vertical-align: middle;
}
.dataframe tbody tr th {
vertical-align: top;
}
.dataframe thead th {
text-align: right;
}
|
animal |
age |
visits |
priority |
| b |
cat |
3.0 |
3 |
yes |
| c |
snake |
0.5 |
2 |
no |
df3 = df2.copy()
df3
.dataframe tbody tr th:only-of-type {
vertical-align: middle;
}
.dataframe tbody tr th {
vertical-align: top;
}
.dataframe thead th {
text-align: right;
}
|
animal |
age |
visits |
priority |
| a |
cat |
2.5 |
1 |
yes |
| b |
cat |
3.0 |
3 |
yes |
| c |
snake |
0.5 |
2 |
no |
| d |
dog |
NaN |
3 |
yes |
| e |
dog |
5.0 |
2 |
no |
| f |
cat |
2.0 |
3 |
no |
| g |
snake |
4.5 |
1 |
no |
| h |
cat |
NaN |
1 |
yes |
| i |
dog |
7.0 |
2 |
no |
| j |
dog |
3.0 |
1 |
no |
df3.isnull()
.dataframe tbody tr th:only-of-type {
vertical-align: middle;
}
.dataframe tbody tr th {
vertical-align: top;
}
.dataframe thead th {
text-align: right;
}
|
animal |
age |
visits |
priority |
| a |
False |
False |
False |
False |
| b |
False |
False |
False |
False |
| c |
False |
False |
False |
False |
| d |
False |
True |
False |
False |
| e |
False |
False |
False |
False |
| f |
False |
False |
False |
False |
| g |
False |
False |
False |
False |
| h |
False |
True |
False |
False |
| i |
False |
False |
False |
False |
| j |
False |
False |
False |
False |
df3.loc['f', 'age'] = 1.5
df3
.dataframe tbody tr th:only-of-type {
vertical-align: middle;
}
.dataframe tbody tr th {
vertical-align: top;
}
.dataframe thead th {
text-align: right;
}
|
animal |
age |
visits |
priority |
| a |
cat |
2.5 |
1 |
yes |
| b |
cat |
3.0 |
3 |
yes |
| c |
snake |
0.5 |
2 |
no |
| d |
dog |
NaN |
3 |
yes |
| e |
dog |
5.0 |
2 |
no |
| f |
cat |
1.5 |
3 |
no |
| g |
snake |
4.5 |
1 |
no |
| h |
cat |
NaN |
1 |
yes |
| i |
dog |
7.0 |
2 |
no |
| j |
dog |
3.0 |
1 |
no |
df3[['age', 'visits']].mean()
age       3.375
visits    1.900
dtype: float64
print(df3['visits'].sum())
print(df3.max())
df3.min()
19
animal      snake
age           7.0
visits          3
priority      yes
dtype: object


animal      cat
age         0.5
visits        1
priority     no
dtype: object
string = pd.Series(['A', 'C', 'D', 'Aaa', 'BaCa', np.nan, 'CBA', 'cow', 'owl'])
print(string.str.lower())
string.str.upper()
0       a
1       c
2       d
3     aaa
4    baca
5     NaN
6     cba
7     cow
8     owl
dtype: object


0       A
1       C
2       D
3     AAA
4    BACA
5     NaN
6     CBA
7     COW
8     OWL
dtype: object
Operations for DataFrame missing values
df4 = df3.copy()
meanAge = df4['age'].mean()
df4['age'] = df4['age'].fillna(meanAge)
df4
.dataframe tbody tr th:only-of-type {
vertical-align: middle;
}
.dataframe tbody tr th {
vertical-align: top;
}
.dataframe thead th {
text-align: right;
}
|
animal |
age |
visits |
priority |
| a |
cat |
2.500 |
1 |
yes |
| b |
cat |
3.000 |
3 |
yes |
| c |
snake |
0.500 |
2 |
no |
| d |
dog |
3.375 |
3 |
yes |
| e |
dog |
5.000 |
2 |
no |
| f |
cat |
1.500 |
3 |
no |
| g |
snake |
4.500 |
1 |
no |
| h |
cat |
3.375 |
1 |
yes |
| i |
dog |
7.000 |
2 |
no |
| j |
dog |
3.000 |
1 |
no |
df5 = df3.copy()
df5.dropna(how='any')
.dataframe tbody tr th:only-of-type {
vertical-align: middle;
}
.dataframe tbody tr th {
vertical-align: top;
}
.dataframe thead th {
text-align: right;
}
|
animal |
age |
visits |
priority |
| a |
cat |
2.5 |
1 |
yes |
| b |
cat |
3.0 |
3 |
yes |
| c |
snake |
0.5 |
2 |
no |
| e |
dog |
5.0 |
2 |
no |
| f |
cat |
1.5 |
3 |
no |
| g |
snake |
4.5 |
1 |
no |
| i |
dog |
7.0 |
2 |
no |
| j |
dog |
3.0 |
1 |
no |
DataFrame file operations
df3.to_csv('animal.csv')
df_animal = pd.read_csv('animal.csv')
df_animal.head(3)
.dataframe tbody tr th:only-of-type {
vertical-align: middle;
}
.dataframe tbody tr th {
vertical-align: top;
}
.dataframe thead th {
text-align: right;
}
|
Unnamed: 0 |
animal |
age |
visits |
priority |
| 0 |
a |
cat |
2.5 |
1 |
yes |
| 1 |
b |
cat |
3.0 |
3 |
yes |
| 2 |
c |
snake |
0.5 |
2 |
no |
df3.to_excel('animal.xlsx', sheet_name="animal")
df_animal2 = pd.read_excel('animal.xlsx', 'animal', index_col=None, na_values=['NA'])
df_animal2
.dataframe tbody tr th:only-of-type {
vertical-align: middle;
}
.dataframe tbody tr th {
vertical-align: top;
}
.dataframe thead th {
text-align: right;
}
|
Unnamed: 0 |
animal |
age |
visits |
priority |
| 0 |
a |
cat |
2.5 |
1 |
yes |
| 1 |
b |
cat |
3.0 |
3 |
yes |
| 2 |
c |
snake |
0.5 |
2 |
no |
| 3 |
d |
dog |
NaN |
3 |
yes |
| 4 |
e |
dog |
5.0 |
2 |
no |
| 5 |
f |
cat |
1.5 |
3 |
no |
| 6 |
g |
snake |
4.5 |
1 |
no |
| 7 |
h |
cat |
NaN |
1 |
yes |
| 8 |
i |
dog |
7.0 |
2 |
no |
| 9 |
j |
dog |
3.0 |
1 |
no |
Visualization in Pandas
import numpy as np
%matplotlib inline
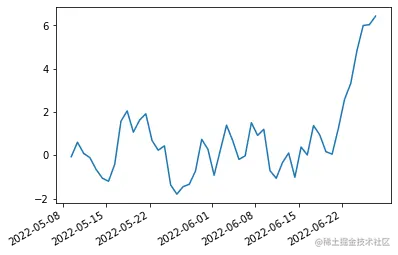
ts = pd.Series(np.random.randn(50), index = pd.date_range('today', periods=50))
ts = ts.cumsum()
ts.plot()
<AxesSubplot:>
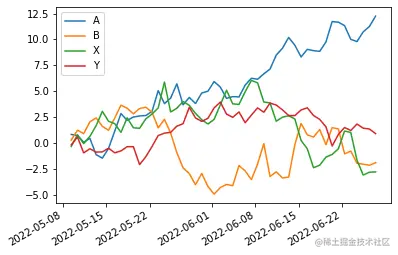
df = pd.DataFrame(np.random.randn(50, 4),  index = ts.index, columns = ['A', 'B', 'X', 'Y'])
df = df.cumsum()
df.plot()
<AxesSubplot:>
Practice example
Remove repeated data using pandas
df = pd.DataFrame({'A': [1, 2, 2, 2, 4, 4, 5, 5, 6, 6, 7, 8, 8]})
df.loc[df['A'].shift() != df['A']]
.dataframe tbody tr th:only-of-type {
vertical-align: middle;
}
.dataframe tbody tr th {
vertical-align: top;
}
.dataframe thead th {
text-align: right;
}
|
A |
| 0 |
1 |
| 1 |
2 |
| 4 |
4 |
| 6 |
5 |
| 8 |
6 |
| 10 |
7 |
| 11 |
8 |


