效果图

代码实现
- main.js引入echarts (版本要大于5.0.0)
import * as echarts from 'echarts';
Vue.prototype.$echarts = echarts
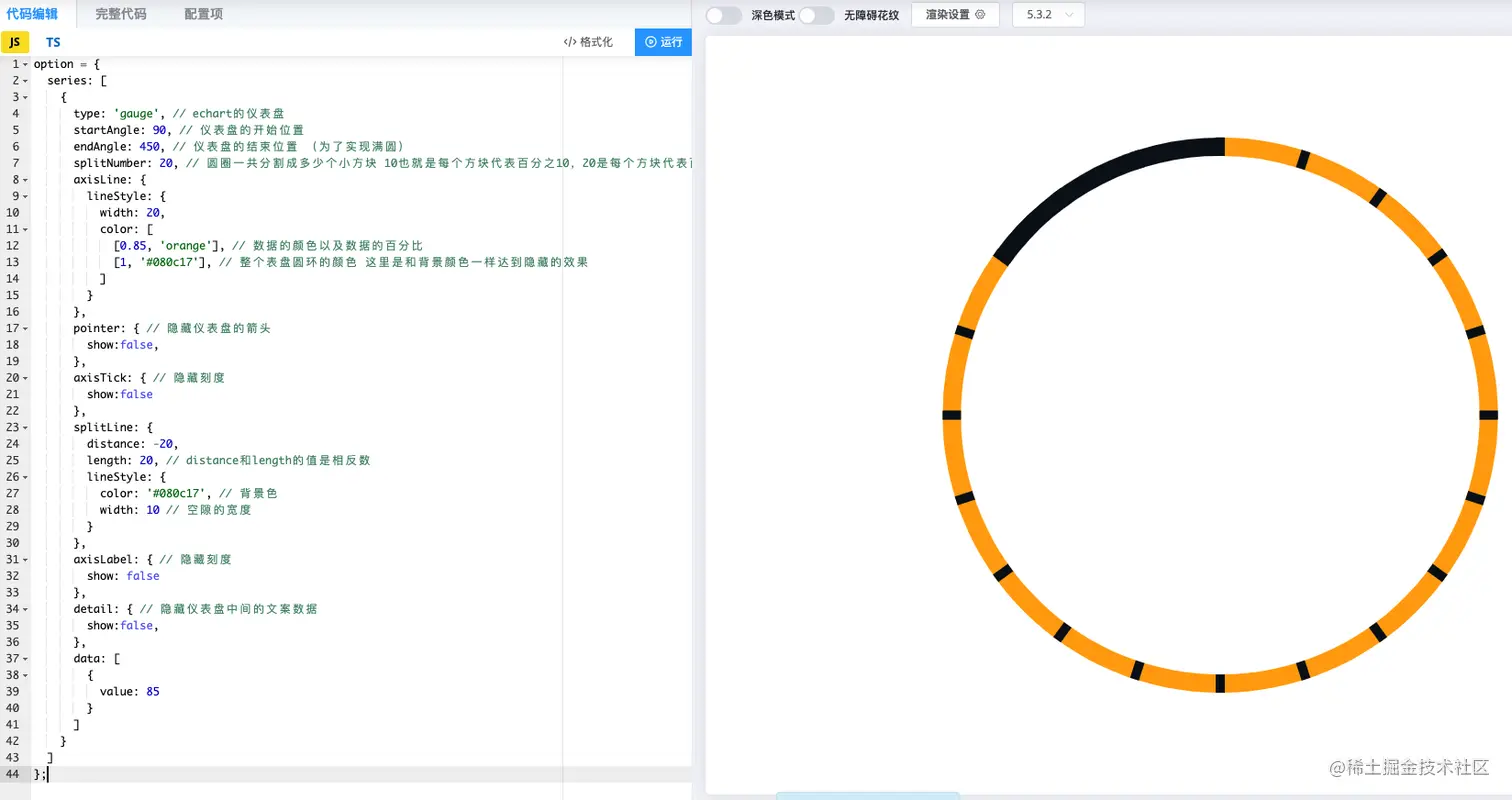
- js配置echarts 这里有几个配置点 主要借助仪表盘进行配置项的修改 配置的是效果图第一个图表
const option = {
series: [
{
type: 'gauge',
startAngle: 90,
endAngle: 450,
splitNumber: 10,
axisLine: {
lineStyle: {
width: 10,
color: [
[0.85, 'orange'],
[1, '#080c17'],
]
}
},
pointer: {
show:false,
},
axisTick: {
show:false
},
splitLine: {
distance: -10,
length: 10,
lineStyle: {
color: '#080c17',
width: 4
}
},
axisLabel: {
show: false
},
detail: {
show:false,
},
data: [
{
value: 85
}
]
}
]
}
export {
wasteOption
}
- dom绘制渲染
<template>
    <div class="circle">
        <div id='echart'></div>
        <span>85%</span>
      </div>
</template>

<script>
    mounted () {
        this.$nextTick(() => {
            let chart = this.$echarts.init(document.getElementById('echart'));
            chart.setOption(option);
        })
    }
</script>

<style>
    .circle{
        width: 4vw;
        height: 4vw;
        border: 1px solid #ddd;
        color: #fff;
        font-size: 12px;
        border-radius: 50%;
        display: flex;
        align-items: center;
        justify-content: center;
        position: relative;
        span{
          position: absolute;
          left: 50%;
          top: 50%;
          transform: translate(-50%, -50%);
        }
        div{
          width: 110%;
          height: 110%;
          position: absolute;
          left: 50%;
          top: 50%;
          transform: translate(-50%, -50%);
        }
      }
</style>
- 下面附上echarts官方文档配置编辑示例的地址 和 配置参数
https://echarts.apache.org/examples/zh/editor.html?c=gauge
over 祝福大家发大财


